Bite-sized Insights about
 
Providing you with data-based insights about things happening around you.
Search results for
South Africa’s GDP per capita has grown in 21 of the past 24 years, climbing to a record high in 2024
  • South Africa’s GDP per capita rose from $440 in 2000 to an all-time high of $2,692 in 2024.
  • Growth was relatively steady in the 2000s, with notable jumps after 2006 and again in the post-pandemic years.
  • Despite dips in 2008 (global financial crisis) and 2020 (COVID-19 shock), the economy showed resilience with quick rebounds.
  • By 2024, South Africa achieved its strongest per capita GDP on record, cementing its role as one of Africa’s leading middle-income economies.
  • The country recorded growth in 21 of the past 24 years.

Algeria’s GDP per capita has risen four straight years since 2020, edging closer to its 2014 oil-driven peak
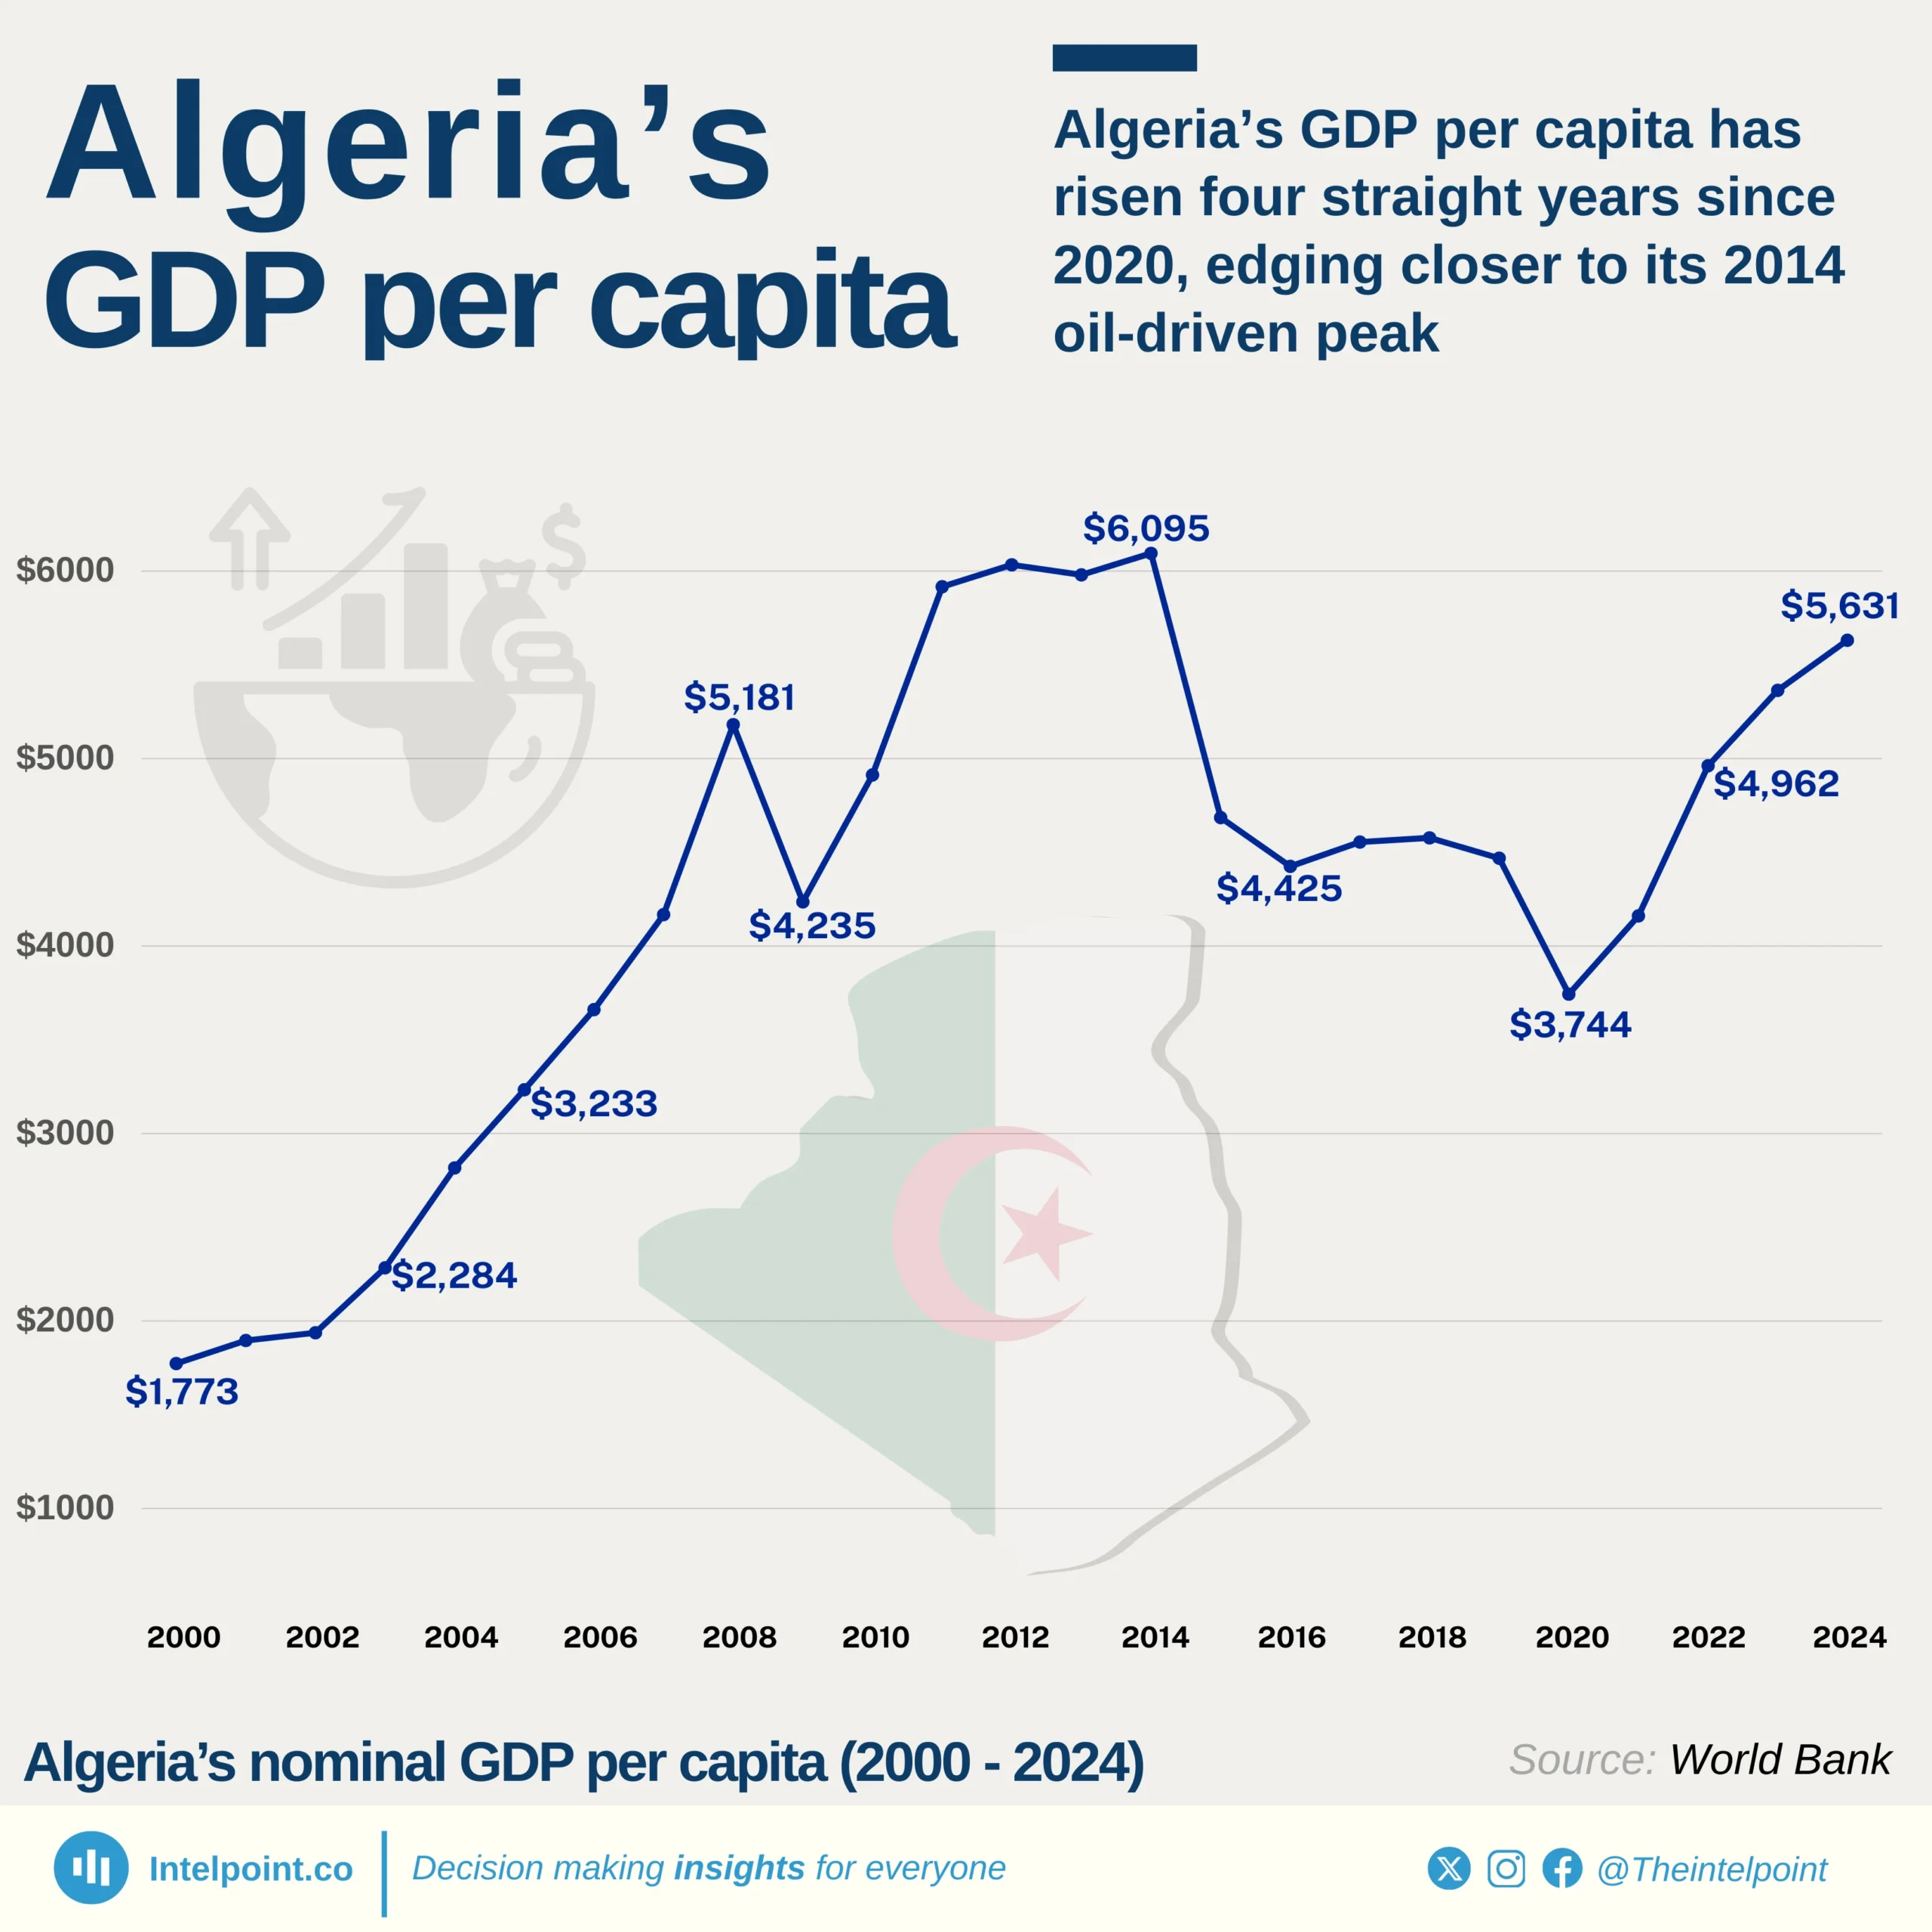
  • Algeria’s GDP per capita more than tripled in 25 years, rising from $1,772.9 in 2000 to $5,631.2 in 2024.
  • The 2000s boom saw rapid growth, peaking at $5,180.9 in 2008, fuelled by high oil and gas prices.
  • Between 2014 and 2016, GDP per capita fell from $6,094.7 to $4,425.0, reflecting oil price collapses and domestic fiscal strain.
  • After pandemic-era lows in 2020 ($3,743.5), Algeria rebounded to its second-highest level on record in 2024 ($5,631.2), regaining its regional standing.

Egypt’s GDP per capita has more than doubled since 2000, but has fallen sharply since its 2022 peak
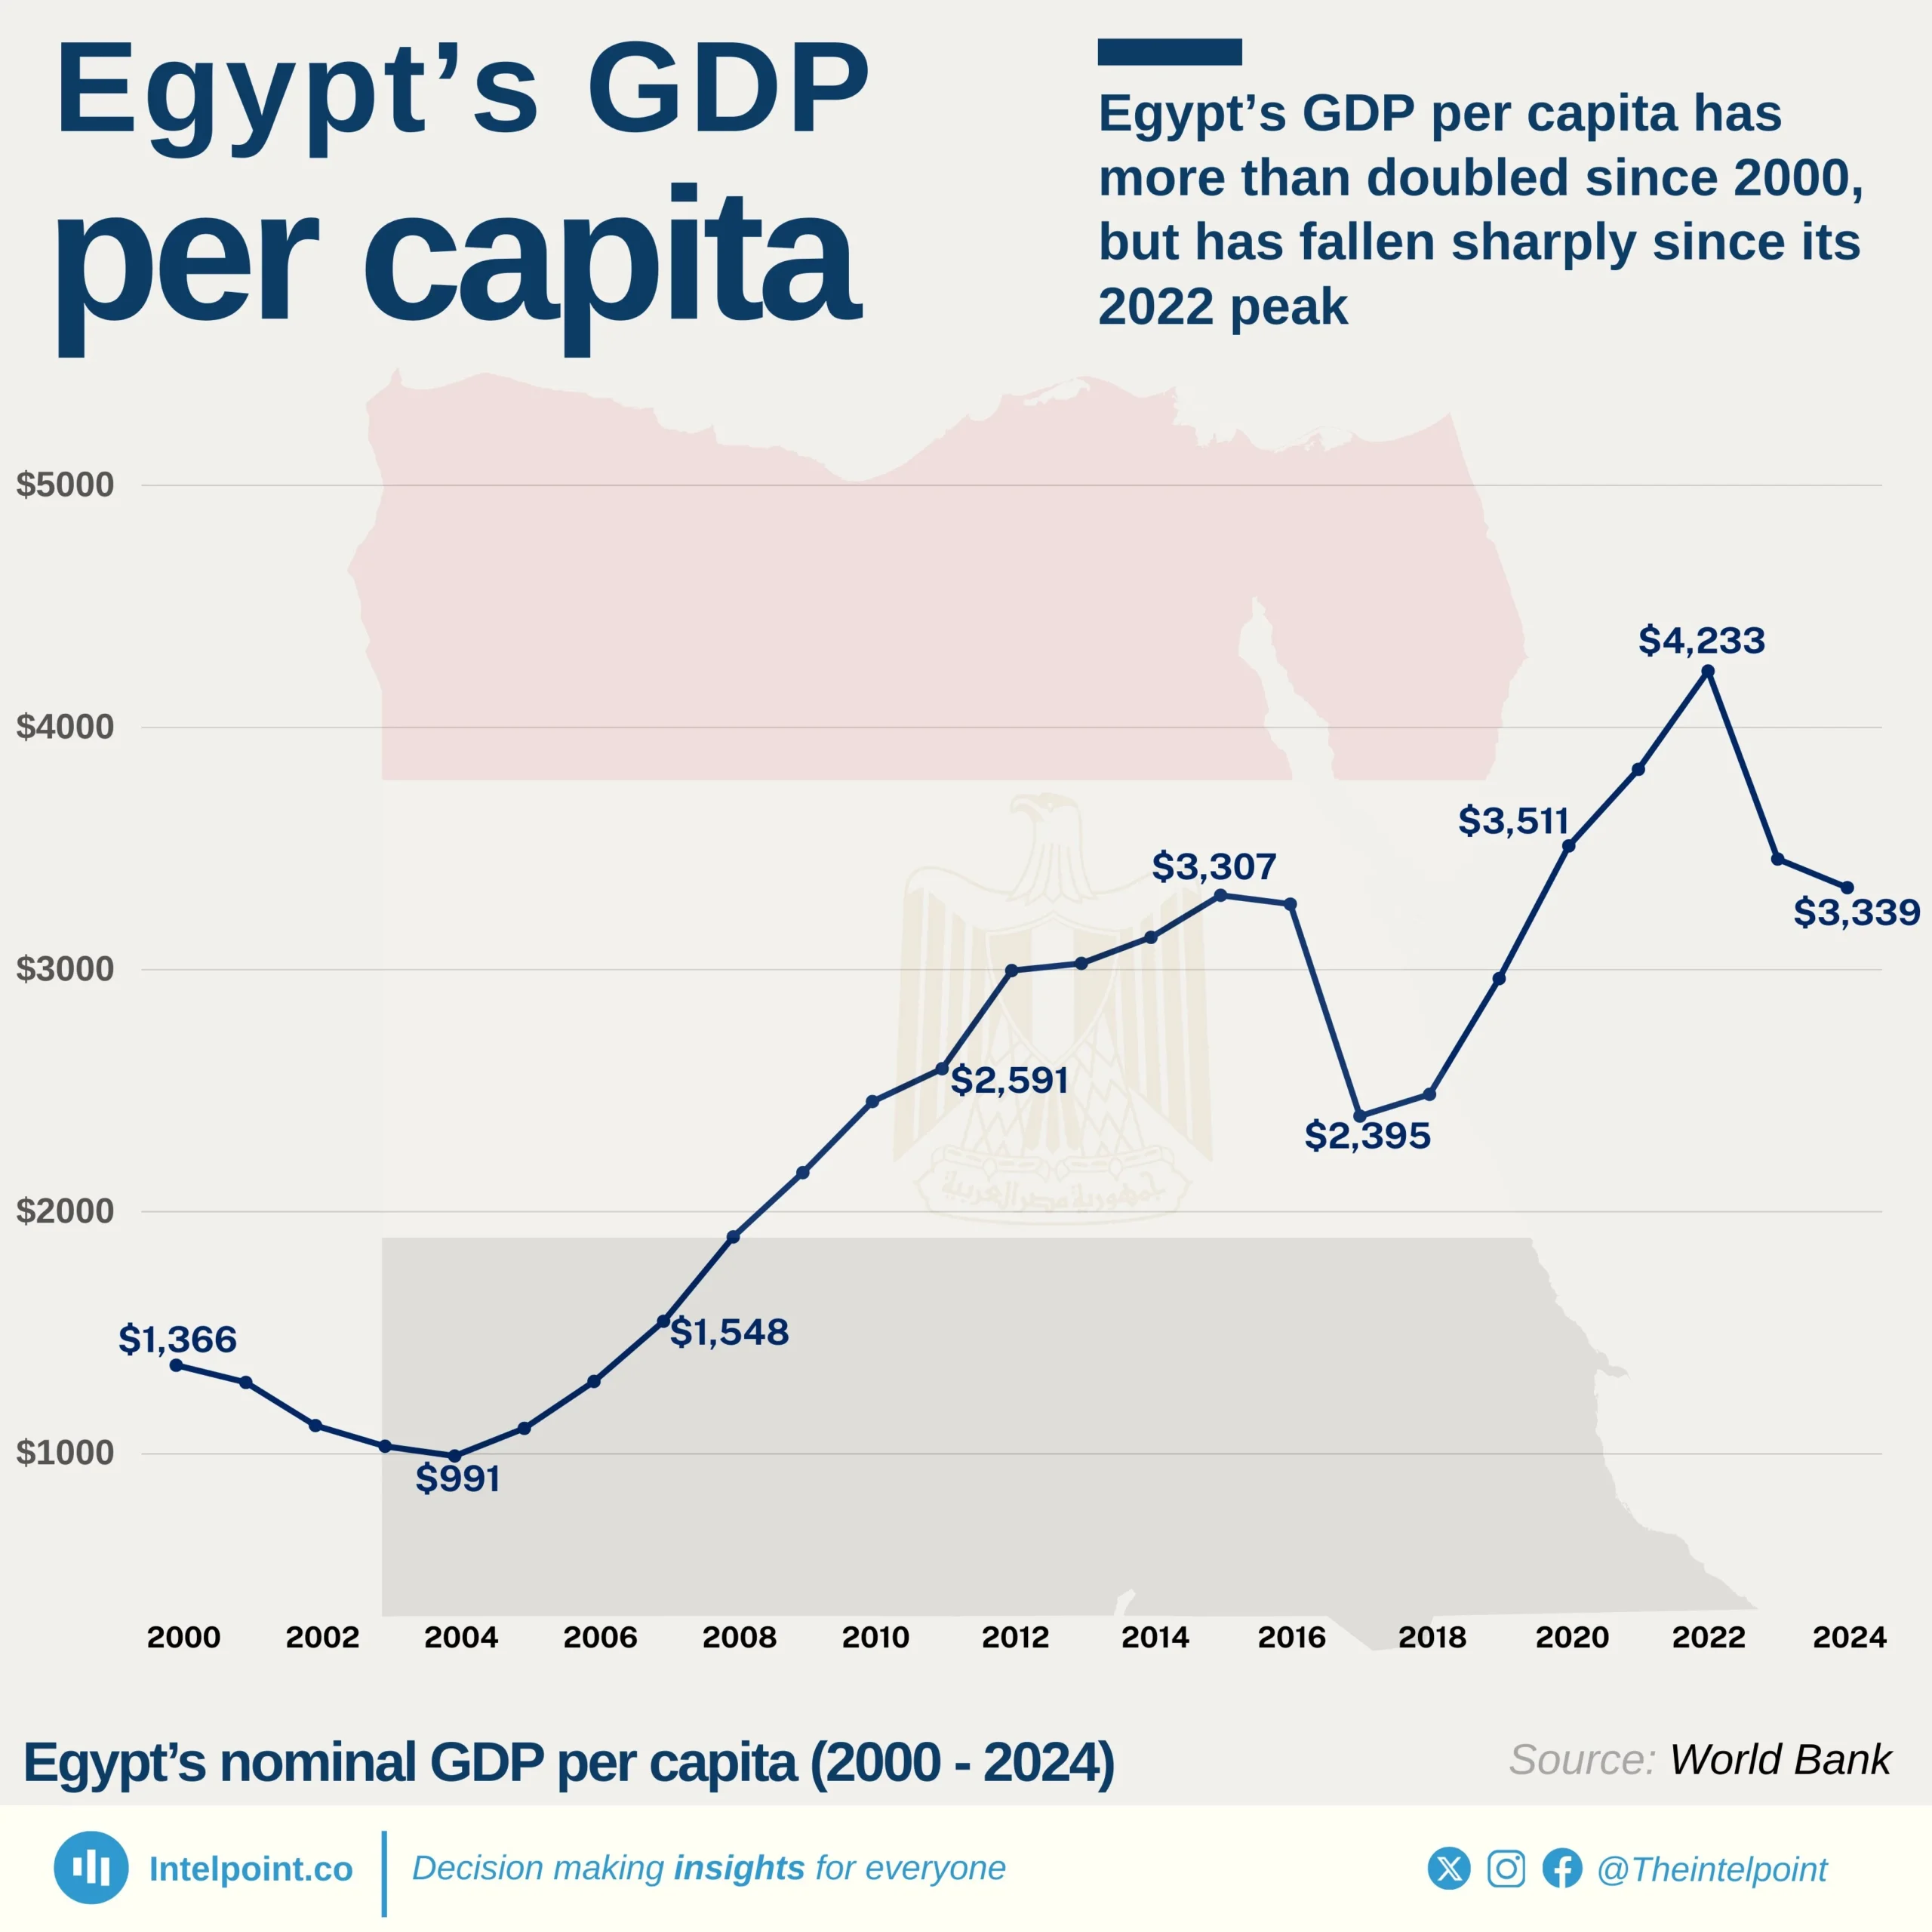
  • Egypt’s GDP per capita grew from $1,366 in 2000 to $3,339 in 2024, a 144% increase over 25 years.
  • The economy peaked at $4,233 in 2022, marking the highest point in the series before a two-year decline.
  • Sustained growth was driven by the 2000s and 2010s, with resilience after the 2008 financial crisis and Arab Spring disruptions.
  • The dip after 2022 reflects external pressures, currency adjustments, and inflationary challenges, though per capita levels remain well above early 2000s baselines.

Burkina Faso’s GDP per capita has nearly quadrupled since 2000, marking a 297% increase over 25 years
  • Burkina Faso's GDP per capita rose from $248.9 in 2000 to an estimated $987.3 in 2024, marking a nearly 297% increase over 25 years.
  • The country saw its largest single-year jump between 2007 and 2008, rising $104.7 from $514.7 to $619.4.
  • Economic downturns were visible in 2009 (-2.9%), 2015 (-17.6%), and 2022 (-6.6%), showing vulnerability to shocks.
  • Since 2020, GDP per capita has grown 19.6%, with 2024 recording the highest value in the dataset.

Nigeria’s GDP per capita dropped $710 below Sub-Saharan Africa’s average in 2024, its widest gap in 25 years
  • Nigeria’s GDP per capita stayed above the Sub-Saharan African average from 2002 to 2023.
  • In 2014, Nigeria peaked at $3,088.7, far ahead of the region’s $1,886.5.
  • The post-2014 oil crash triggered a prolonged economic slide for Nigeria.
  • By 2023, Nigeria ($1,596.6) and Sub-Saharan Africa ($1,580.8) were nearly identical.
  • In 2024, Nigeria fell sharply to $806.9, $710 below the regional average of $1,516.4, its widest gap in over two decades.

Ghana’s GDP per capita has grown nearly tenfold since 2000, despite years of economic volatility
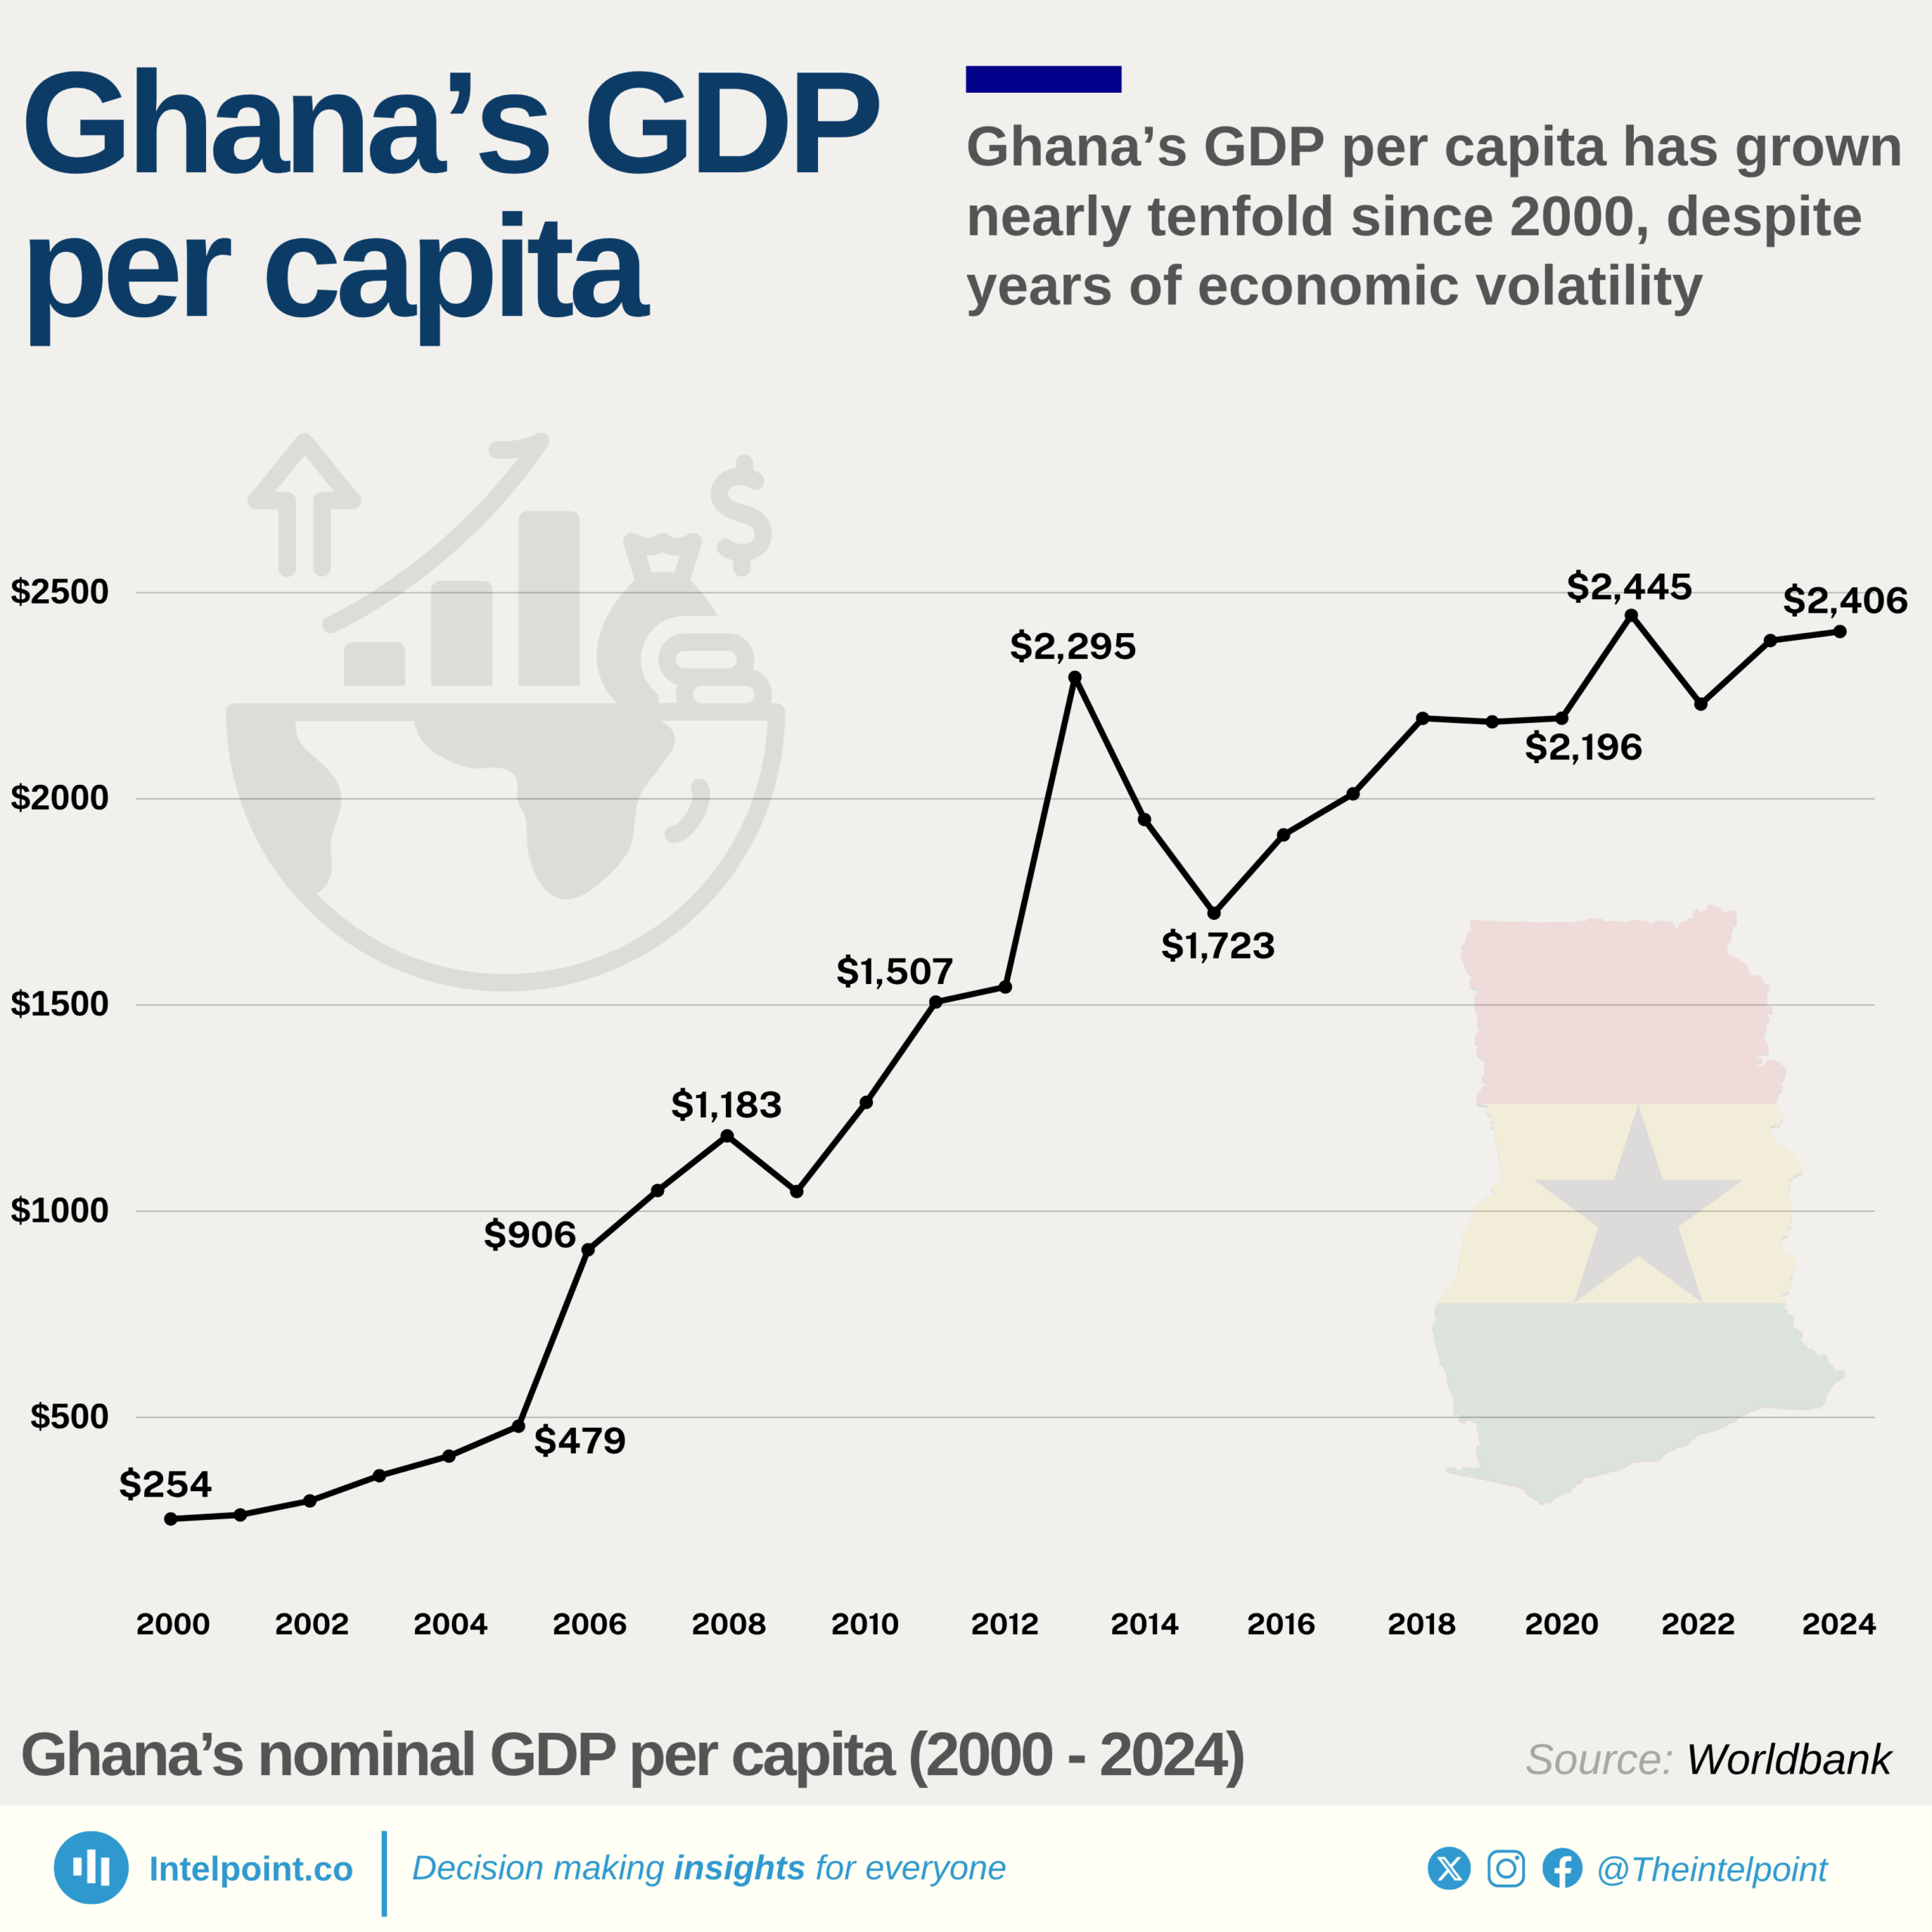
  • Between 2000 and 2008, Ghana’s GDP per capita rose from $253.7 to $1,182.7, more than quadrupling in just nine years.
  • It peaked in 2013 at $2,294.8 but declined sharply after 2014.
  • After a dip in 2022, it rebounded to $2,405.8 in 2024, nearly 10 times higher than the figure in 2000.
  • The declines seen in 2009, 2015, and 2022 mirror global and local crises, including the 2008 financial crash, commodity shocks, and post-COVID disruptions.

Nigeria’s nominal GDP has grown by over 80%, but real GDP has grown by only 6%
  • Real GDP grew from ₦205.1 trillion in 2019 to ₦217.8 trillion in 2024, a modest 6% rise.
  • Nominal GDP jumped from ₦205.1 trillion to ₦372.8 trillion over the same period, an 82% increase.
  • The gap between nominal and real GDP widened sharply after 2021, reaching ₦155 trillion in 2024.
  • Nominal GDP has grown year-on-year, with the steepest jump between 2023 (₦314.0 trillion) and 2024 (₦372.8 trillion).
  • Inflationary pressures have driven nominal gains, masking subdued real economic expansion.

In 2023, Kiribati took the lead in global educational investment by allocating 16.4% of its budget
Key Takeaways:
  • In 2023, Kiribati spent the largest % of its GDP on education, amounting to 16.39%.
  • Kiribati, Tuvalu, and Vanuatu each allocated over 10% of their GDP to education.
  • Bolivia and the Solomon Islands each directed around 8.3% of their GDP spending towards education.
  • The top ten countries dedicated approximately 6.6% to 16.4% of their GDP to education.

Nigeria's Agriculture Sector Contributes ₦19.3 Billion to GDP in 2023
  • Nigeria’s agricultural GDP reached ₦19.3 billion in 2023, showing minimal growth.
  • From 2013 to 2023, agriculture played a key role in Nigeria’s economic growth, averaging 24.43% of the total annual GDP.
  • Agriculture's share in the total GDP in 2020 (25.90%) dropped to 24.76% in 2023.
  • Post-pandemic recovery in the agricultural sector has been robust, with consistent growth from ₦18.3 billion in 2020 to ₦19.3 billion in 2023.
  • Agriculture remains a critical driver of Nigeria’s economy, ensuring food security and supporting livelihoods across the country.

The Finance and Insurance sector led Nigeria's 3.2% GDP growth in the first 9 months of 2024
Nigeria’s GDP for 2024 is up by 3.2% so far, with key sectors driving the growth. In the first nine months of 2024, Finance and Insurance took the lead with a 30.3% increase, followed by Water Supply & Waste Management at 8.3%, and Mining and Quarrying with 5.7% growth. These are the sectors leading Nigeria’s real GDP growth.

1 2

Can’t find what you’re looking for? Please fill the form below
Contact Form Demo
SIGN UP TO OUR NEWSLETTER
Get periodic updates about the African startup space, access to our reports, among others.
Subscribe Here
Subscription Form

A product of Techpoint Africa. All rights reserved