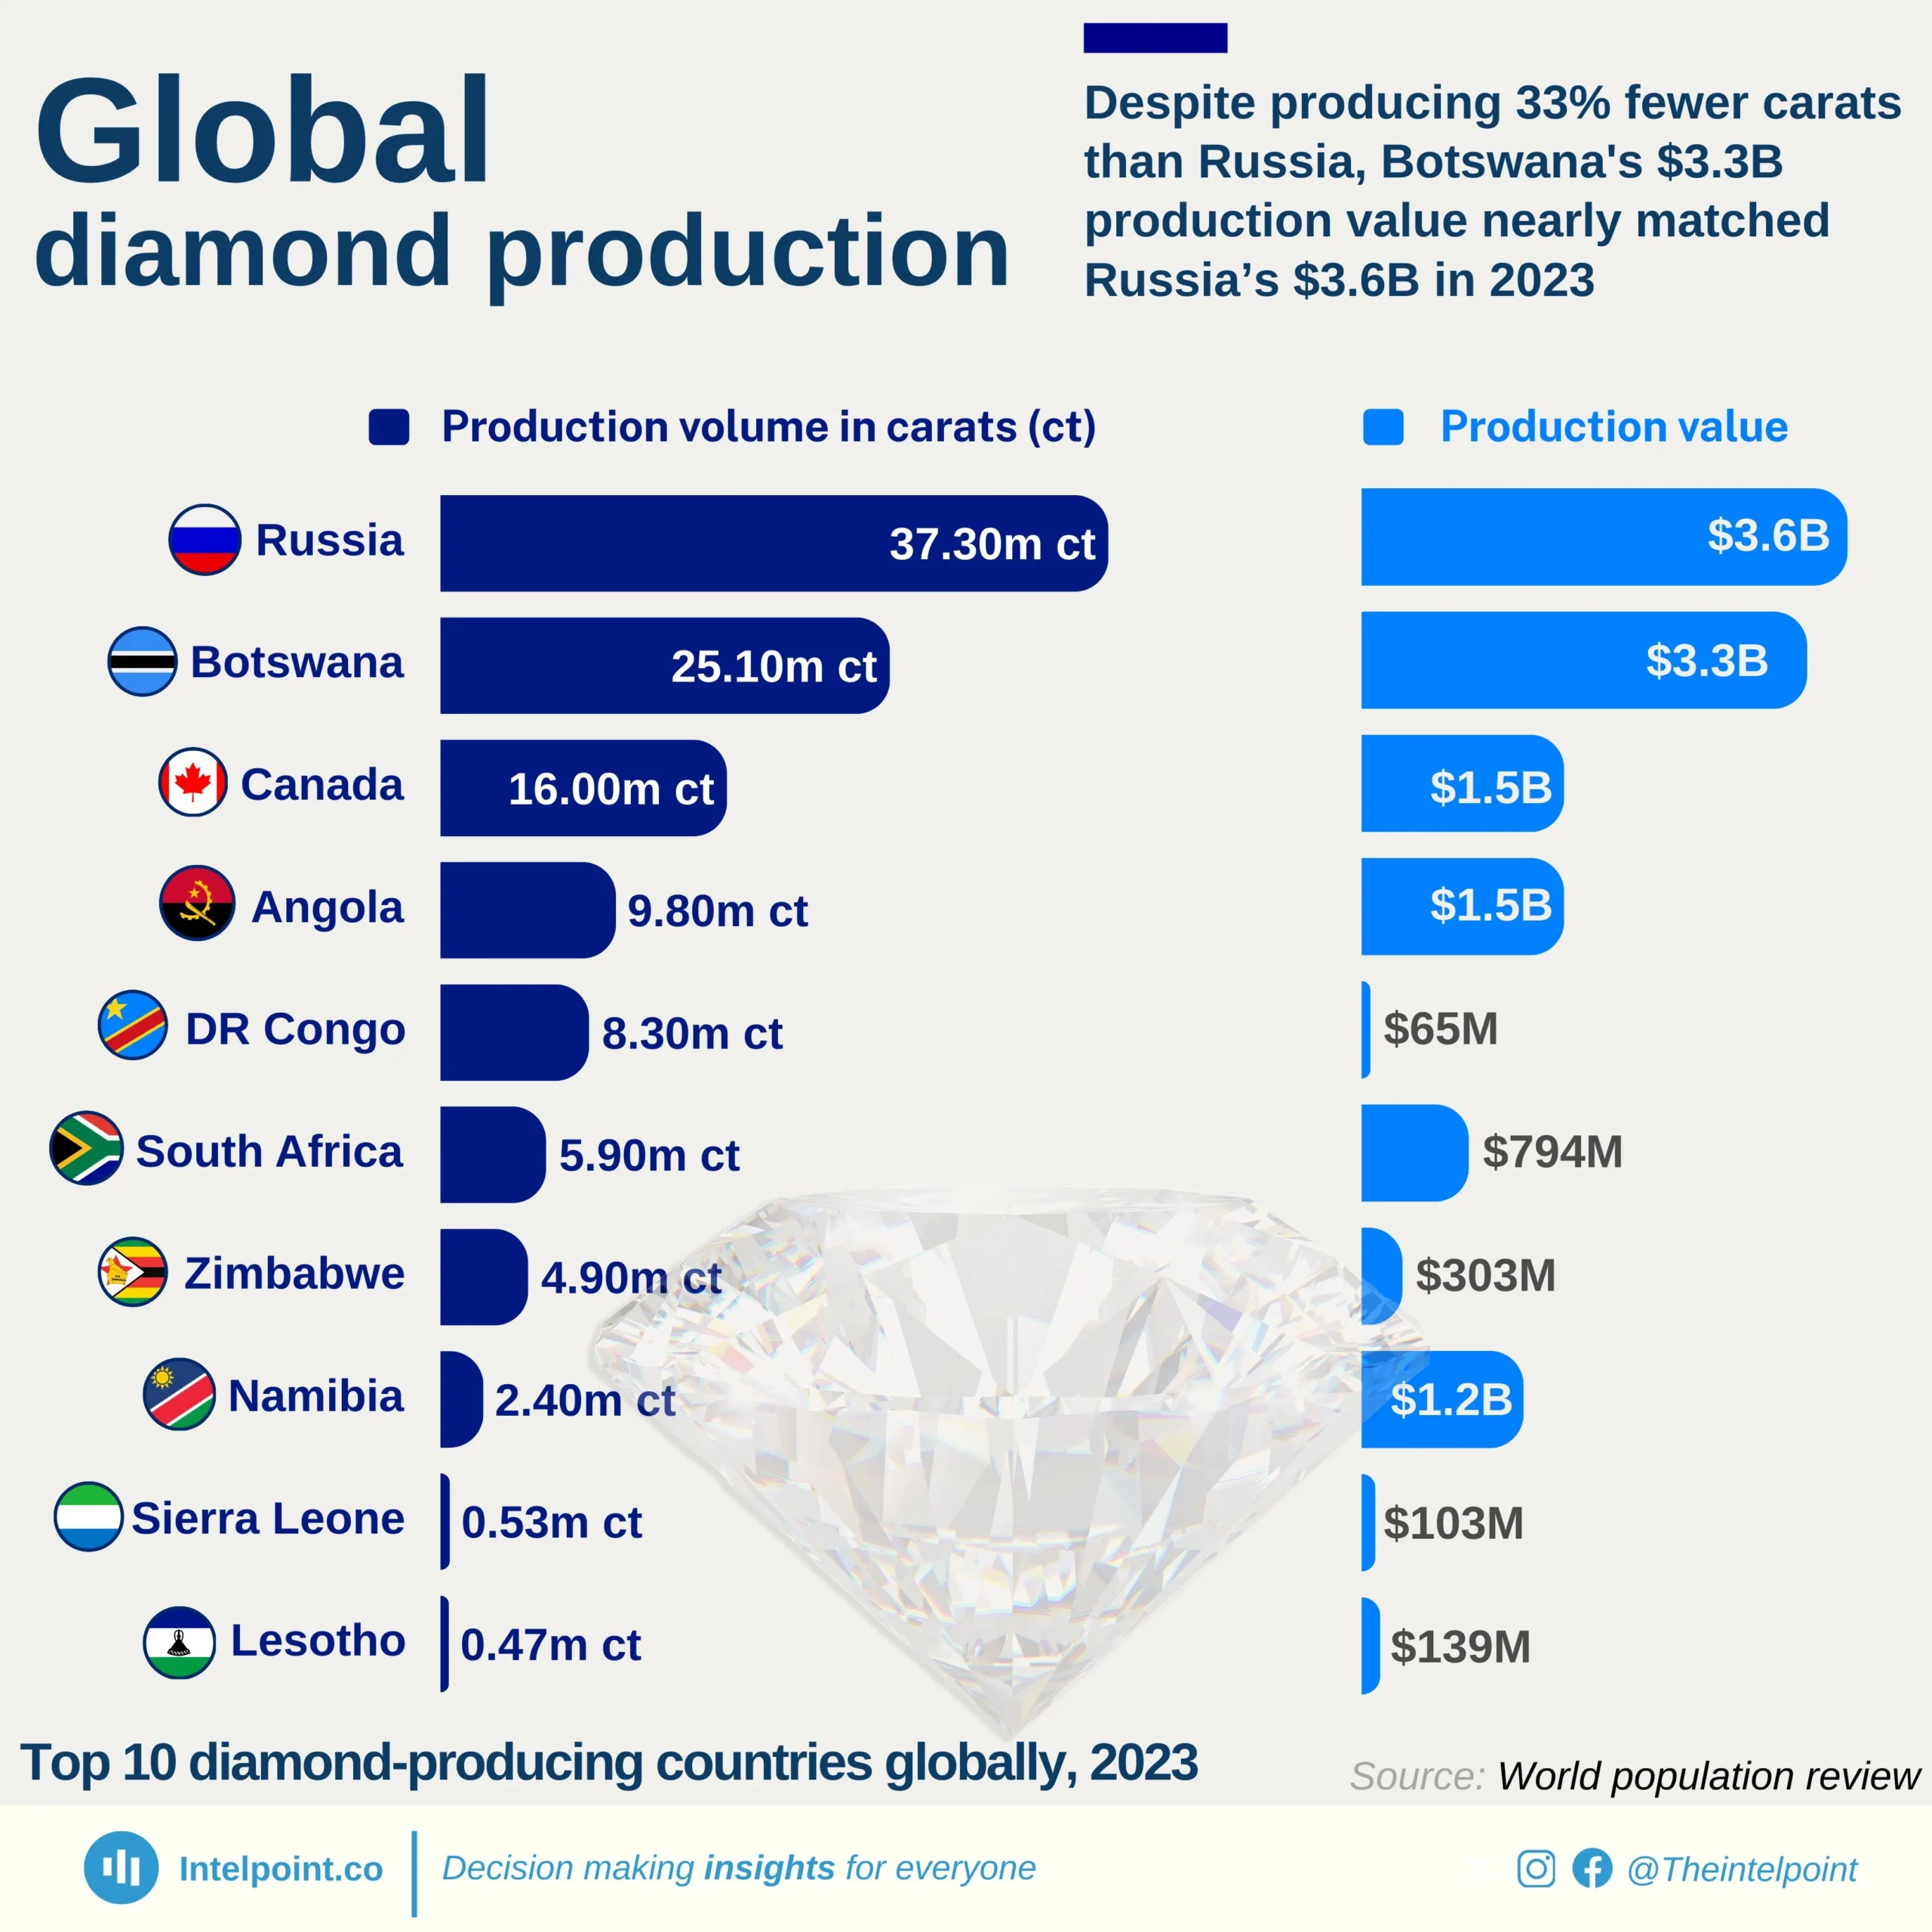
Russia is the volume leader with 37.3M carats, nearly 1.5× Botswana’s 25.1M carats.
Botswana punches above its weight: though producing 33% fewer carats than Russia, its output value almost matches Russia's due to higher value per carat price.
Eight of the top 10 producers are African (Botswana, Angola, DR Congo, South Africa, Zimbabwe, Namibia, Sierra Leone, Lesotho).
Low-volume producers like Namibia (2.4M ct → $1.2B) highlight how smaller deposits can yield high-value diamonds.
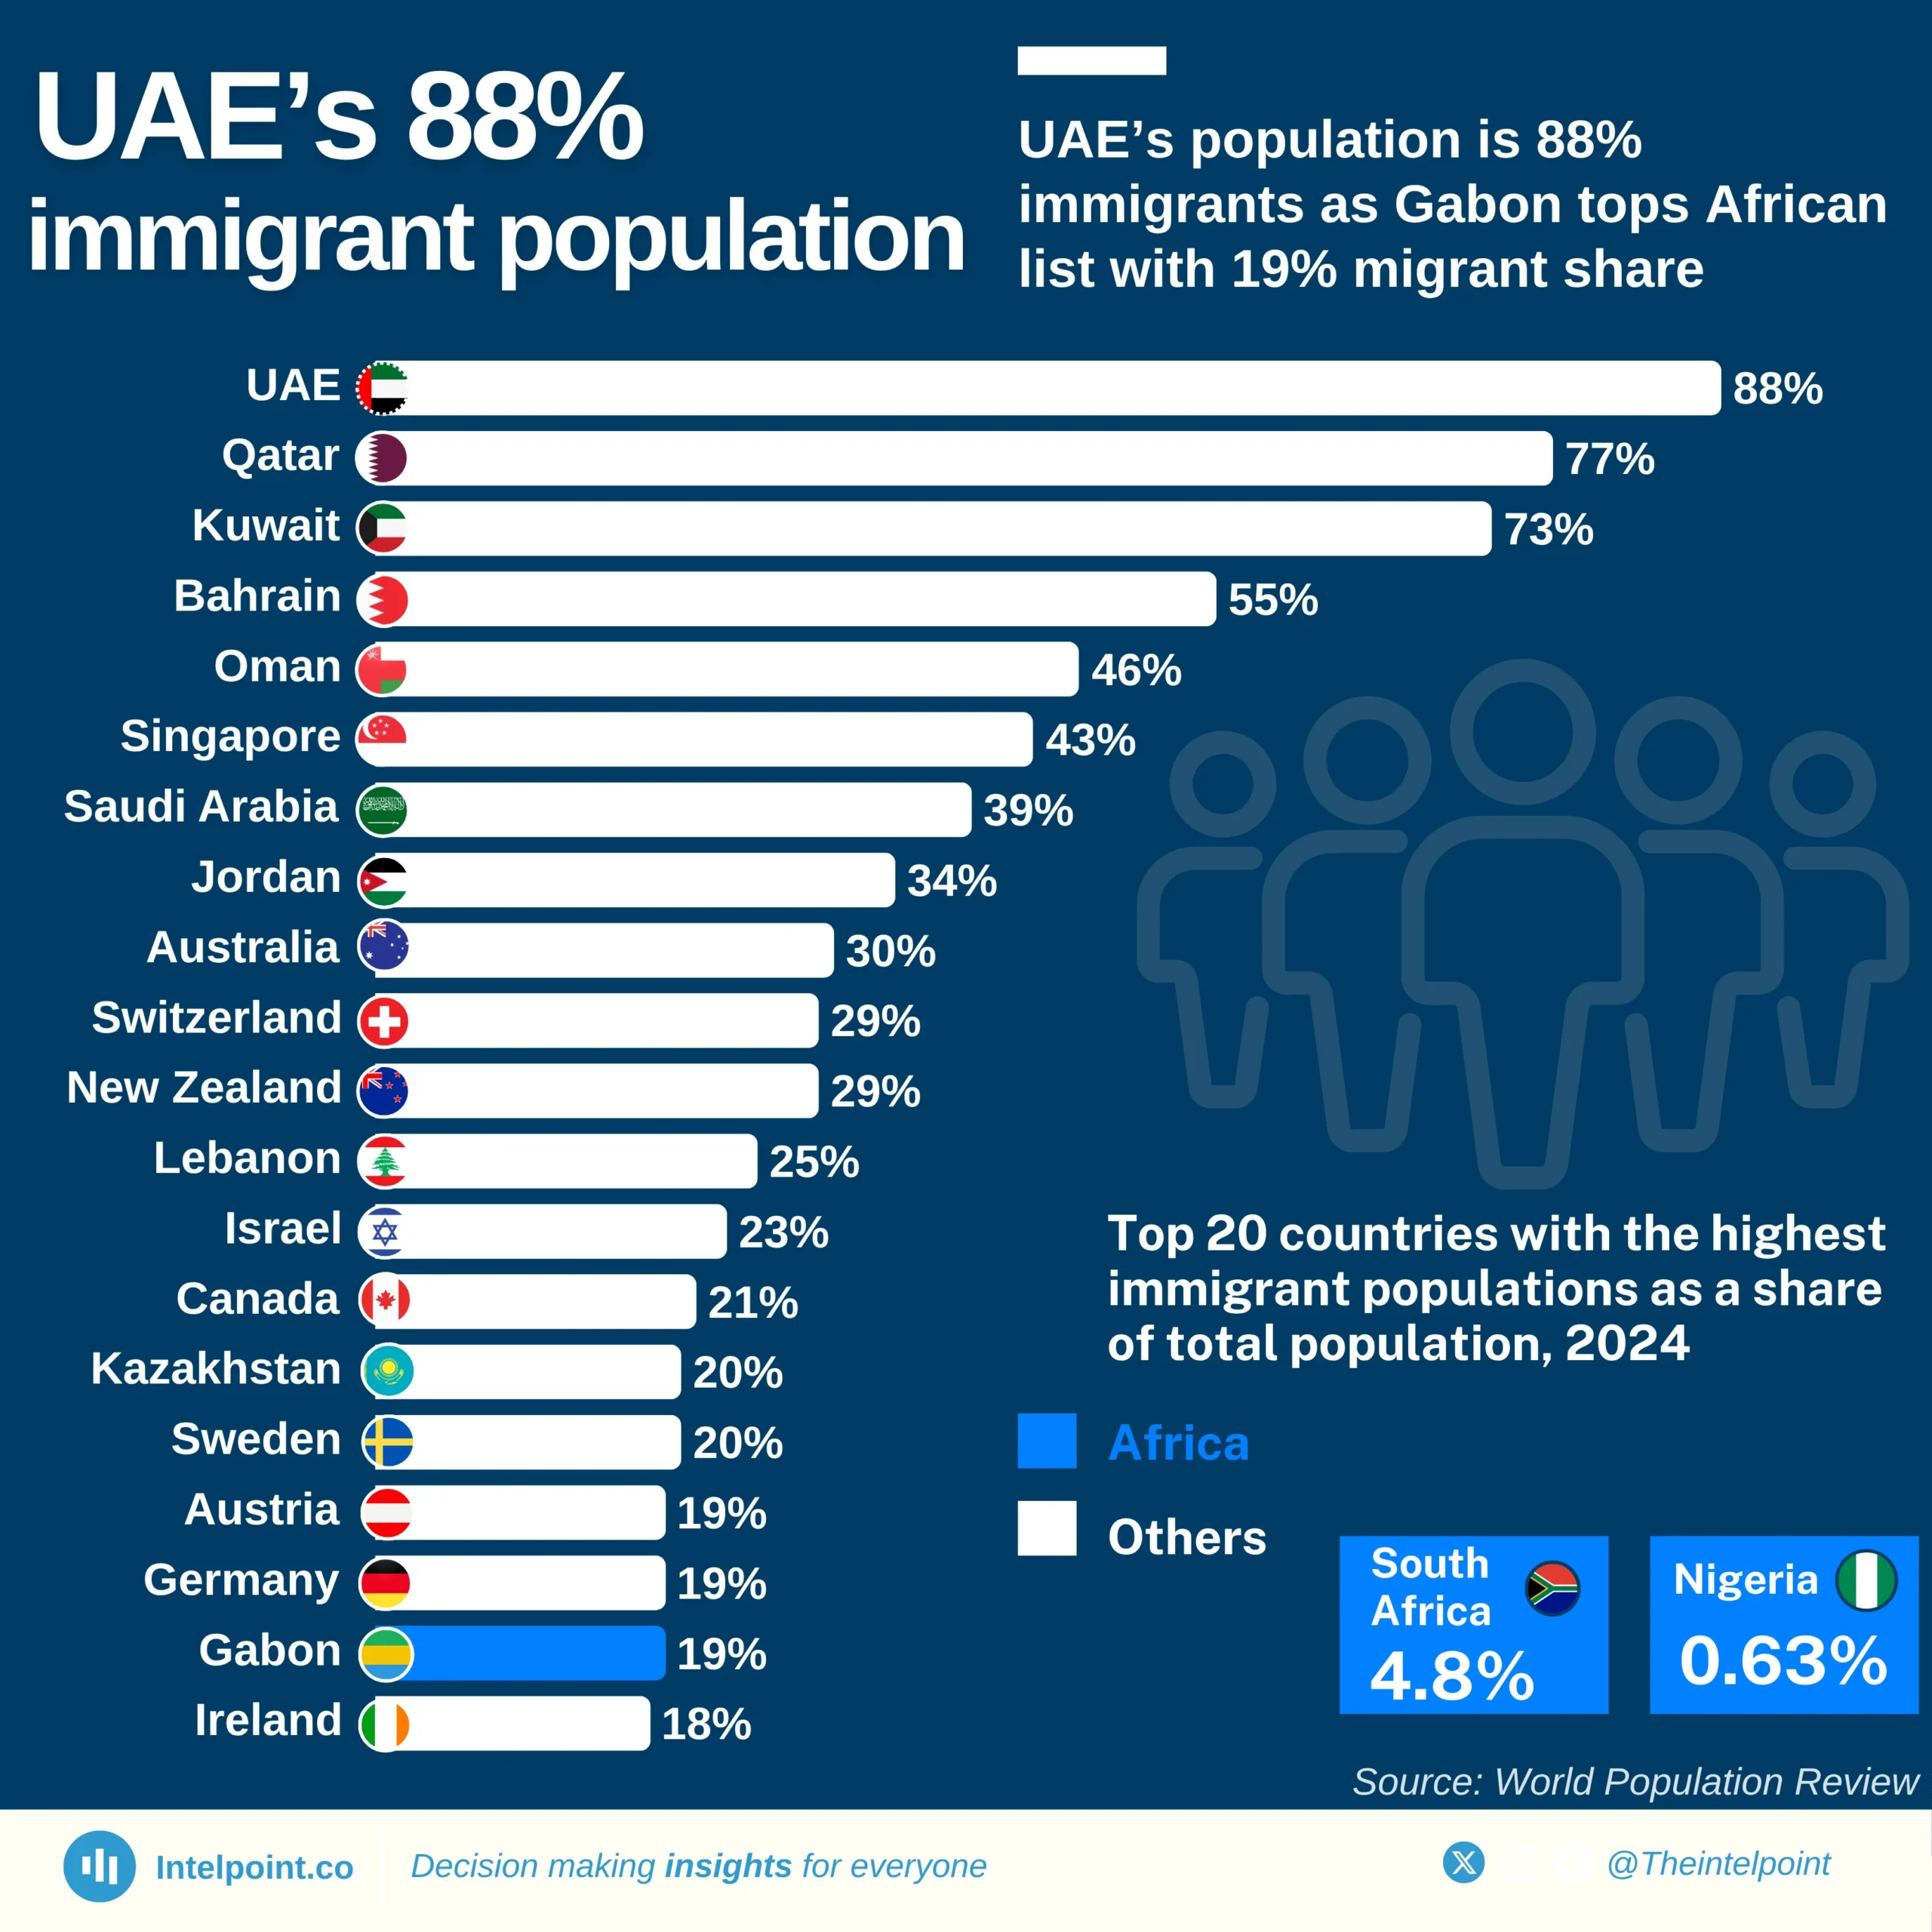
The United Arab Emirates tops the list with immigrants making up 88% of its total population.
Qatar follows closely with 87% of its residents being immigrants.
Kuwait (73%) and Bahrain (55%) also feature prominently, showing a regional trend where nationals are a minority and foreign workers form the economic backbone
Middle Eastern dominance in the top rankings highlights how the Gulf region’s economic model is heavily dependent on imported labor and expatriate populations.
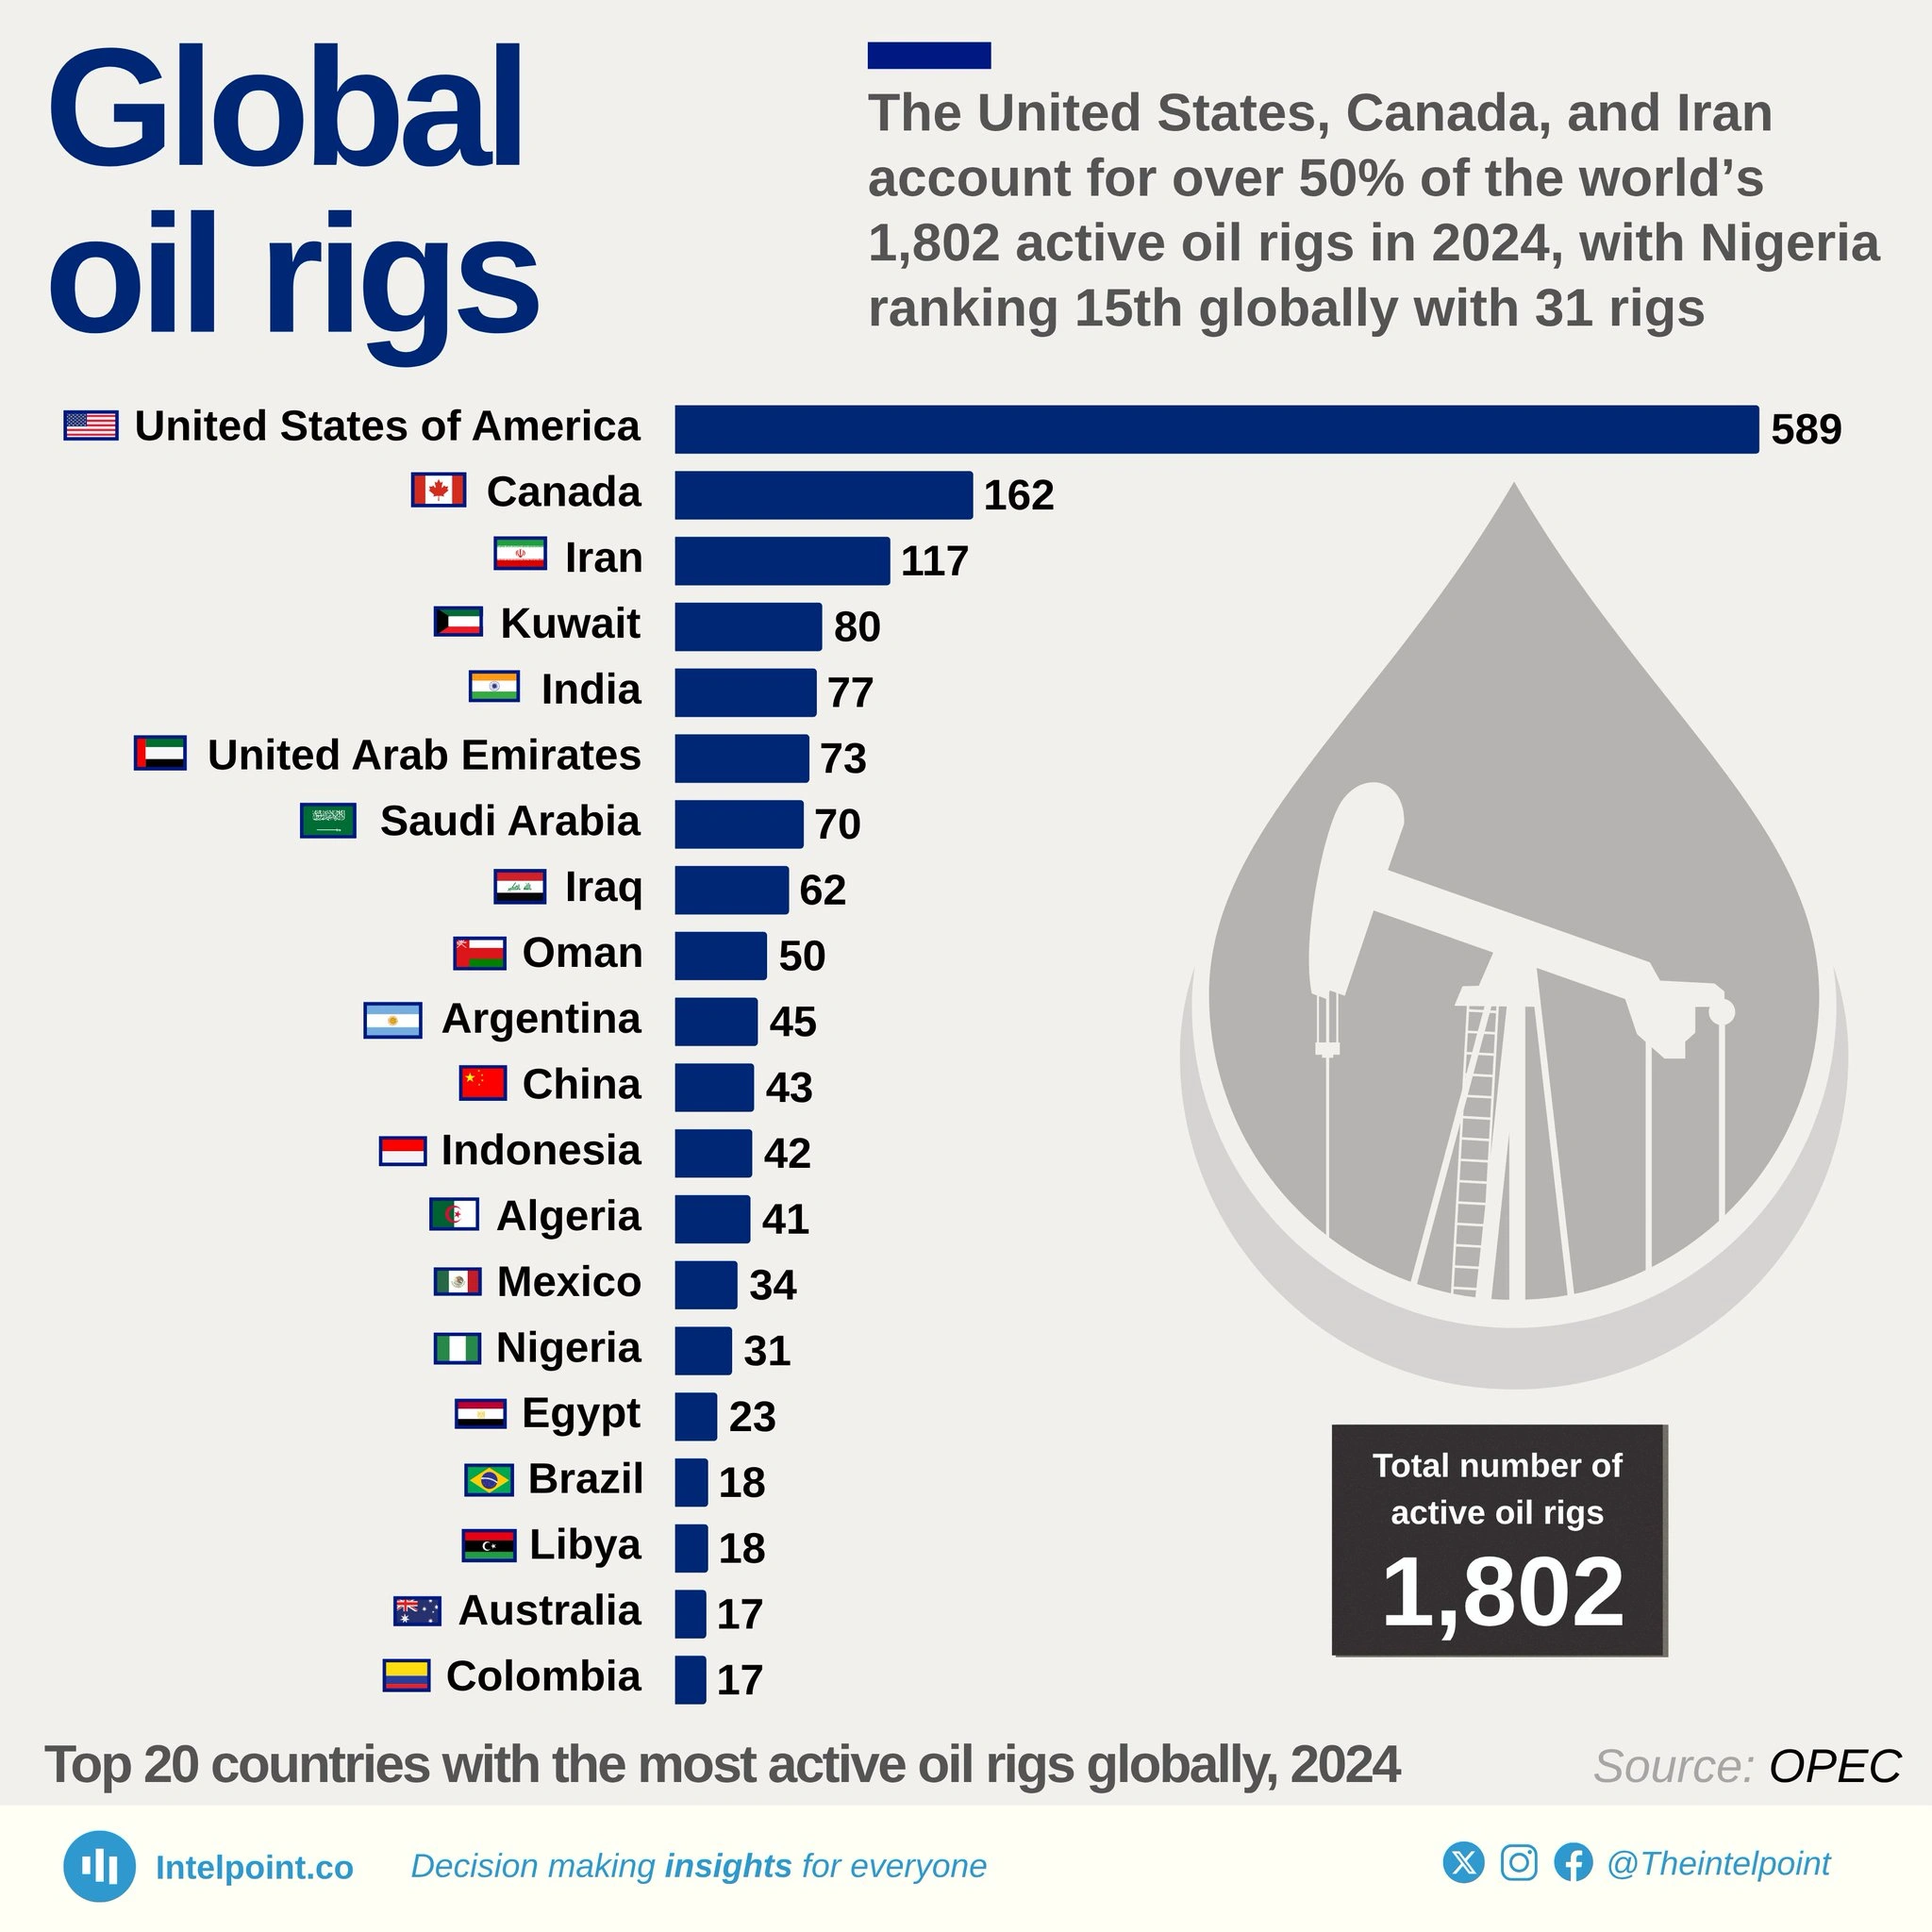
The United States remains the undisputed leader with 589 active rigs, accounting for nearly a third of all rigs worldwide in 2024.
Canada (162 rigs) and Iran (117 rigs) follow as the second and third highest contributors to global drilling activity.
Middle Eastern producers dominate the top 10, with Kuwait (80), UAE (73), Saudi Arabia (70), Iraq (62), and Oman (50) collectively operating 335 rigs.
Nigeria ranks 15th globally with 31 active rigs, making it one of only two African nations in the global top 20.
The top 10 countries account for over 75% of the world’s active rigs, reflecting the continued concentration of drilling infrastructure in a handful of key oil-producing regions.
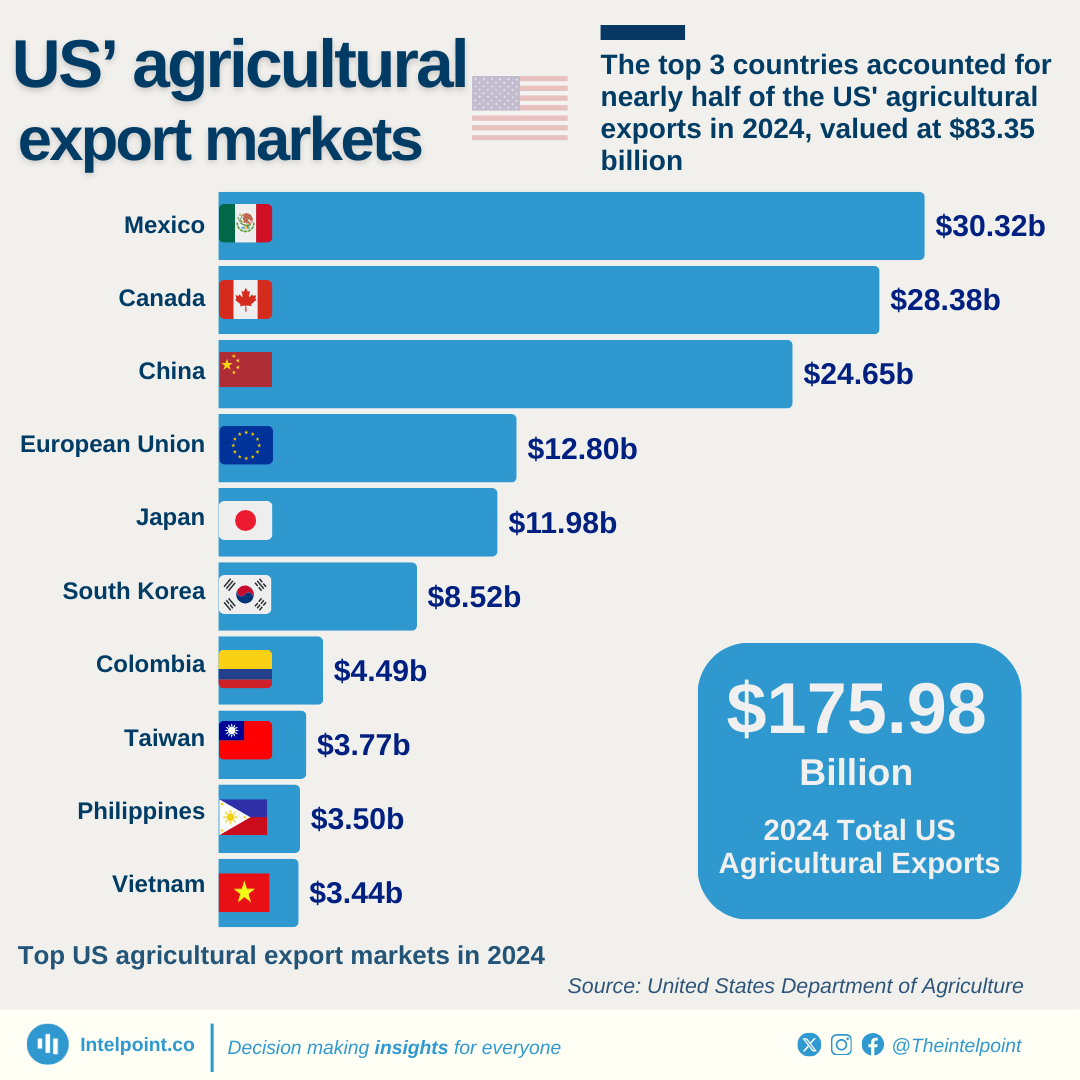
Mexico ranked as the leading destination for the US' agricultural exports in 2024, with a total value of $30.32 billion (17.2% of total agricultural exports).
North American neighbours, Mexico and Canada, collectively accounted for 33.3% of total US agricultural exports.
China was the third-largest market, importing $24.65 billion (14%) of the US' agricultural products.
Asian markets, including China, Japan, South Korea, Taiwan, the Philippines, and Vietnam, collectively absorbed 31.7% of the US' agricultural exports.
The top three markets (Mexico, Canada, and China) made up 47.3% of the US' total agricultural export value.
The top 10 markets accounted for 74.8% of the US' agricultural exports, totalling $131.85 billion.