Cards were the most involved in fraud, with ₦14.3 billion representing the most significant exposure among all transaction channels
Card transactions also had the highest number of cases (11,972), indicating widespread and frequent attacks
Actual losses on cards were 11.5% (₦1.6 billion) of the amount involved, showing that significant financial damage still occurs despite preventive systems
Cash fraud accounted for ₦6.8 bn in exposure, nearly half of the card channel’s total
Cash also recorded 12.3% (₦800 million) in actual losses
Cheques had the lowest fraud involvement (₦1.2 billion) and only 46 cases, but the highest actual loss rate (72.7%)
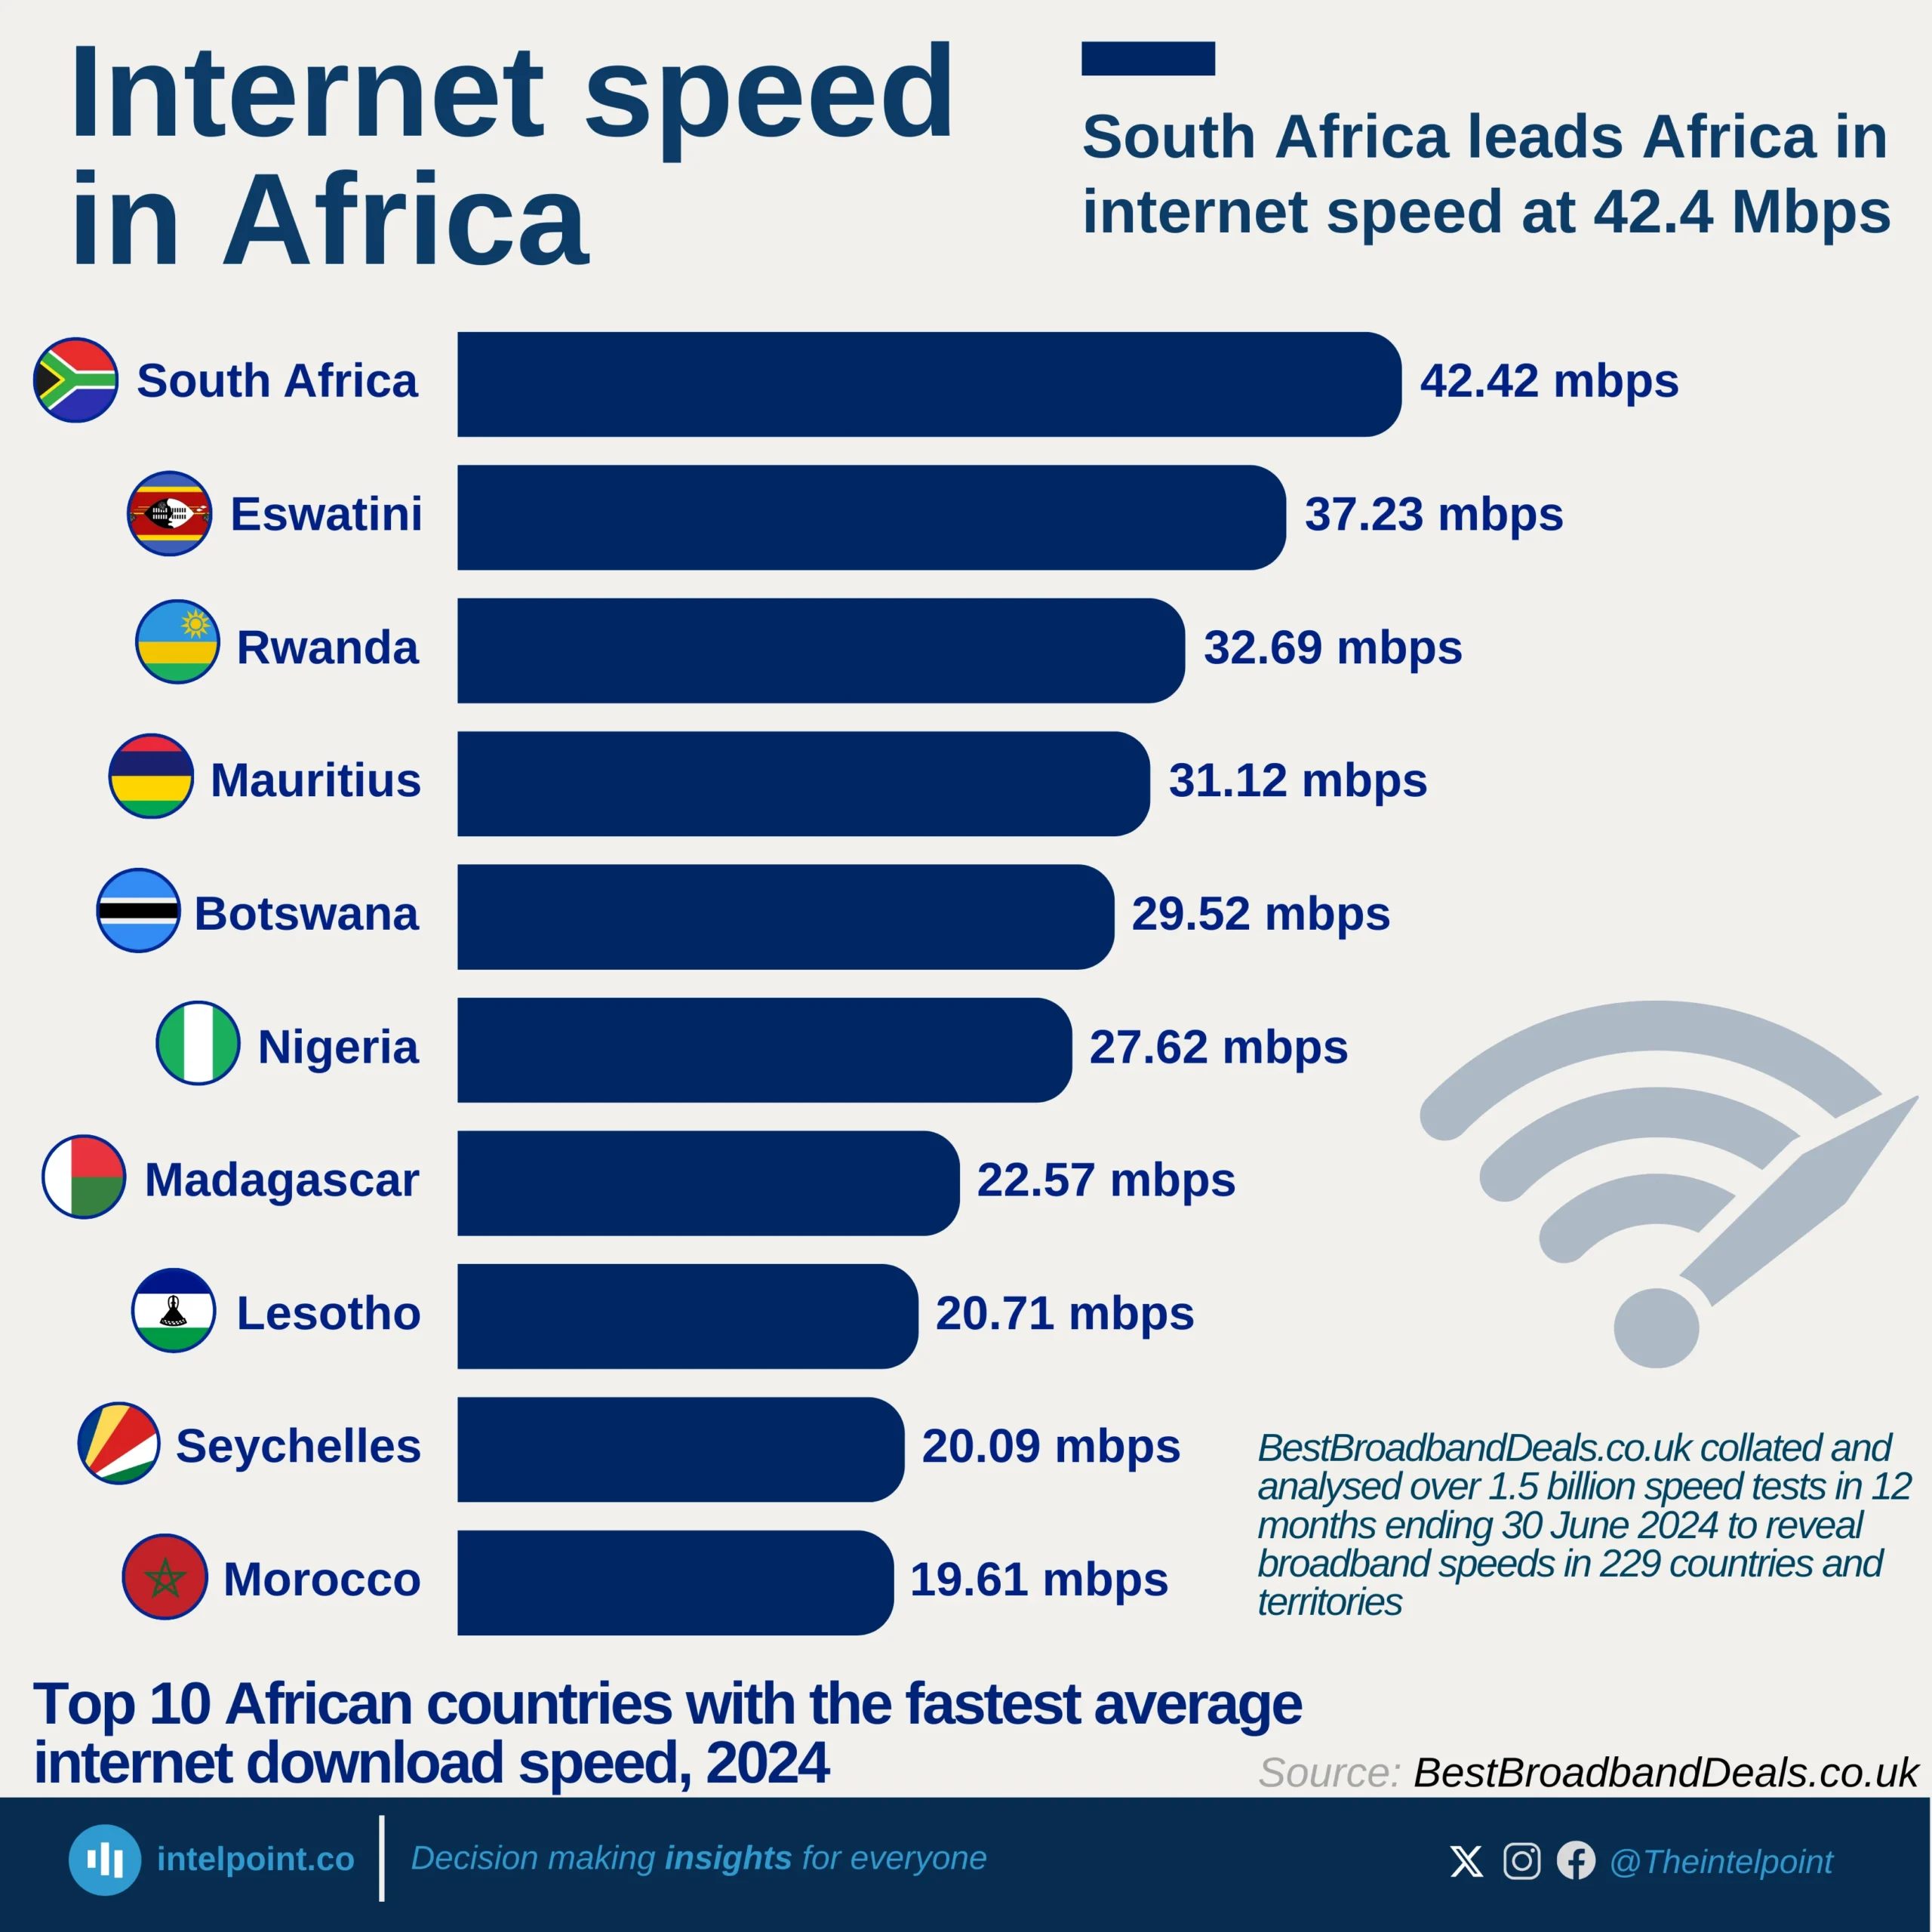
South Africa sets the benchmark with the fastest average download speed (42.42 Mbps), more than double Morocco’s (19.61 Mbps).
Southern African countries dominate the top half of the ranking, with South Africa, Eswatini, Botswana, Lesotho, and Madagascar all featuring strongly.
Rwanda and Mauritius show East Africa’s progress, with average speeds above 30 Mbps, signalling solid digital infrastructure growth.
Wide disparities persist, with the gap between the highest (South Africa) and lowest (Morocco) averaging over 22 Mbps.