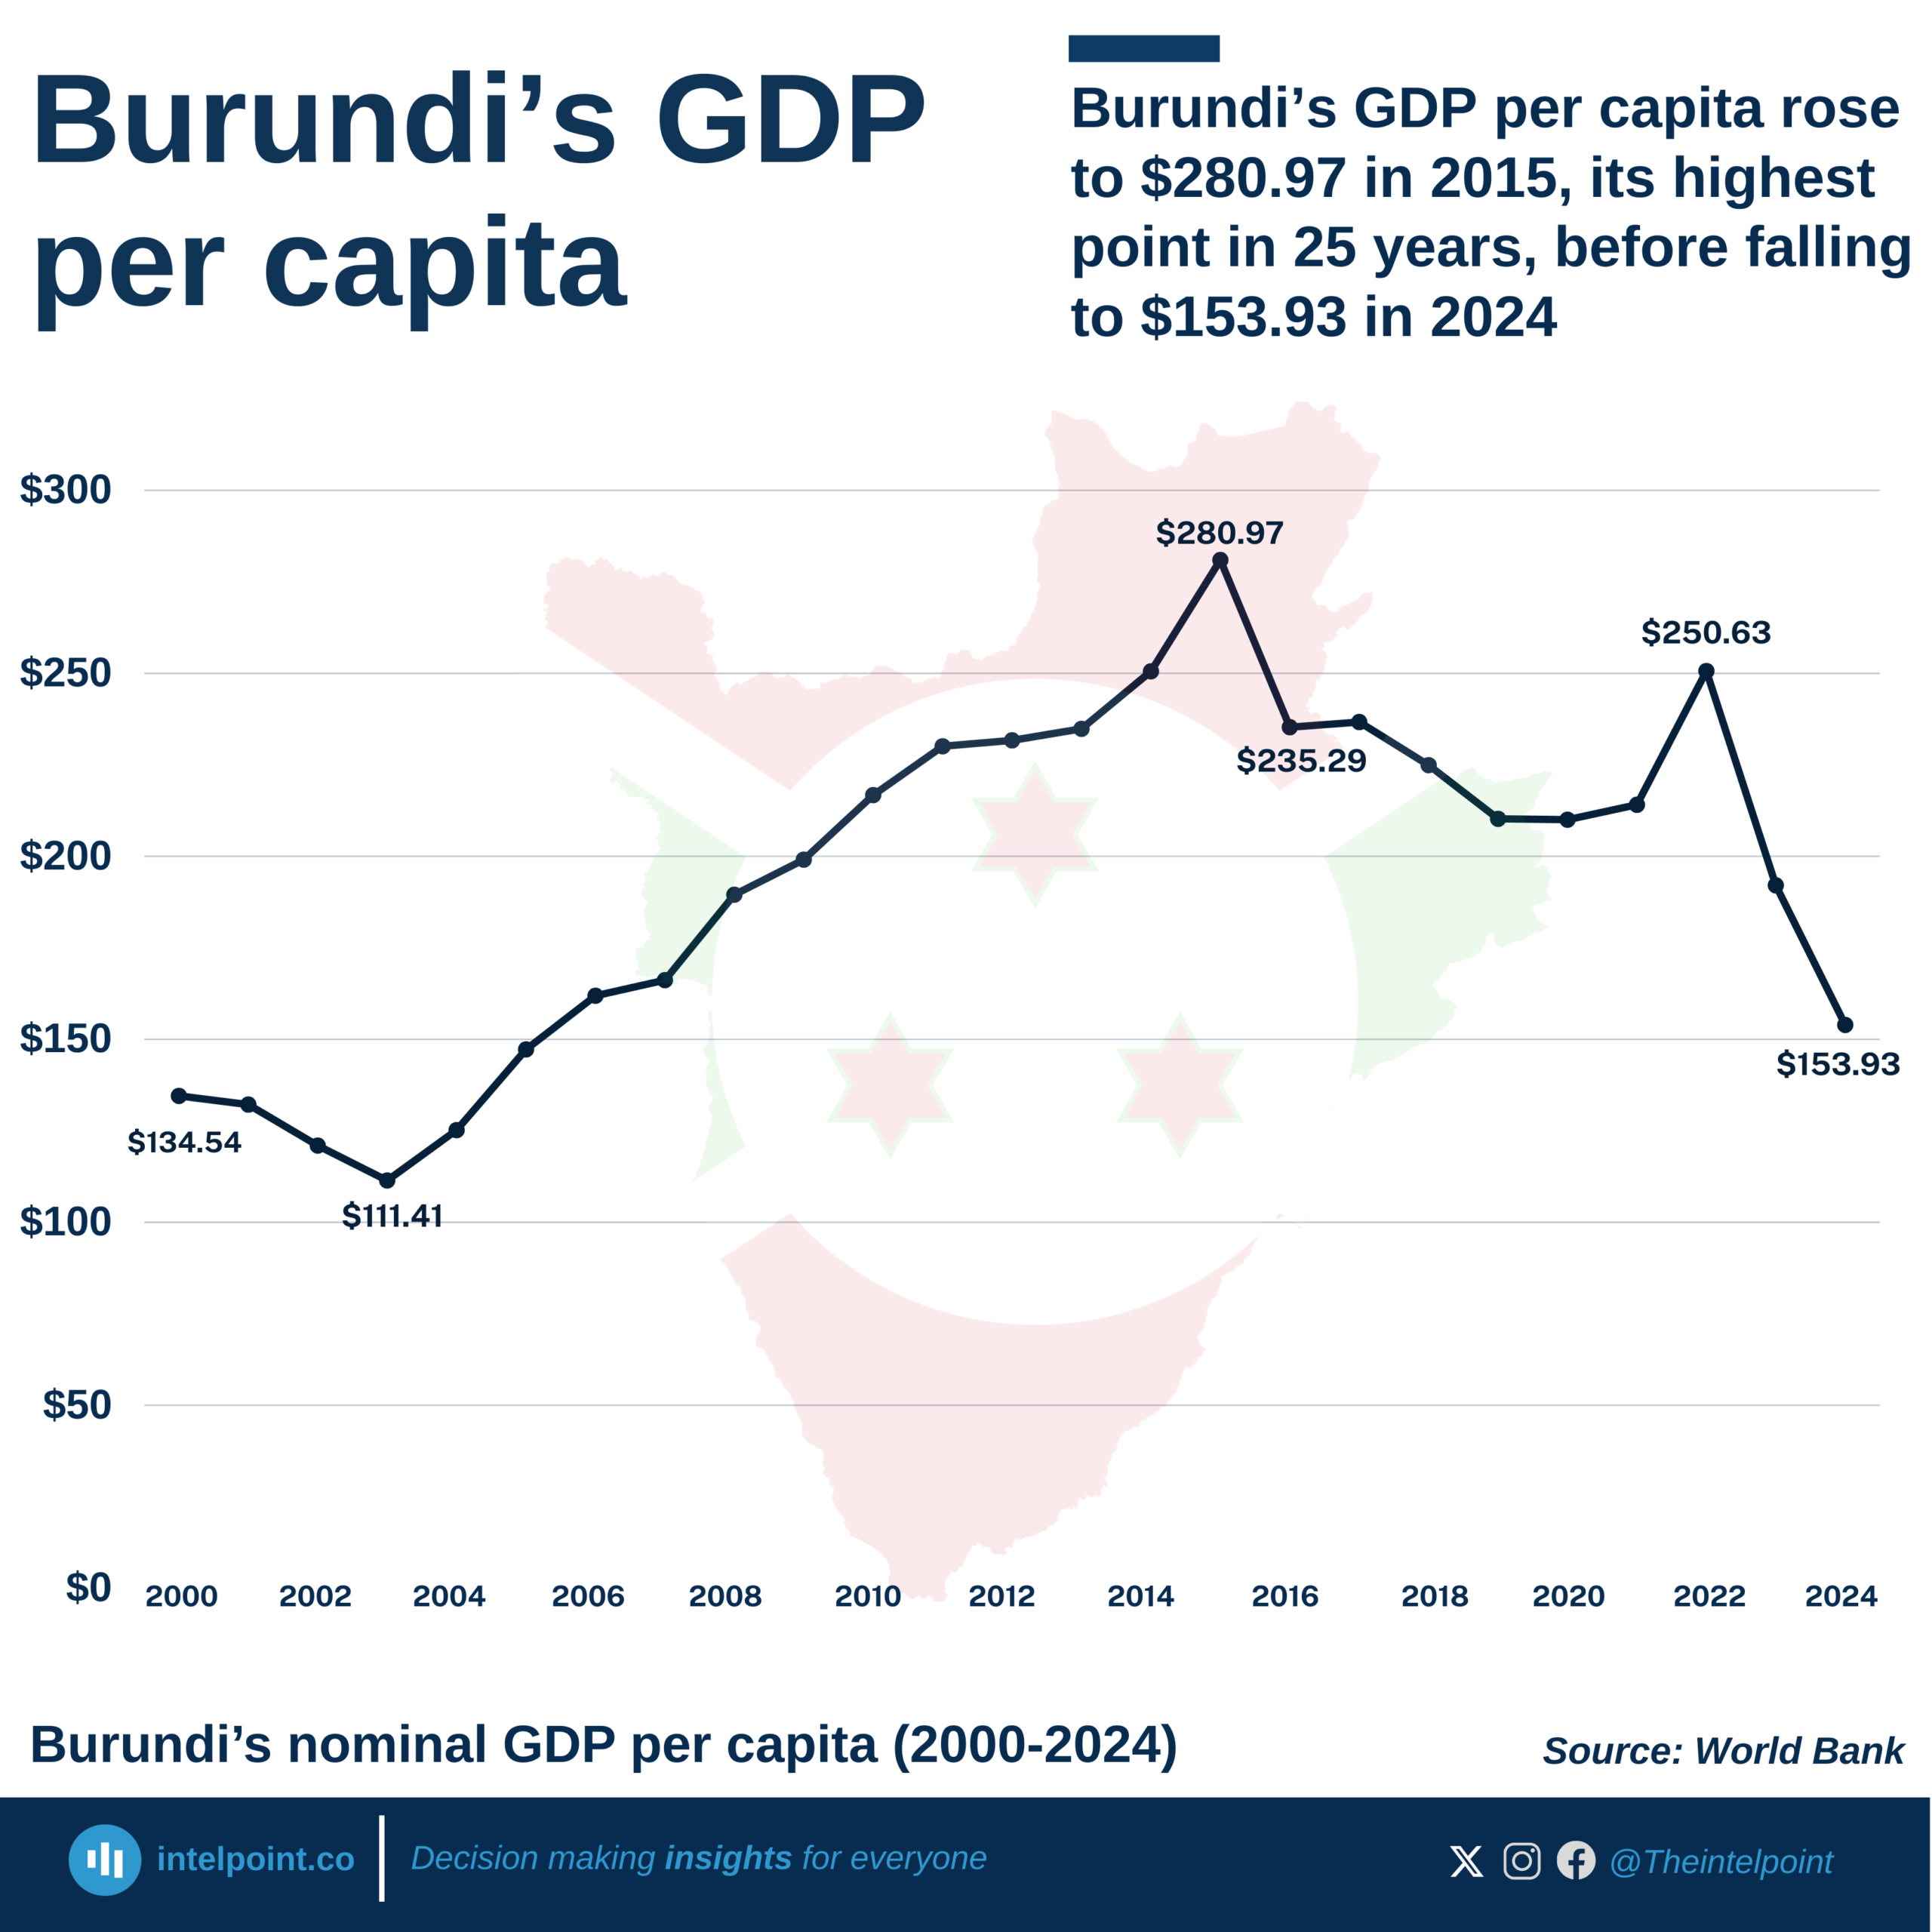
Bite-sized Insights about
 
Providing you with data-based insights about things happening around you.
Zimbabwe’s GDP per capita recorded a 472% increase over the 25-year period from 2000 to 2024
  • Zimbabwe’s GDP per capita nearly quintupled since 2000, marking a 472% increase over 25 years.
  • The country's GDP per capita declined consistently from 2001 to 2008.
  • It soared to $3,448.1 in 2017, which is still the highest in the country's history.
  • The GDP per capita plummeted to $2,271.9 in 2019, recording a (34.1%) decrease.

Seychelles’ GDP per capita peaked at $19.14k in 2019, more than doubling from $8.06k in 2000
  • Seychelles’ GDP per capita rose from $8.06k in 2000 to a peak of $19.14k in 2019, more than doubling in two decades.
  • After steady growth through the 2010s, the COVID-19 pandemic in 2020 cut GDP per capita to $14.04k, a 26% drop from 2019.
  • Recovery has been gradual, with GDP per capita rebounding to $18.26k in 2023, though still below the 2019 high.
  • By 2024, GDP per capita settled at $17.86k, showing resilience but reflecting ongoing global and domestic economic pressures.

Kenya’s GDP per capita has risen in 20 of the past 25 years, growing from ~$415 in 2000 to $2,206 in 2024
  • Kenya's GDP per capita soared from $414.6 in 2000 to a significant $2206.1 in 2024, marking a 532% increase.
  • The country saw its largest single-year jump between 2006 and 2007, rising by 33.7% from $523.5 to $699.8.
  • Economic downturns were visible in 2020 (-1.7%) and 2023 (-7.5%), showing vulnerability to shocks.
  • Since 2020, GDP per capita has grown by 14.5%, with 2024 recording the highest value.
  • Kenya’s GDP per capita rose in 20 of the past 24 years, and declines occurred in only 4 years (2001, 2002, 2020, and 2023).

While Angola's debt service-to-GDP hits 68%, Algeria’s is 0.1%, showing huge variety in debt burdens
  • Angola and Ethiopia account for the highest debt service-to-GDP ratios in Africa, both exceeding 67%.
  • East Africa dominates the high debt-servicing bracket, with five countries among the top ten most burdened.
  • Algeria has the lowest debt service-to-GDP ratio on the continent at just 0.10%.
  • There’s a wide gap between the top and bottom debt service burdens, reflecting divergent fiscal paths across Africa.
  • Low debt servicing doesn’t automatically mean economic strength—it may reflect limited borrowing capacity.

While many other African nations face a high debt burden, Algeria's already low debt keeps falling to a projected 0.09% in 2025
  • Algeria’s debt service per GDP dropped from 0.77% in 2009 to a projected 0.09% in 2025.
  • The country’s debt service per GDP declined at a -11.9% CAGR from 2009–2025.
  • A high of 0.73% occurred in 2012 before the consistent decline resumed.
  • By 2015, the country's debt service fell to 0.27%, showing progress in reduction.
  • The lowest point is forecast for 2025, at 0.09% of GDP.
  • Algeria’s debt burden is among the lowest in Africa, contrasting with the rising trend in many other nations.
  • This low debt service level allows for greater fiscal flexibility in public spending and investment.

Nigeria's debt service per GDP increased from 0.7% in 2015 to 10.2% in 2024, with 2025 forecasted to reach 15.1%
  • Nigeria's debt service per GDP rose from 0.9% in 2009 to a projected 15.1% in 2025.
  • Overall CAGR from 2009 to 2025 is 17.8%.
  • President Muhammadu Buhari’s tenure saw the fastest growth (29.1% CAGR).
  • Under President Goodluck Jonathan, growth was slower (6.5% CAGR).
  • President Bola Ahmed Tinubu’s term so far shows a 27.6% CAGR.

Angola's debt burden reached a new peak in 2024, with its debt service hitting 68.3% of GDP
  • Debt service in Angola hit 68.3% of GDP in 2024.
  • Even with a projected fall to 67.7% in 2025, the debt burden remains high.
  • Between 2009 and 2025, the debt service ratio grew at a CAGR of 11.2%.
  • The ratio stayed below 15% from 2009 to 2014 before surging to 41.9% in 2016.
  • Angola has faced multiple spikes above 50% since 2019, showing recurring debt strain.
  • The sharp drop to 31.2% in 2022 was short-lived, followed by a steep increase.

Guinea-Bissau had the highest agricultural contribution to its GDP among African countries in 2024, at 36.8%
  • Guinea-Bissau showed the highest agricultural contribution to its GDP at 36.8% in 2024.
  • Contributions range widely, with high reliance seen in Comoros (36.6%) and Ethiopia (34.9%), contrasting with lower percentages in DR Congo (17.1%) and Angola (16.4%).
  • Agriculture, forestry, and fishing contributed a notable 20.4% to Nigeria's GDP in 2024.
  • Countries with high agricultural GDP contributions are predominantly located in West and East Africa.

Burkina Faso’s GDP per capita has nearly quadrupled since 2000, marking a 297% increase over 25 years
  • Burkina Faso's GDP per capita rose from $248.9 in 2000 to an estimated $987.3 in 2024, marking a nearly 297% increase over 25 years.
  • The country saw its largest single-year jump between 2007 and 2008, rising $104.7 from $514.7 to $619.4.
  • Economic downturns were visible in 2009 (-2.9%), 2015 (-17.6%), and 2022 (-6.6%), showing vulnerability to shocks.
  • Since 2020, GDP per capita has grown 19.6%, with 2024 recording the highest value in the dataset.

1 2 3 4 6

Can’t find what you’re looking for? Please fill the form below
Contact Form Demo
SIGN UP TO OUR NEWSLETTER
Get periodic updates about the African startup space, access to our reports, among others.
Subscribe Here
Subscription Form

A product of Techpoint Africa. All rights reserved