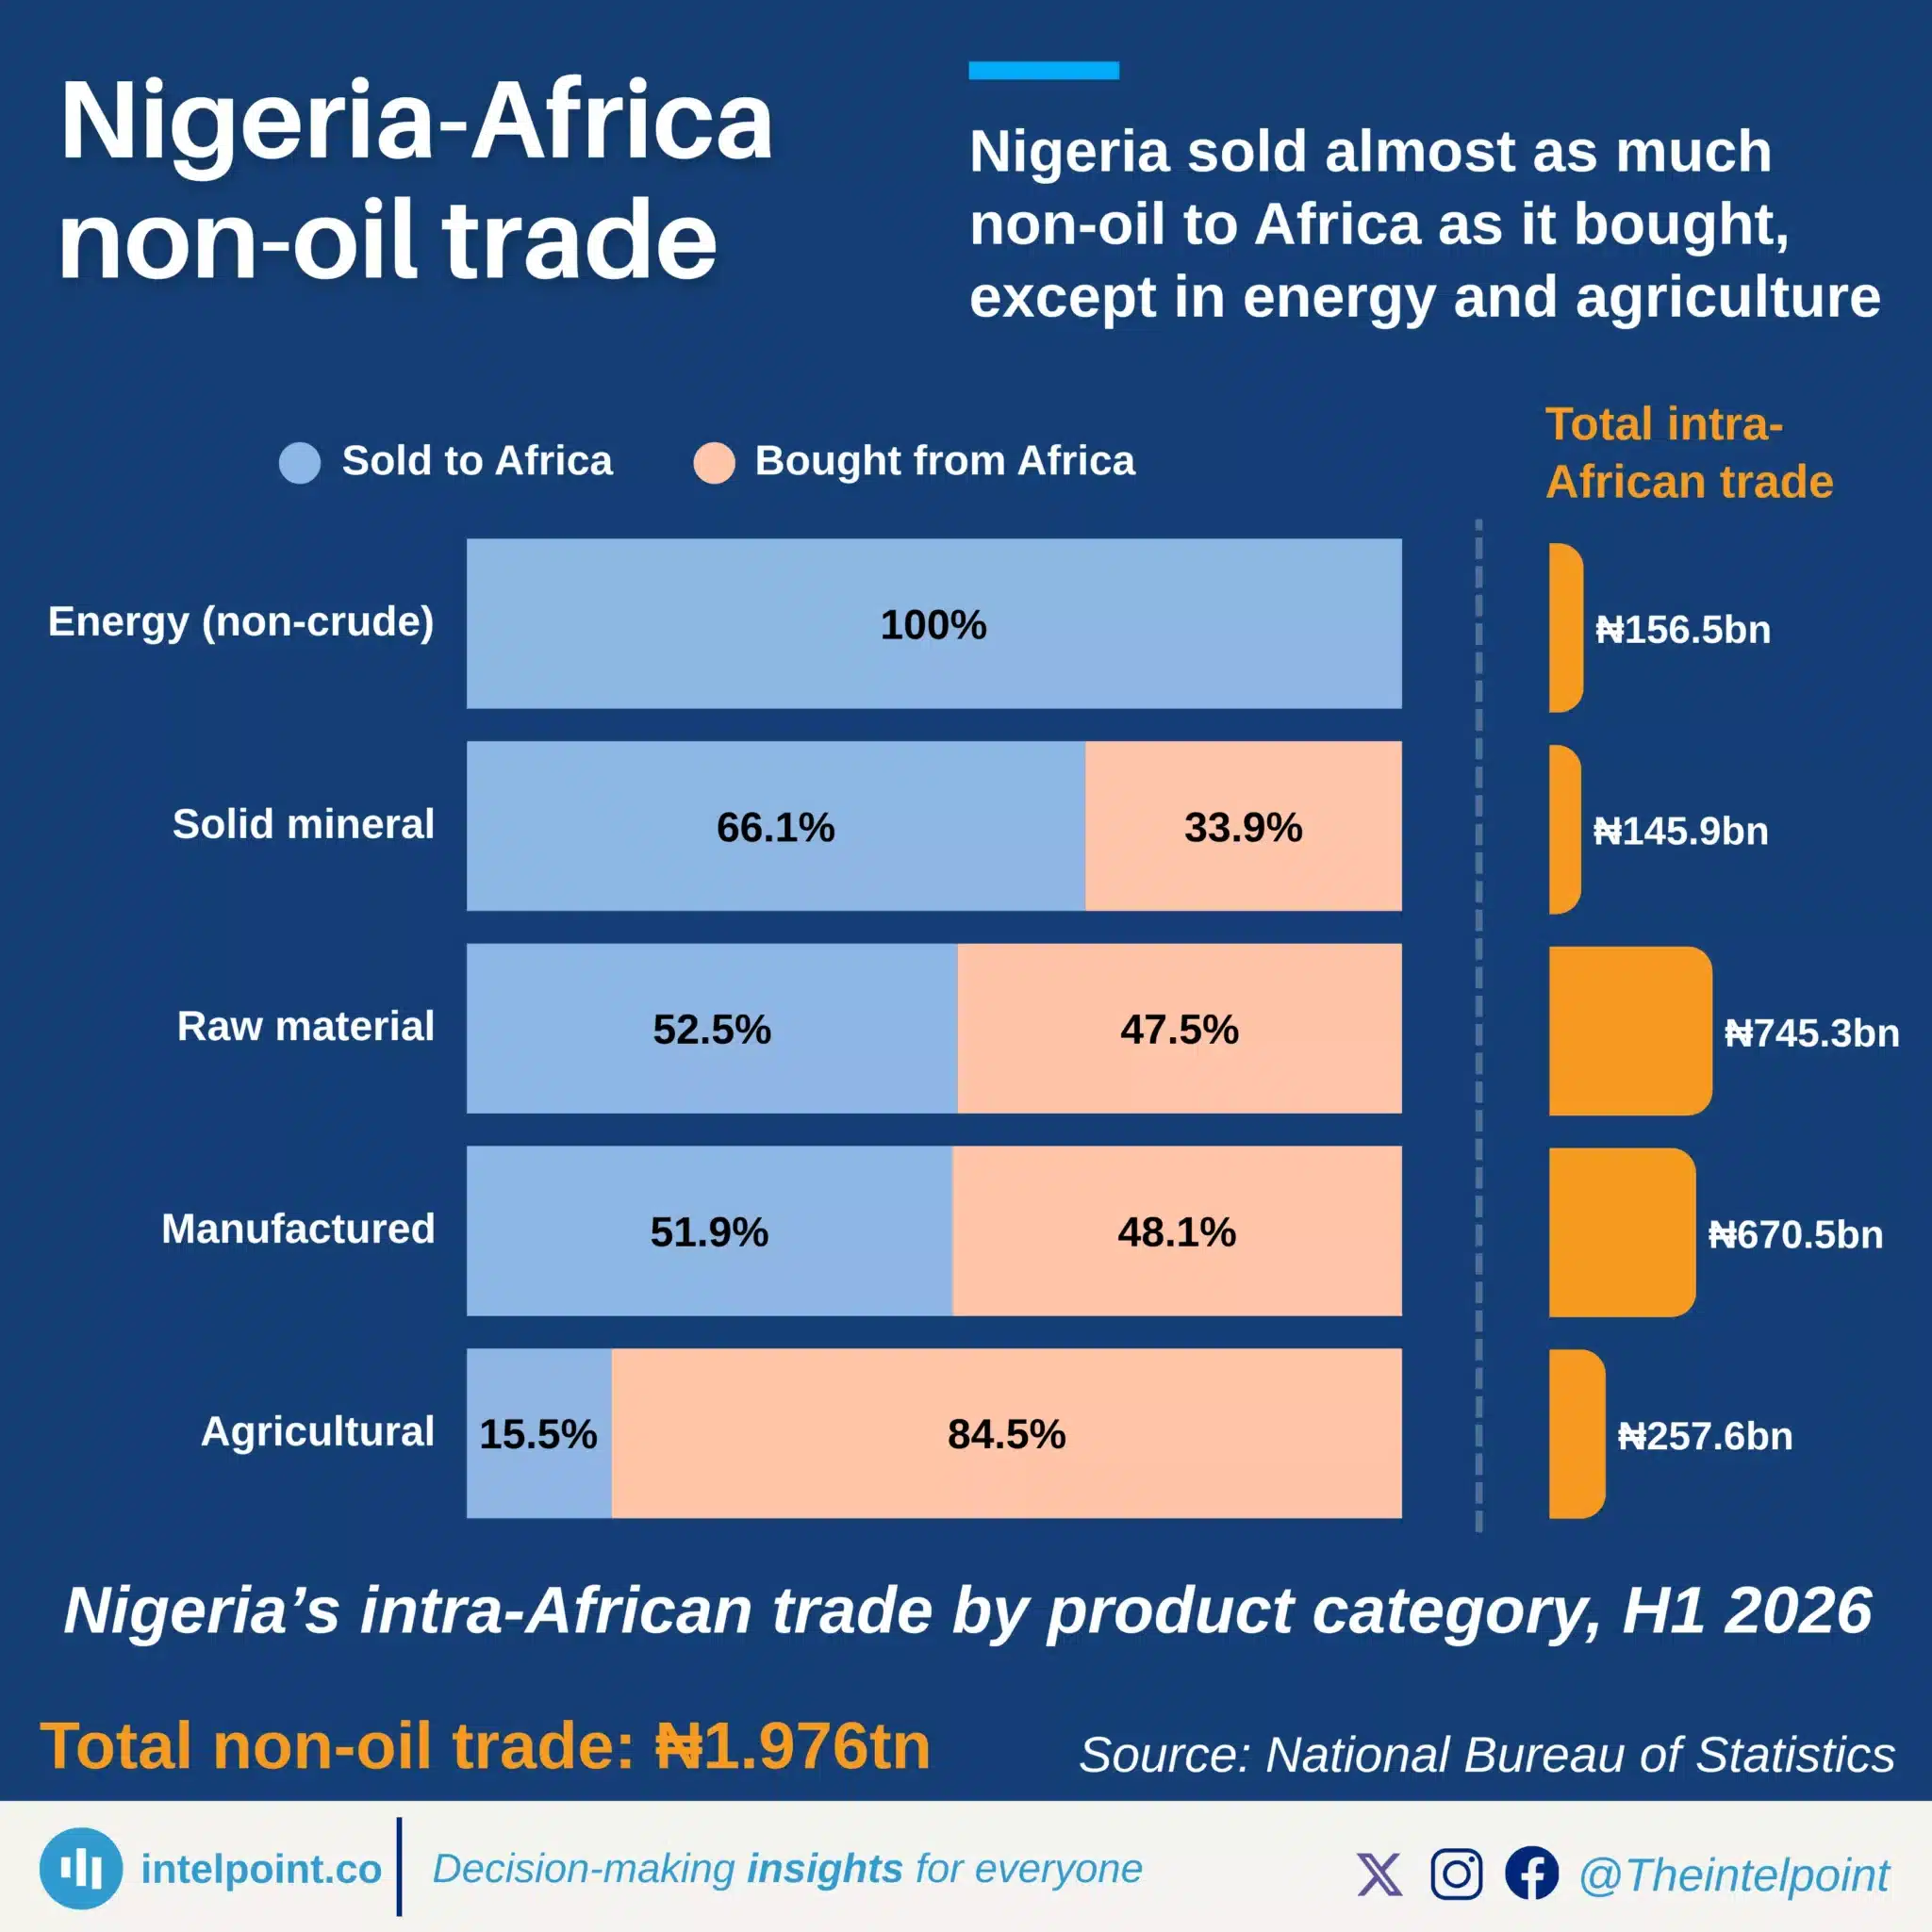
Nigeria sold almost as much non-oil to Africa as it bought, except in energy and agriculture

Key Takeaways

  • Nigeria’s non-oil trade with Africa was nearly balanced, with an ₦88bn surplus on almost ₦2tn of trade in H1 2026.
  • Energy trade was entirely export-led, with Nigeria selling ₦156.5bn and recording no imports.
  • Solid minerals also leaned towards exports, with sales making up 66.1% of category trade.
  • Agriculture ran a large deficit, as imports accounted for 84.5% of trade and exceeded exports by ₦178bn.
  • Nigeria’s agricultural trade deficit widened sharply, from ₦59bn in Q1 to ₦119bn in Q2.

Nigeria's non-oil trade with Africa was close to balanced overall in the first half of 2026. Nigeria sold ₦1.03 trillion worth of non-oil products to the continent and bought ₦944 billion, leaving a surplus of just ₦88 billion on total trade of nearly ₦2 trillion.

But that overall balance varied sharply by product category. Energy trade excluding crude oil ran entirely in one direction, with Nigeria selling ₦156.5 billion to African countries and recording no purchases in the category.

Raw materials and manufactured goods were the closest to evenly balanced, with sales and purchases accounting for nearly equal shares of trade. Solid minerals leaned more towards sales, with Nigeria selling 66.1% of its trade in the category to Africa.

Agriculture moved in the opposite direction. Nigeria bought ₦217.7 billion worth of agricultural products from Africa while selling just ₦39.9 billion, meaning imports accounted for 84.5% of its agricultural trade with the continent. That left Nigeria with an agricultural trade deficit of about ₦178 billion in H1, with the gap widening from ₦59 billion in Q1 to ₦119 billion in Q2.
Source:

National Bureau of Statistics

Period:

H1 2026
HTML code to embed chart
Want a bespoke report?
Reach out
Tags
Related Insights

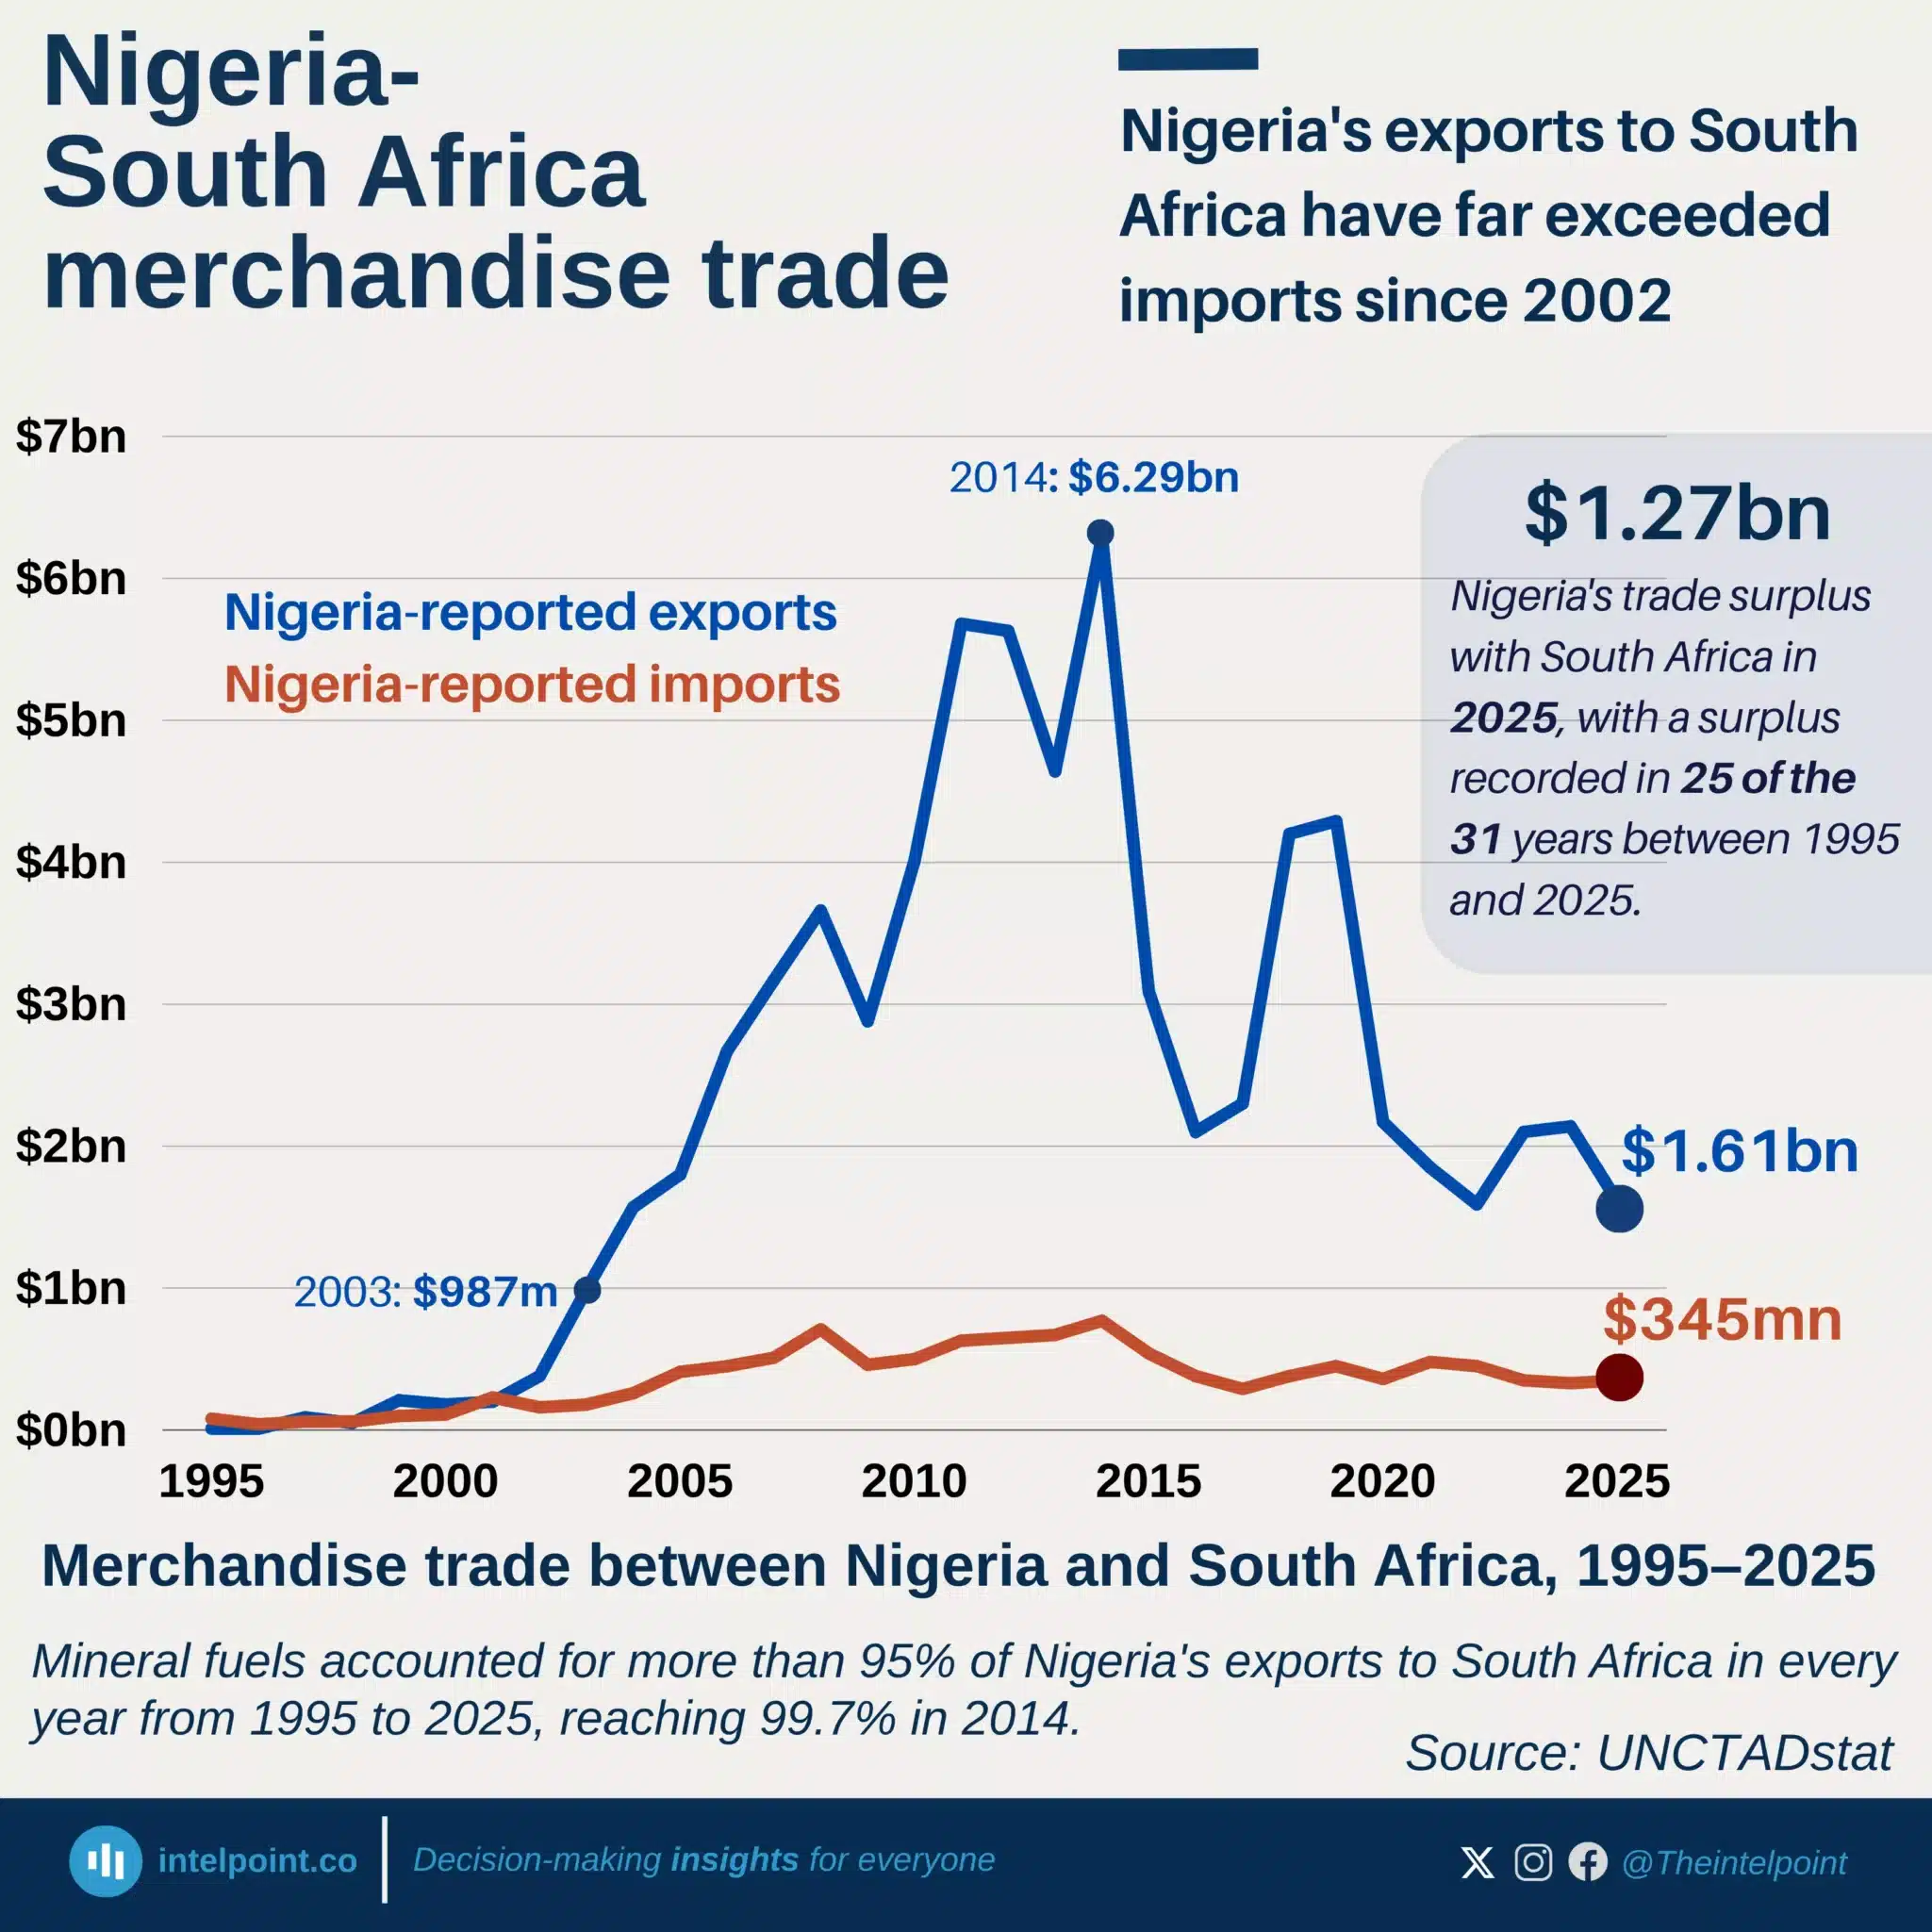
Nigeria's exports to South Africa have far exceeded imports since 2002
  • Nigeria has exported more to South Africa than it has imported every year since 2002.
  • Exports peaked at $6.29 billion in 2014, driven almost entirely by mineral fuels.
  • Imports from South Africa have remained below $1 billion annually.
  • Nigeria recorded a $1.27 billion trade surplus with South Africa in 2025.
  • Mineral fuels made up over 95% of Nigeria's exports throughout 1995-2025.

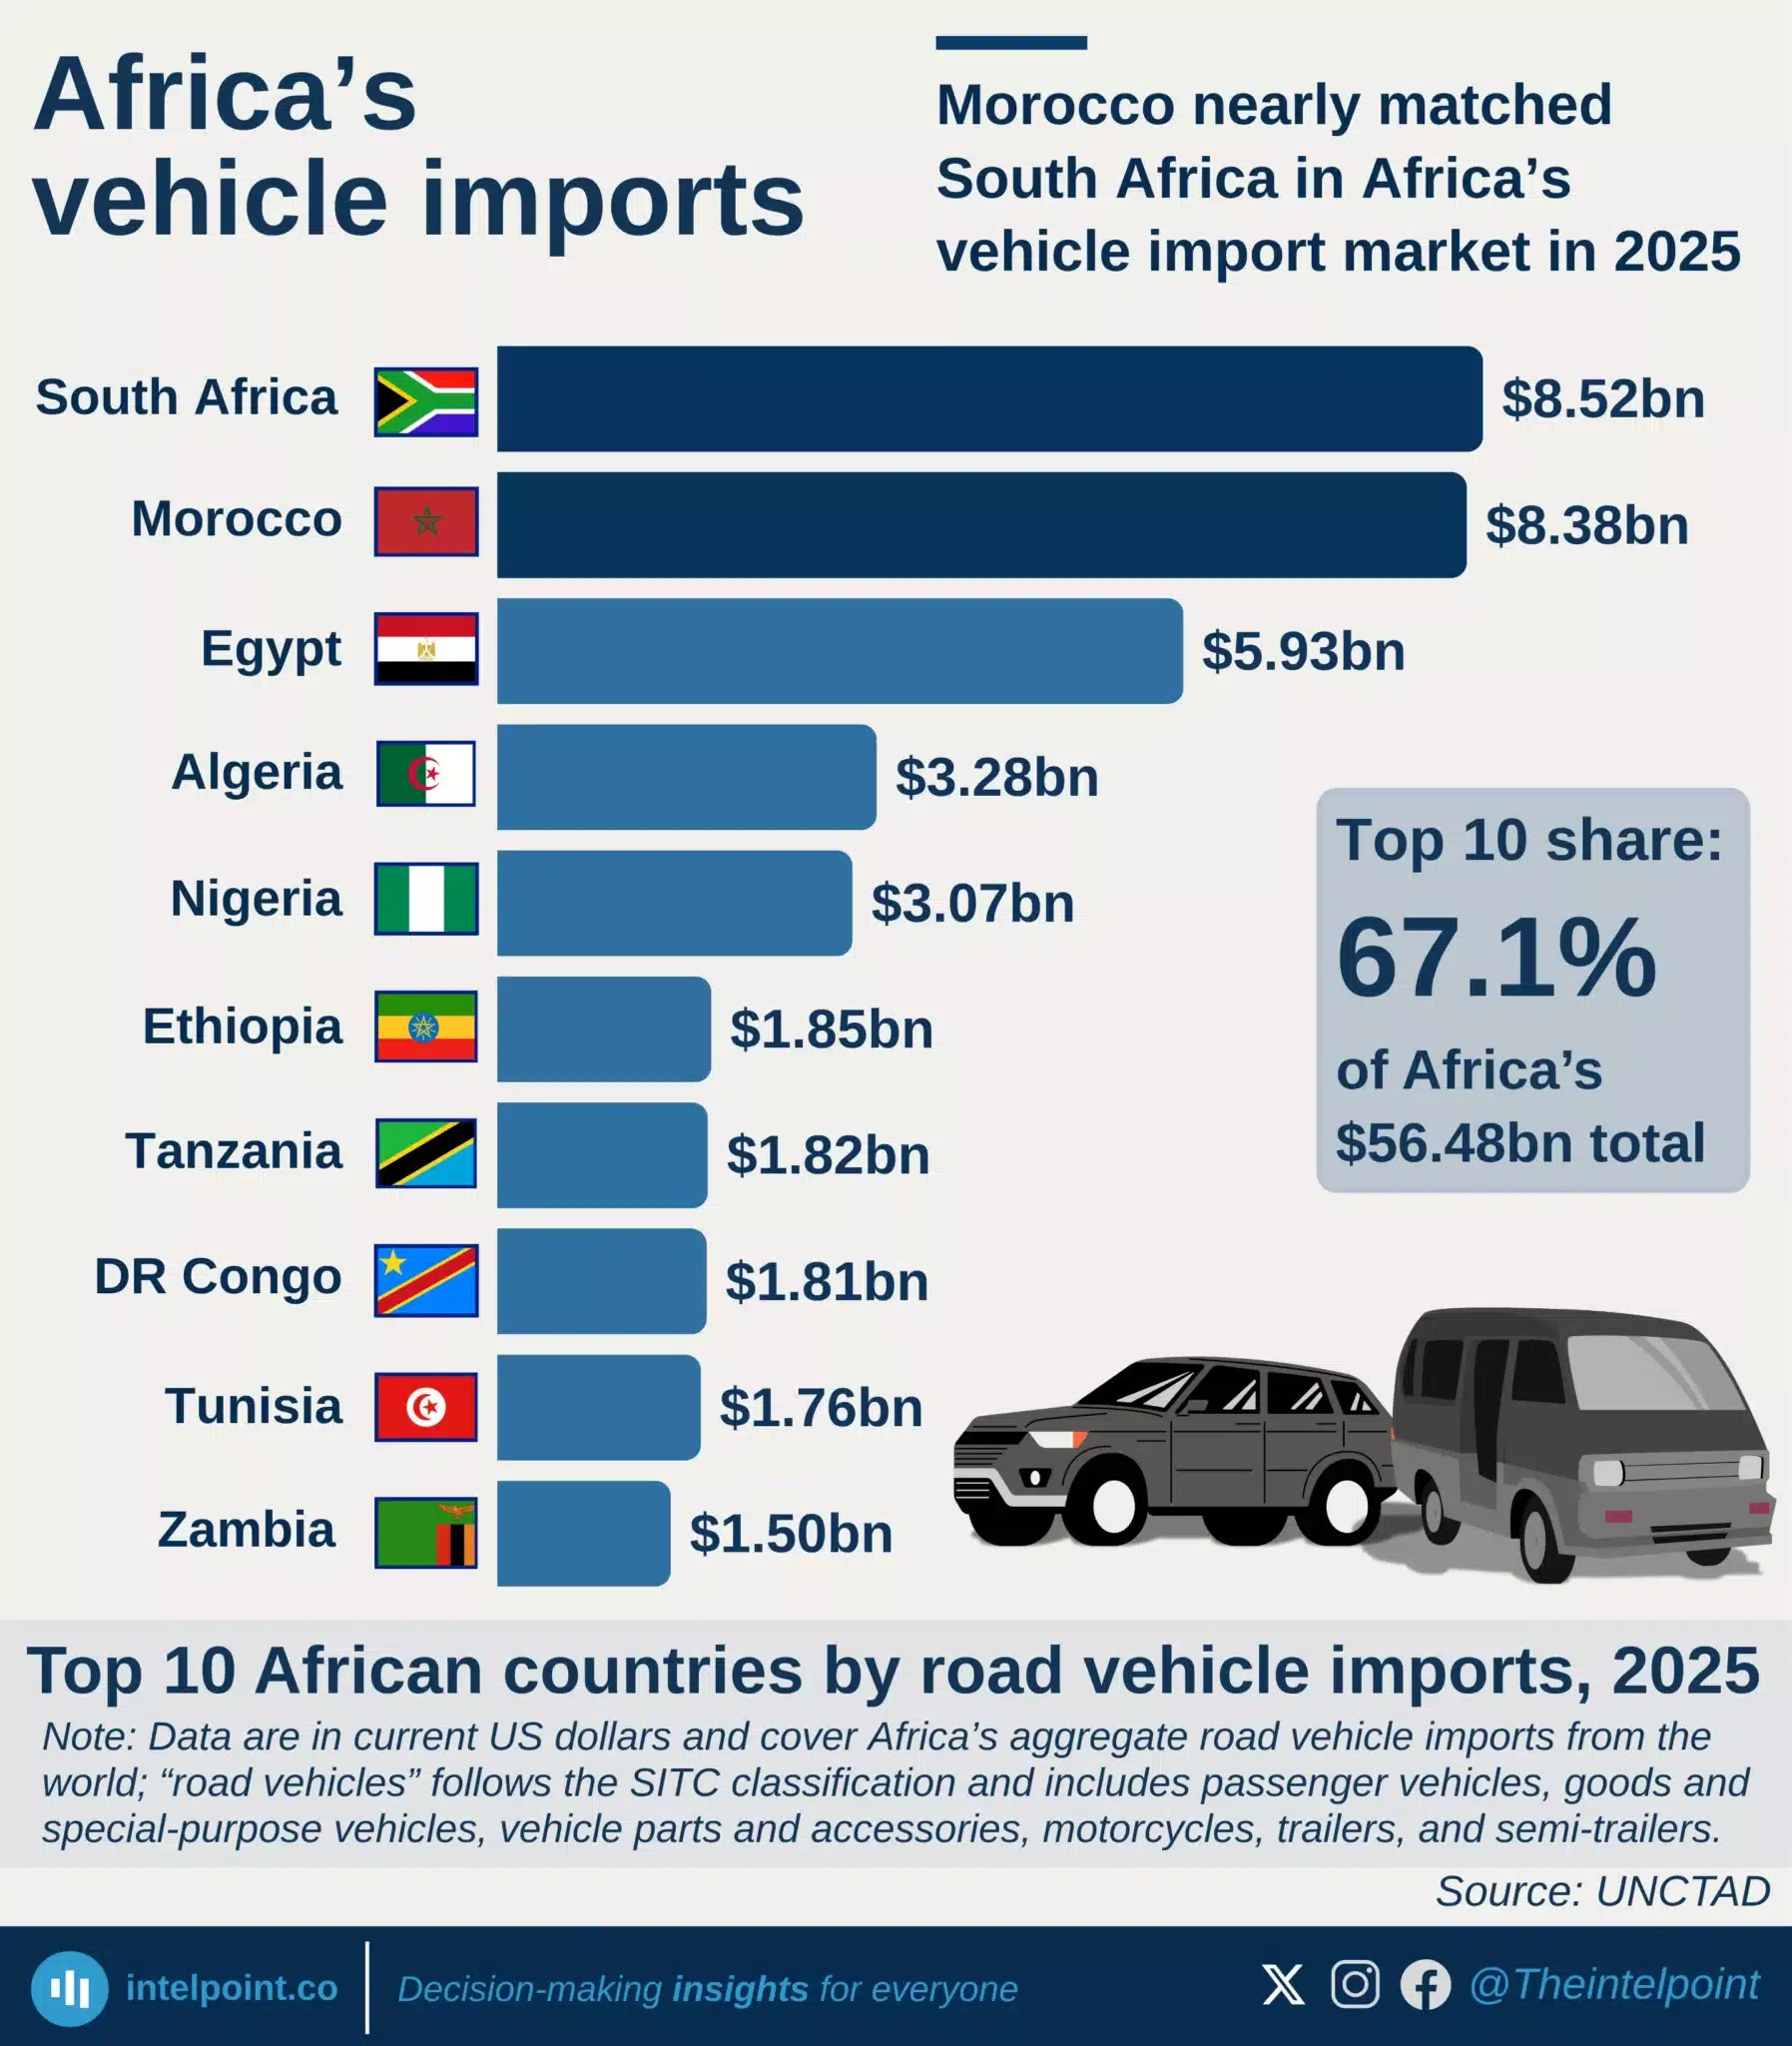
Morocco nearly matched South Africa in Africa’s vehicle import market in 2025
  • South Africa led with $8.52 billion, only $140 million ahead of Morocco.
  • Morocco’s imports have grown steadily, while South Africa’s 2025 figure was a recovery toward its 2012 peak.
  • Egypt ranked third, followed by Algeria and Nigeria.
  • The top 10 markets accounted for 67.1% of Africa’s $56.48 billion total.
  • Road vehicle imports include vehicles, parts, motorcycles, trailers, and semi-trailers.

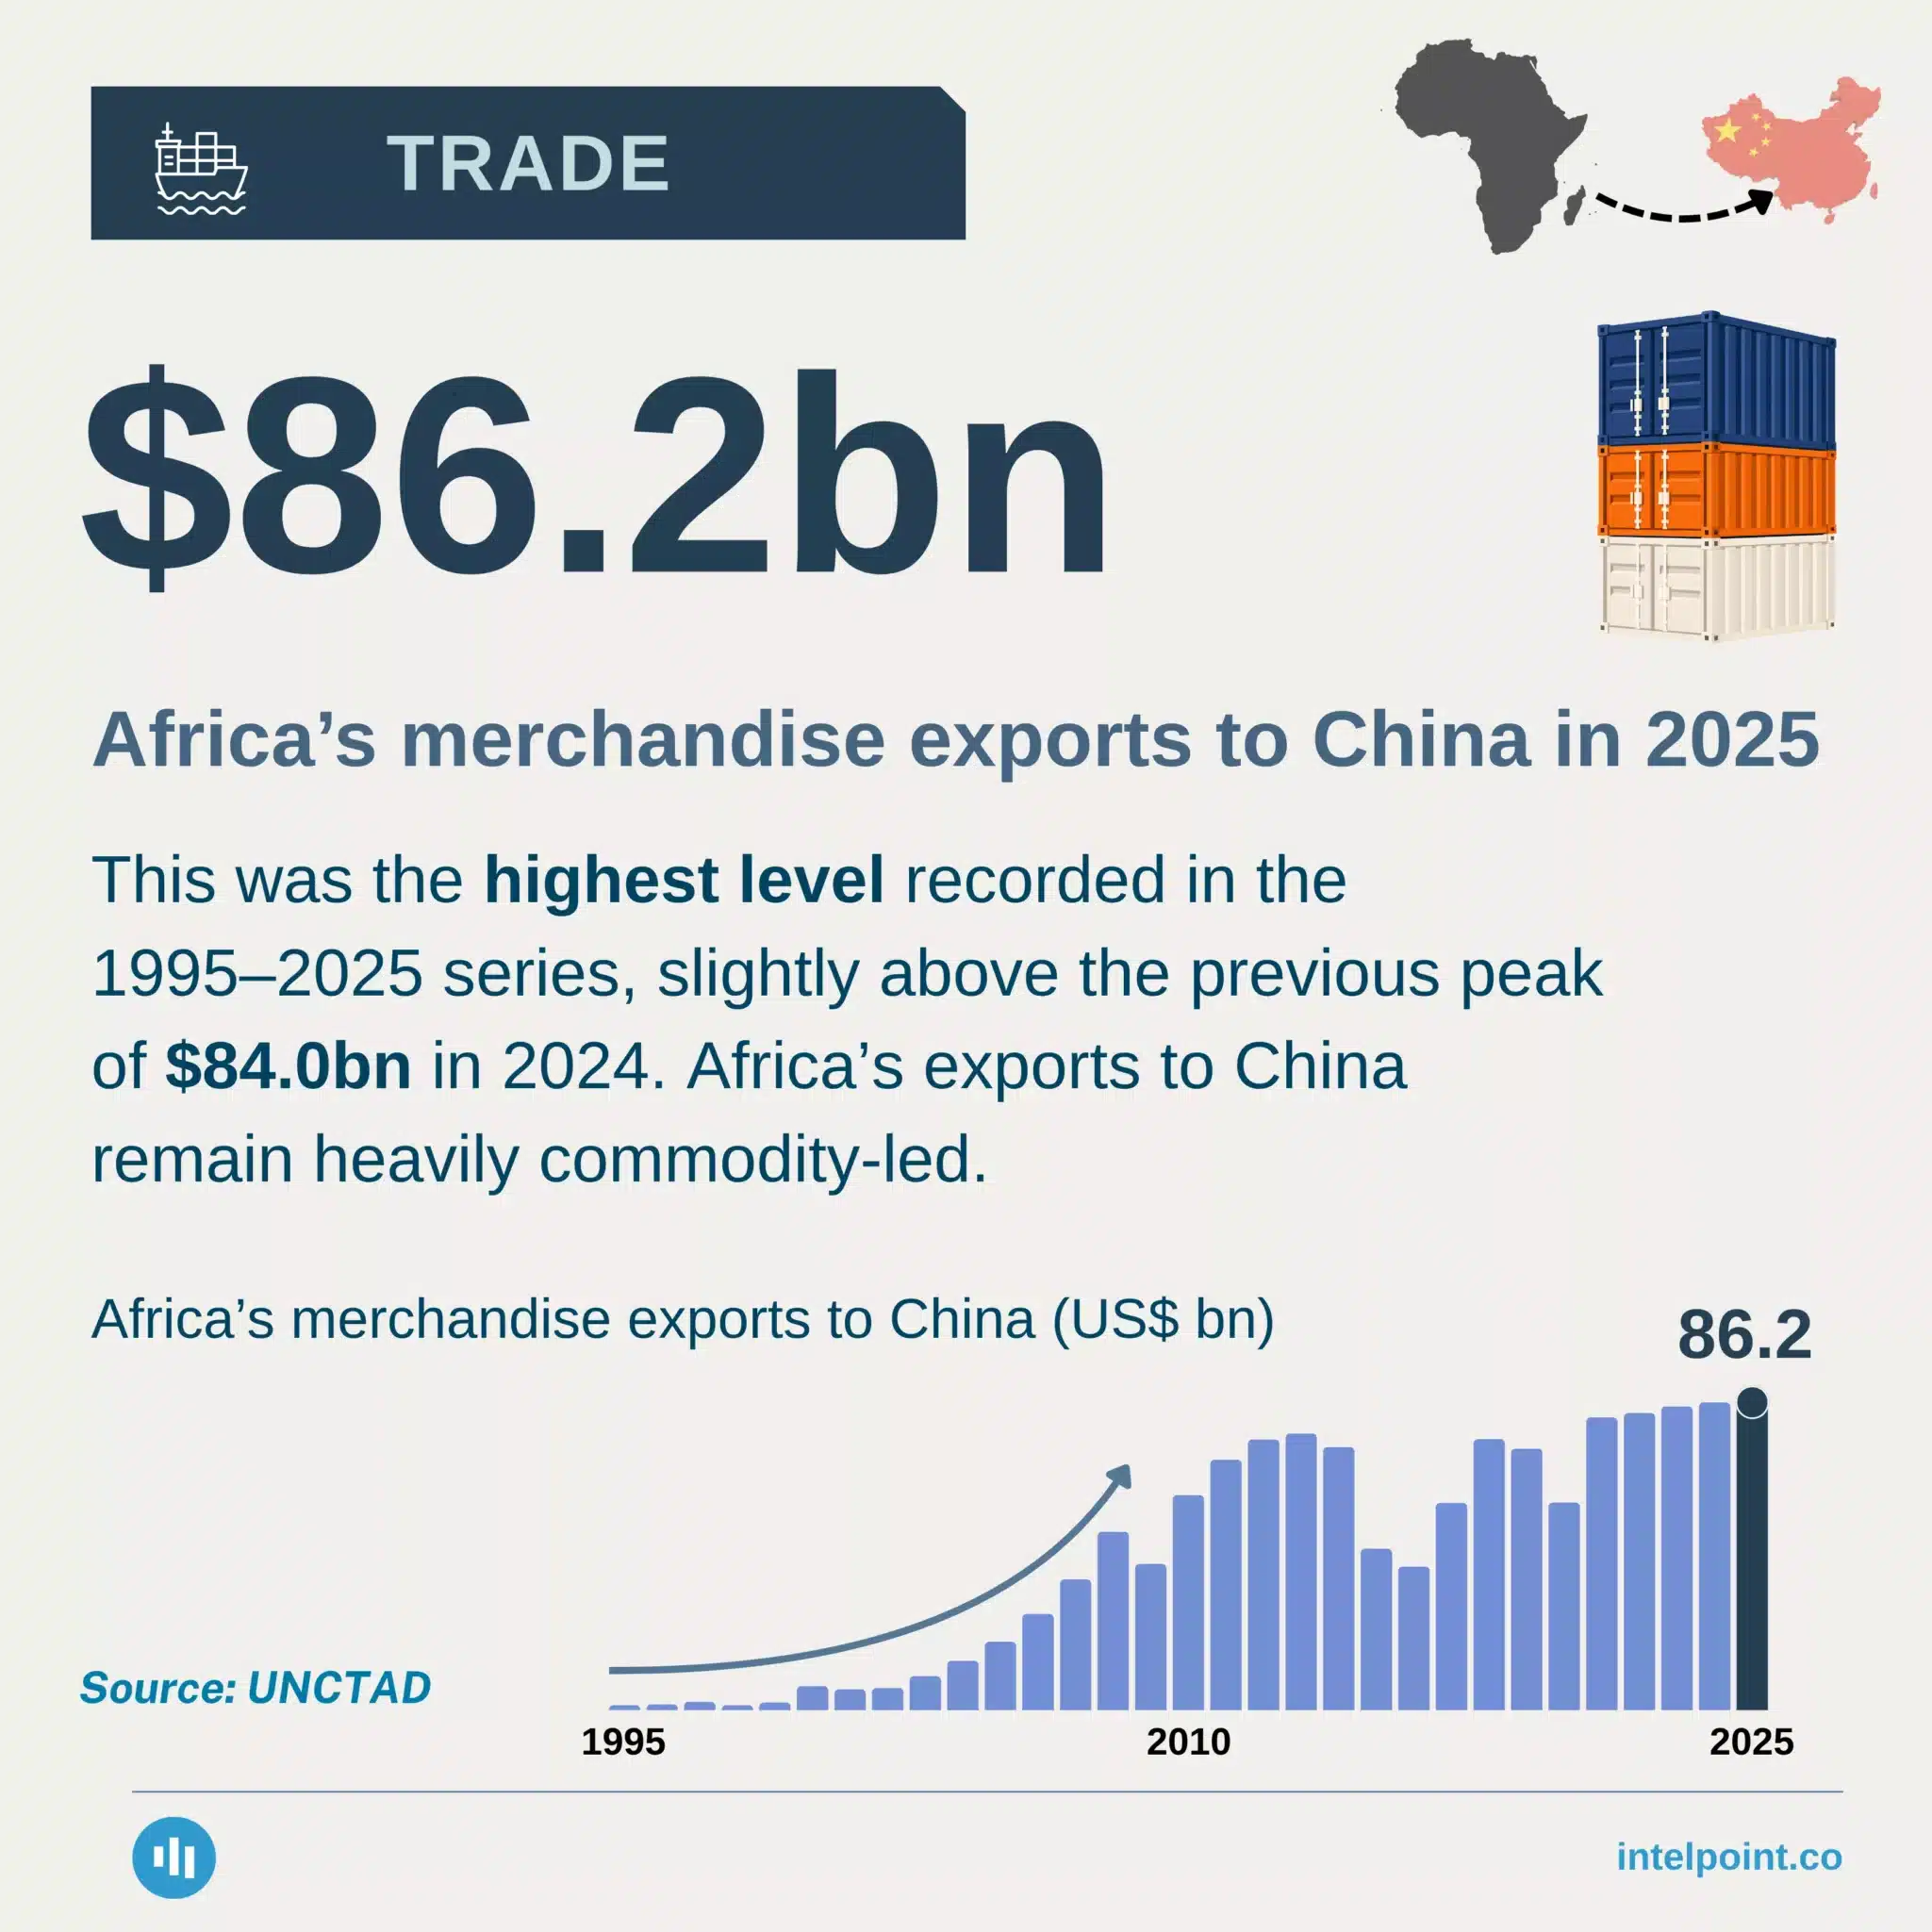
Africa’s merchandise exports to China in 2025
  • Africa exported a record $86.2bn worth of goods to China in 2025.
  • China received about 12.5% of Africa’s total merchandise exports.
  • Annual exports remained below $10bn until 2004, before accelerating sharply.
  • Export values have remained relatively high since 2021 despite earlier downturns.
  • The trade relationship remains heavily commodity-led, with limited manufactured exports.

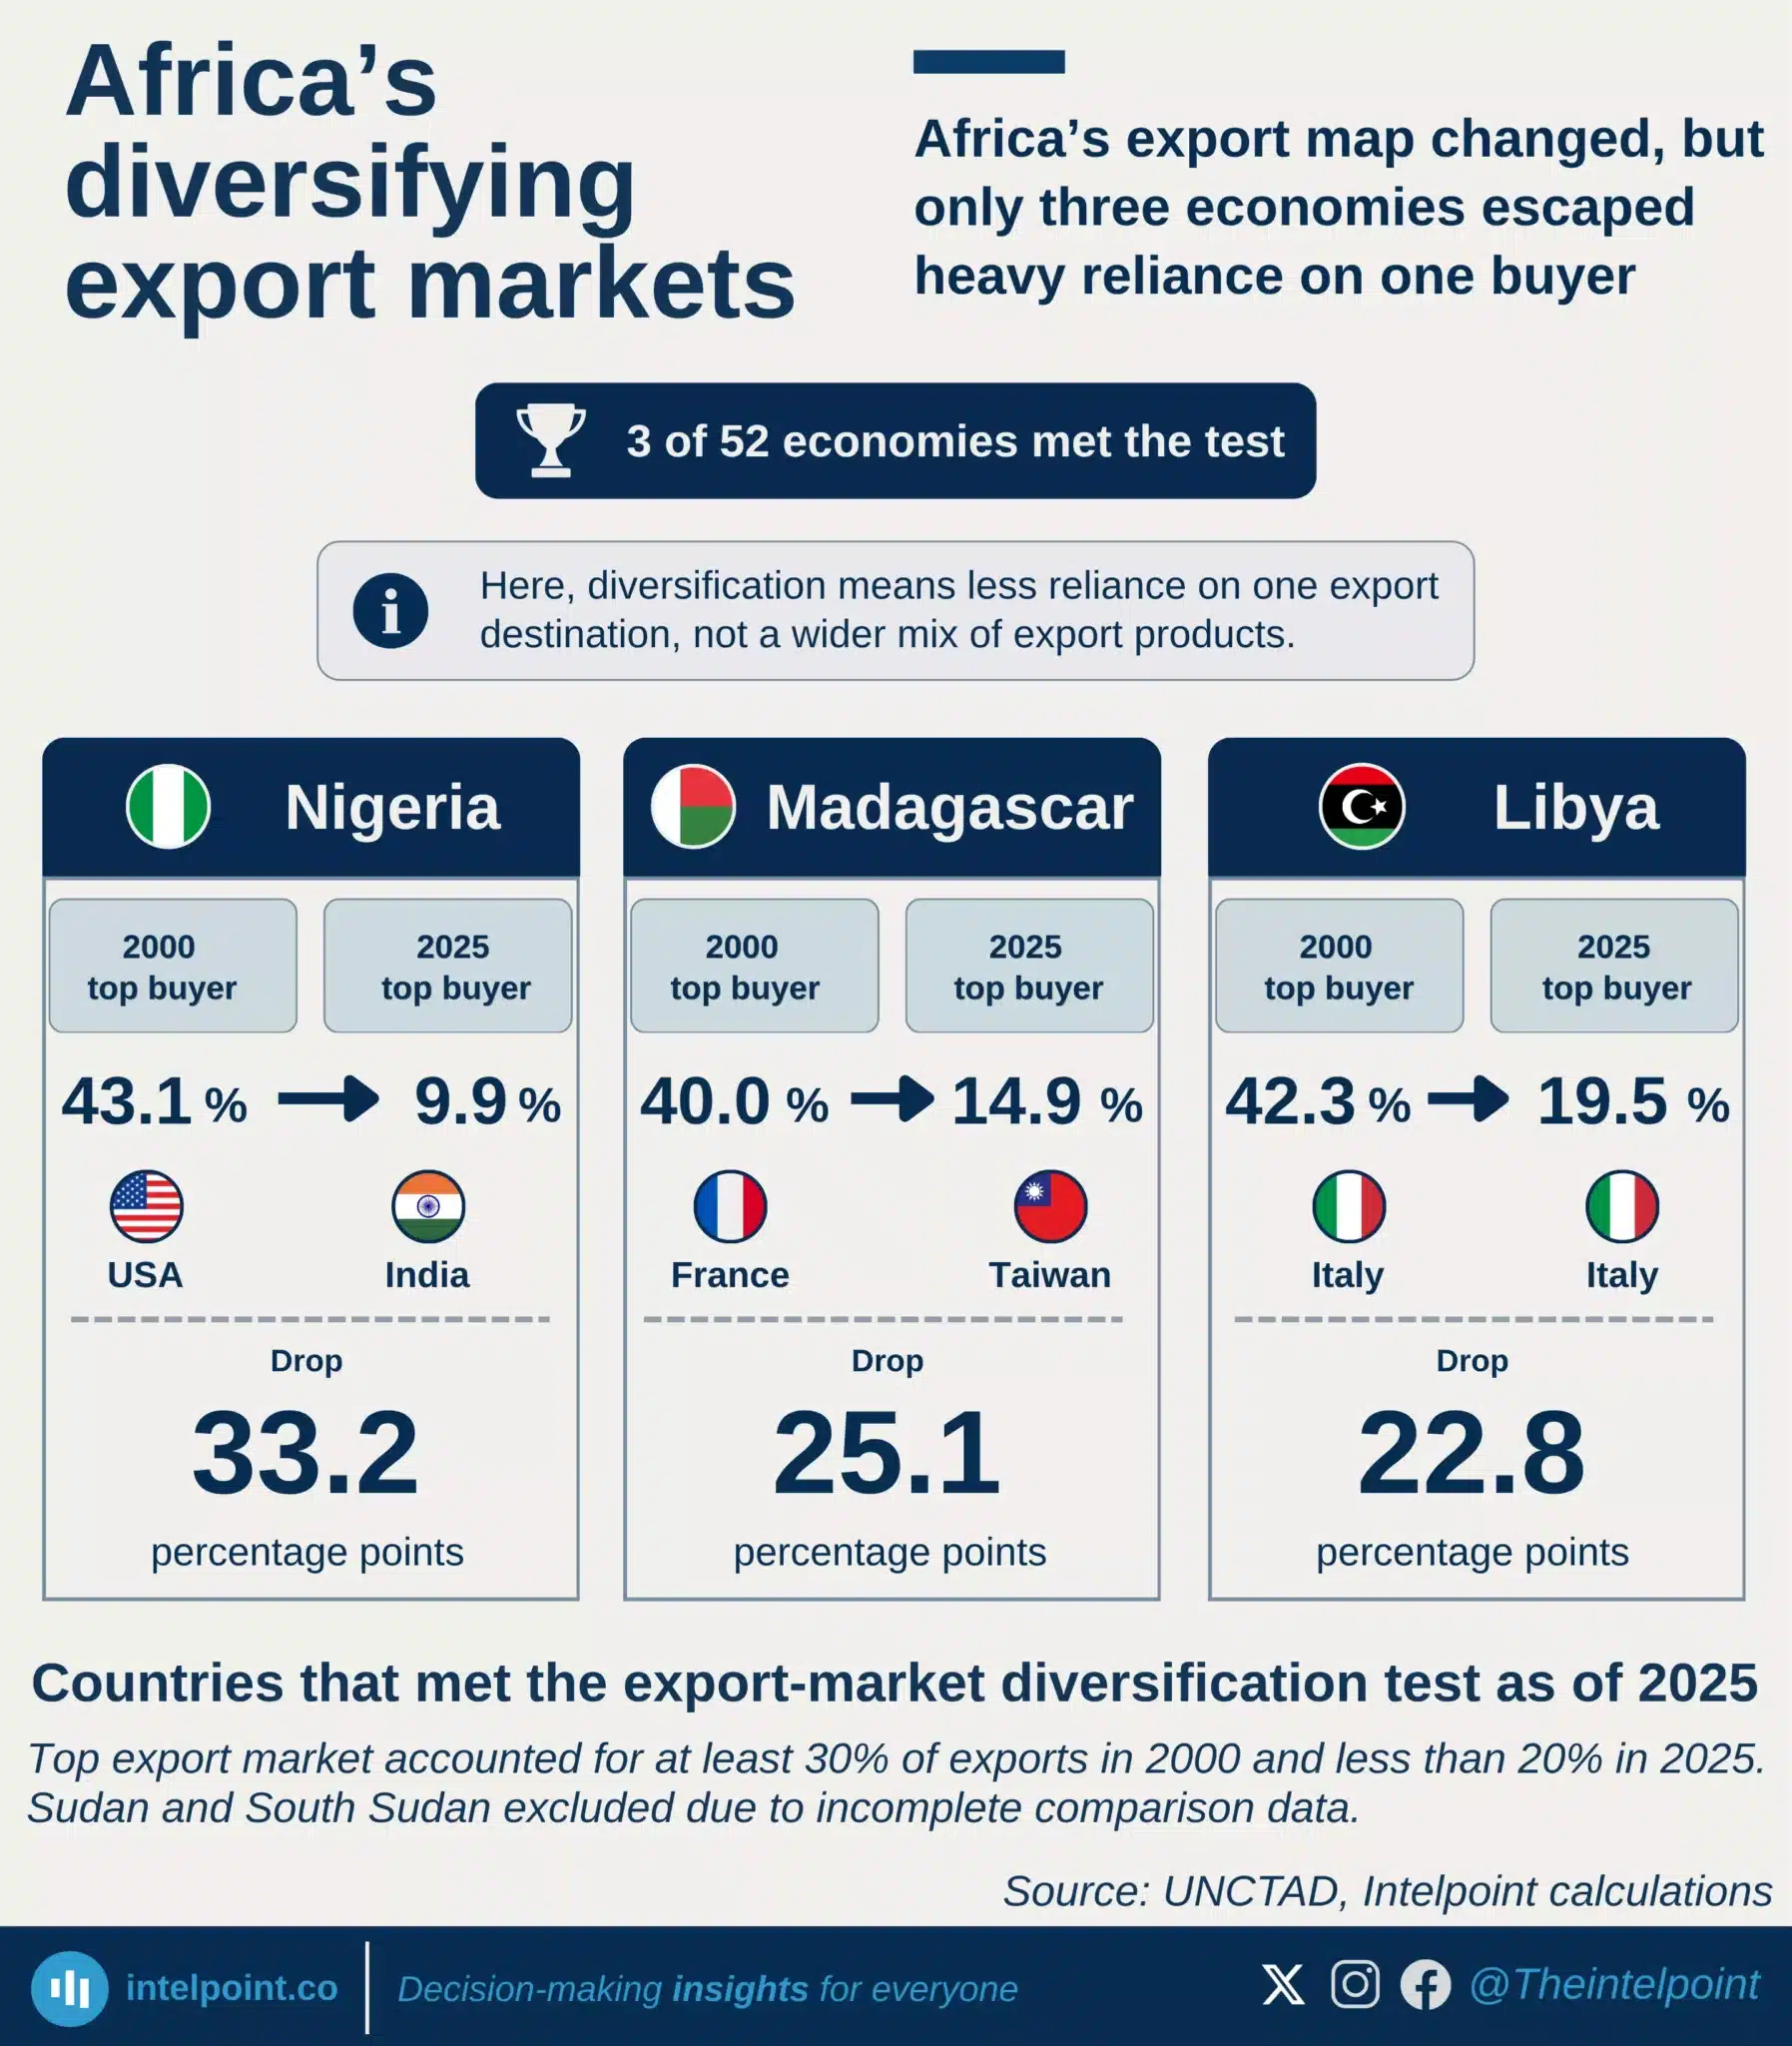
Africa’s export map changed, but only three economies escaped heavy reliance on one buyer
  • Only 3 of 52 African economies met the export-market diversification test in 2025.
  • Nigeria recorded the largest and most sustained shift, with its top-buyer share falling from 43.1% to 9.9%.
  • Madagascar’s top-market share dropped from 40.0% to 14.9% and has remained below 20% since 2021.
  • Libya narrowly qualified at 19.5%, after remaining above the threshold in 2024.
  • The test measures reduced dependence on one export destination, not greater product diversification.

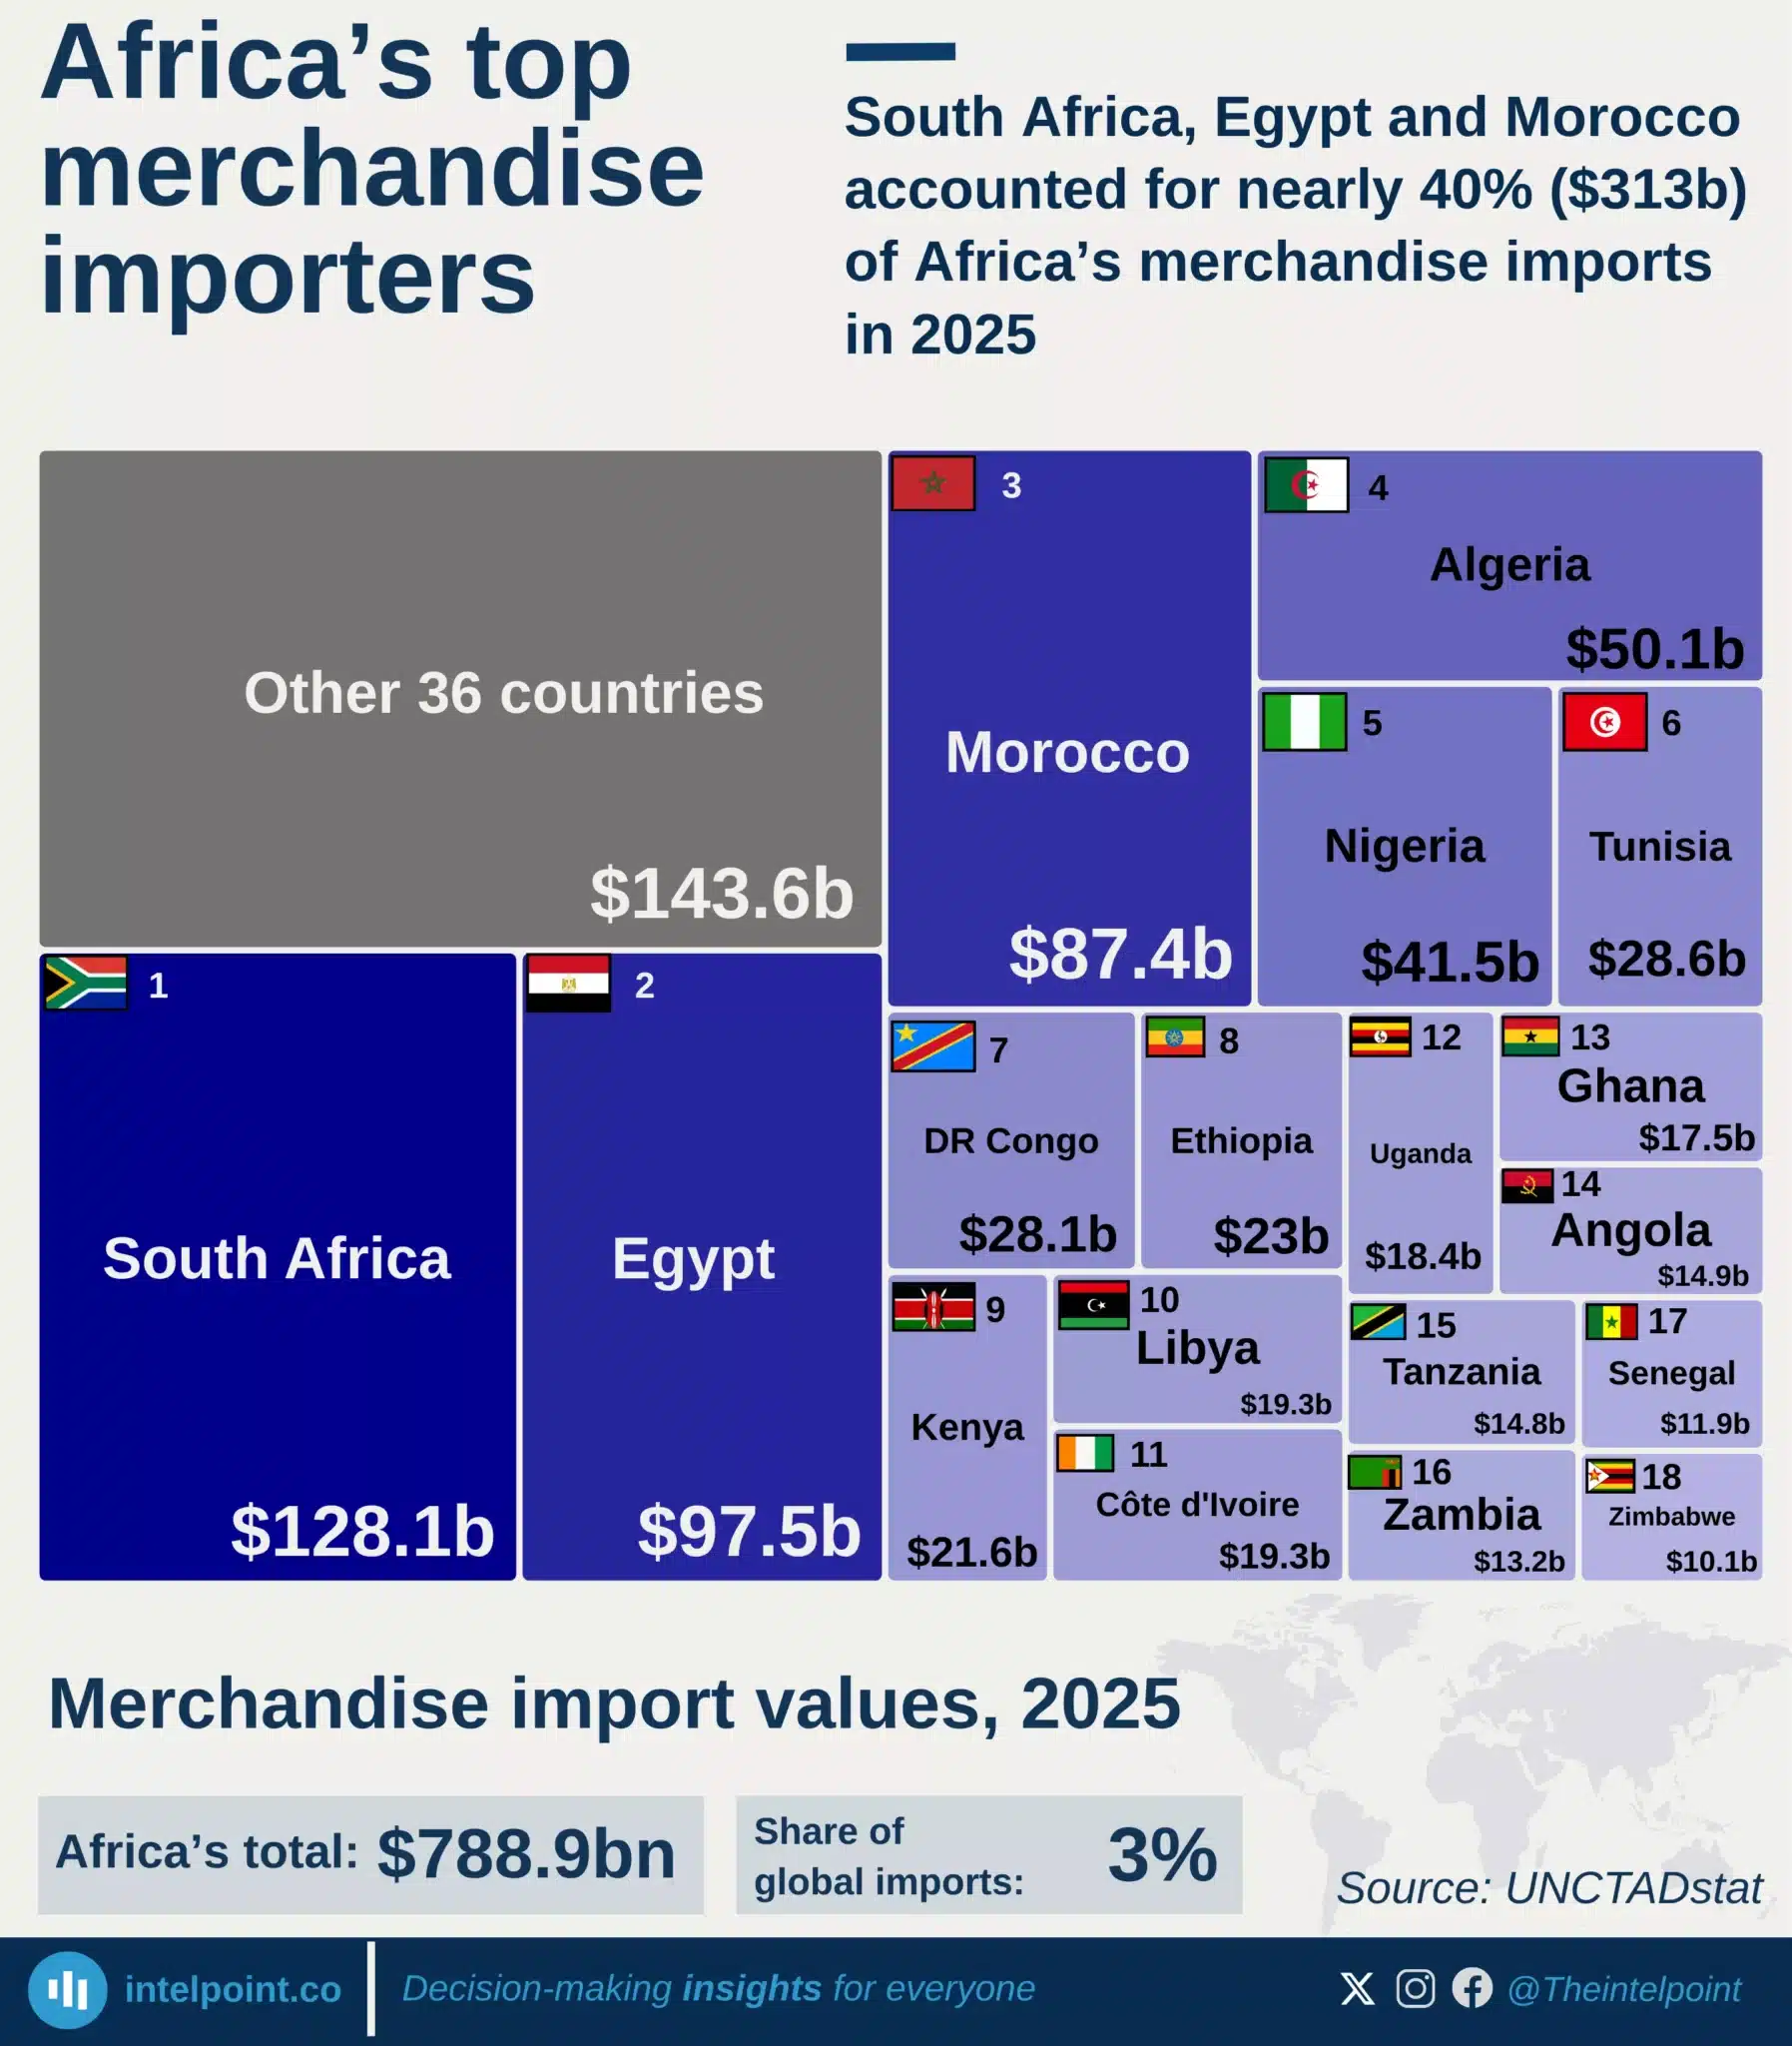
South Africa, Egypt and Morocco accounted for nearly 40% ($313b) of Africa’s merchandise imports in 2025
  • Africa imported merchandise worth $788.9 billion in 2025, representing about 3% of global merchandise imports.
  • South Africa was Africa’s largest merchandise importer, with imports valued at $128.1 billion.
  • Egypt ranked second at $97.5 billion, followed by Morocco at $87.4 billion.
  • The three largest importers accounted for $313 billion, or 39.7% of Africa’s total merchandise imports.
  • South Africa alone accounted for about 16.2% of the continental total.
  • The five largest importers, including Algeria and Nigeria, were responsible for $404.6 billion, or 51.3% of Africa’s imports.
  • Nigeria ranked fifth, with merchandise imports valued at $41.5 billion.

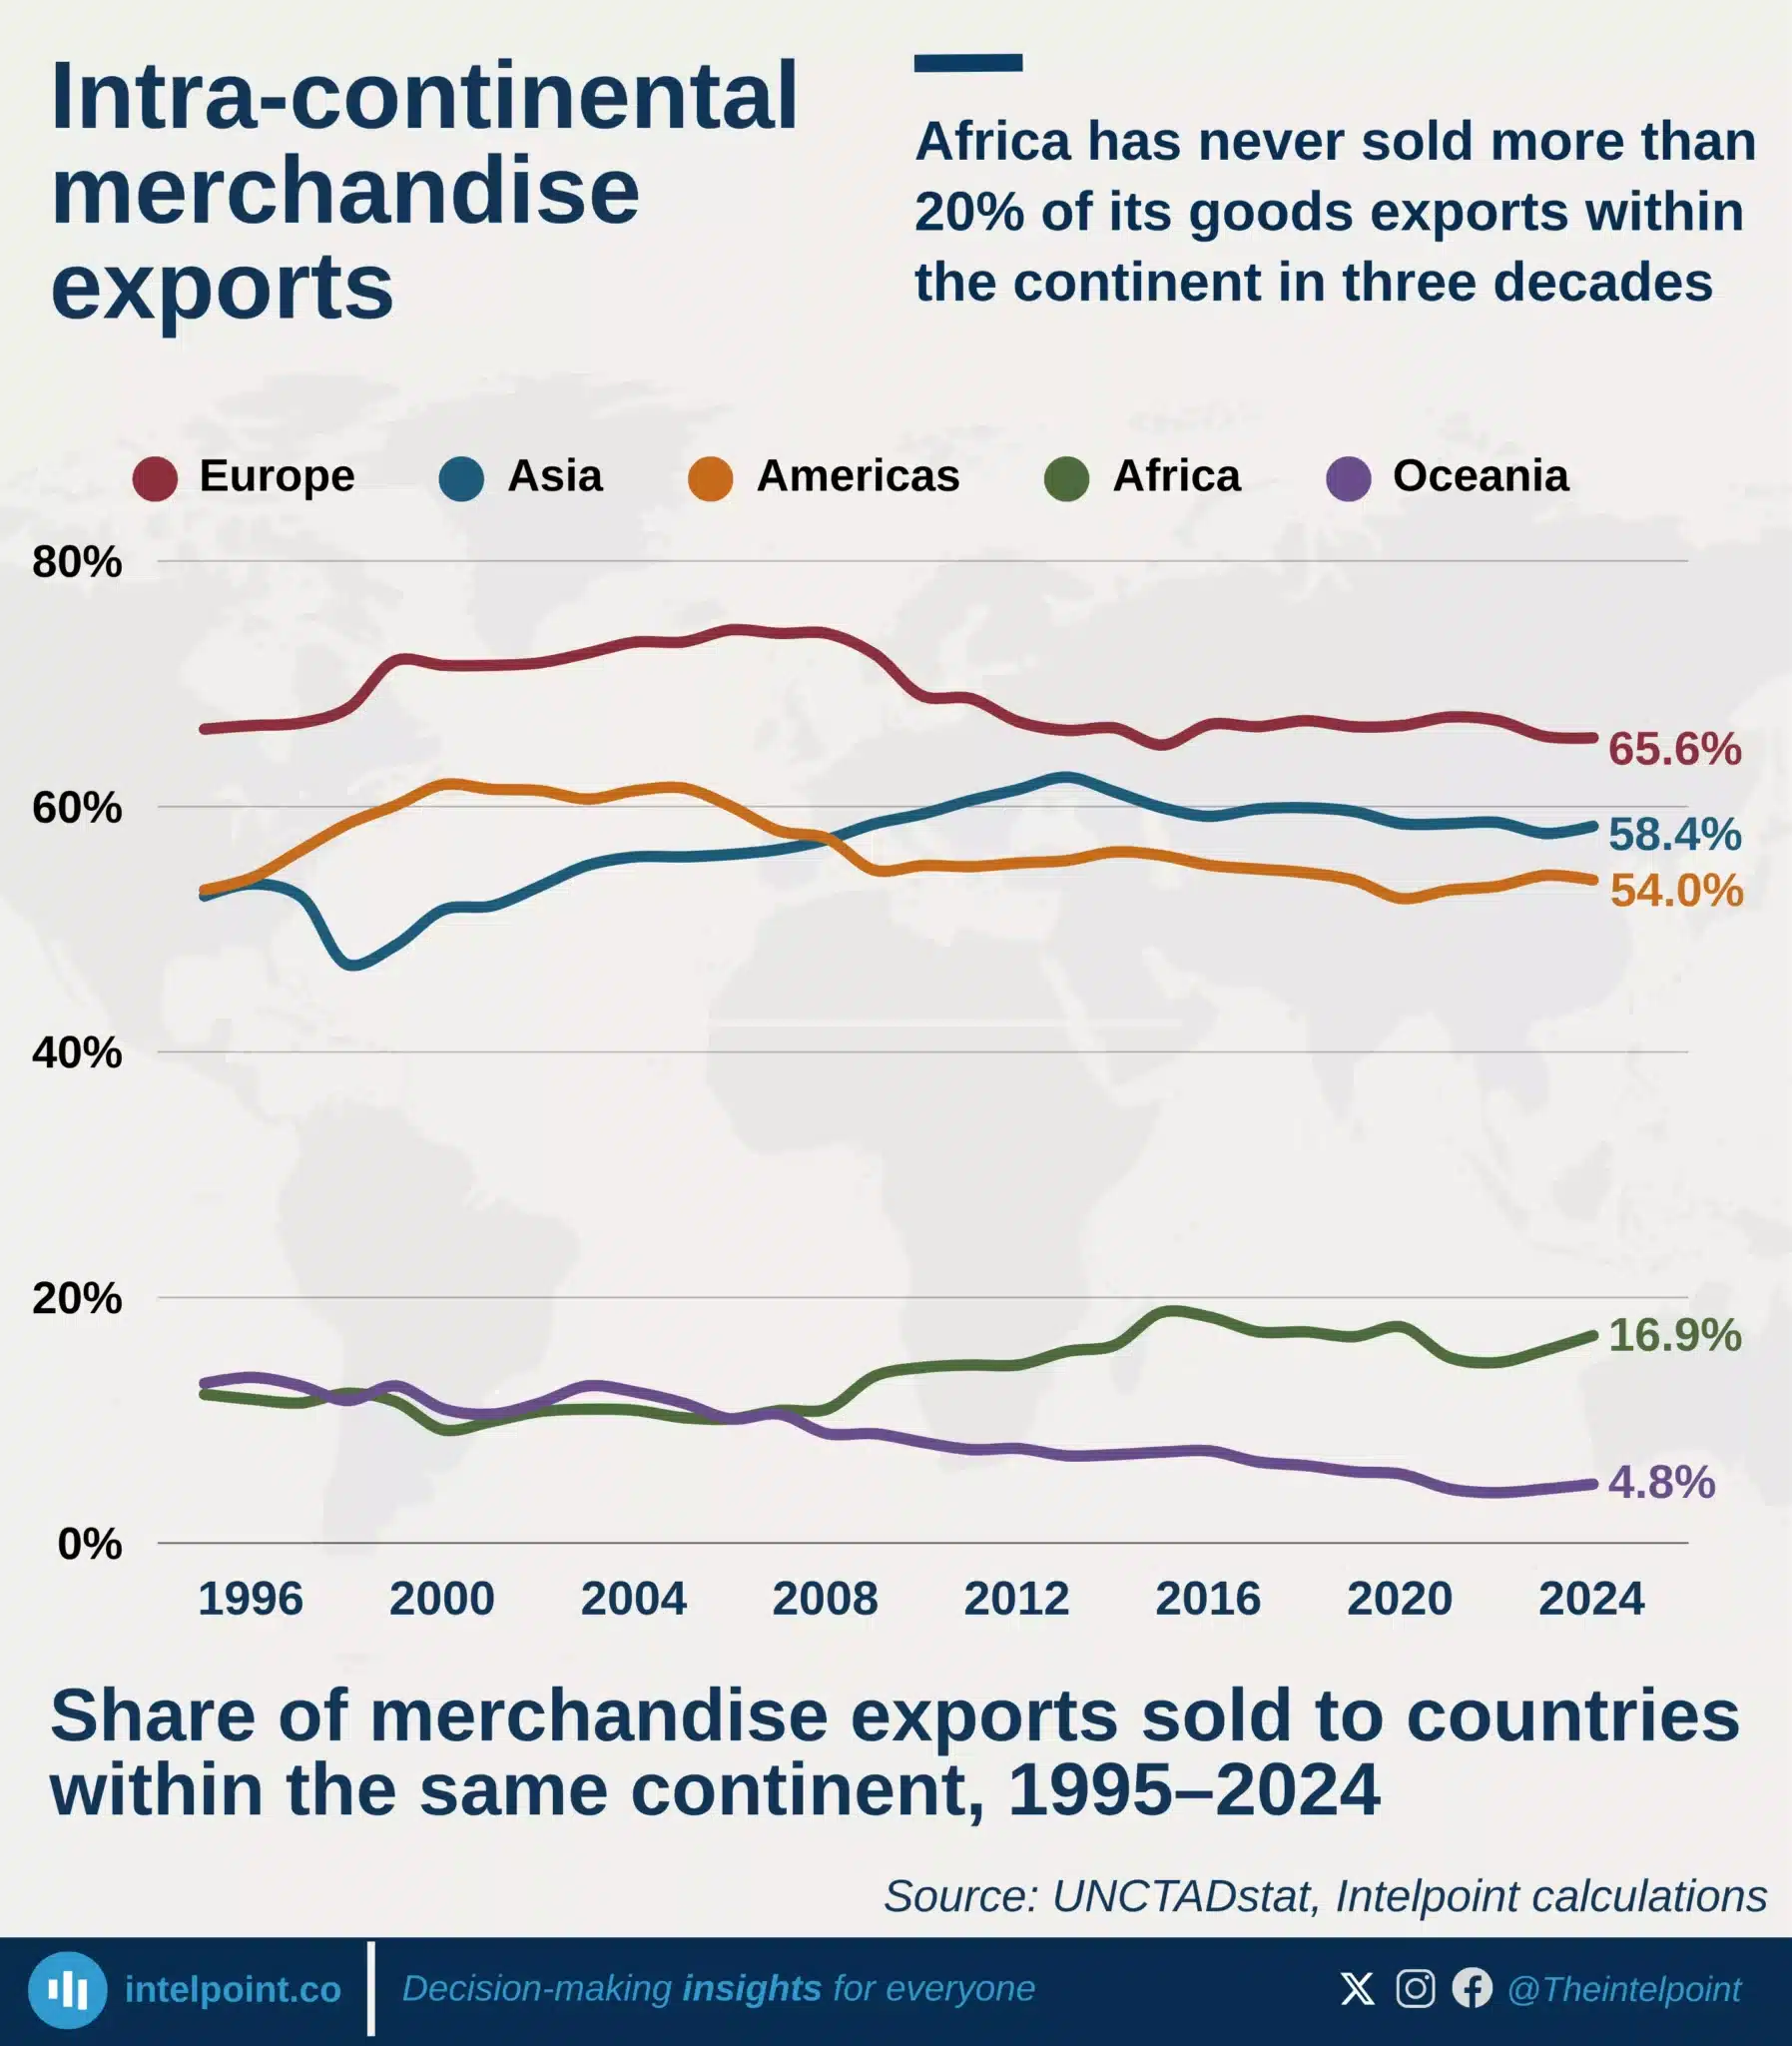
Africa has never sold more than 20% of its goods exports within the continent in three decades
  • Only 16.9% of Africa’s merchandise exports were sold to other African countries in 2024.
  • Africa had the second-lowest intra-continental export share, ahead only of Oceania’s 4.8%.
  • Europe recorded the highest share at 65.6%, followed by Asia at 58.4% and the Americas at 54.0%.
  • Europe’s intra-continental export share was nearly four times Africa’s.
  • Africa’s share increased from 12.1% in 1995 to 16.9% in 2024, a rise of 4.8 percentage points.
  • Despite this long-term improvement, Africa remained below its 2015 peak of 18.8%.
  • Africa has not crossed the 20% mark at any point in the three decades covered.

POPULAR TOPICS
SIGN UP TO OUR NEWSLETTER
Get periodic updates about the African startup space, access to our reports, among others.
Subscribe Here
Subscription Form

A product of Techpoint Africa. All rights reserved