Anambra State records the highest average intercity bus fare at ₦9,862, exceeding the lowest (Kwara) by a substantial ₦3,871

  • Anambra has the highest intercity transport fare at ₦9,862, exceeding the national average by ₦1,857.
  • Kwara recorded the lowest fare at ₦5,991, a difference of nearly ₦3,900 from Anambra.
  • The national average fare for intercity bus travel stood at ₦8,005 as of July 2025.
  • Imo (₦9,710) and Oyo (₦9,708) followed closely behind Anambra, rounding out the top three highest-fare states.
  • The South West (₦8,570) and South East (₦8,547) were the most expensive regions for intercity bus travel.

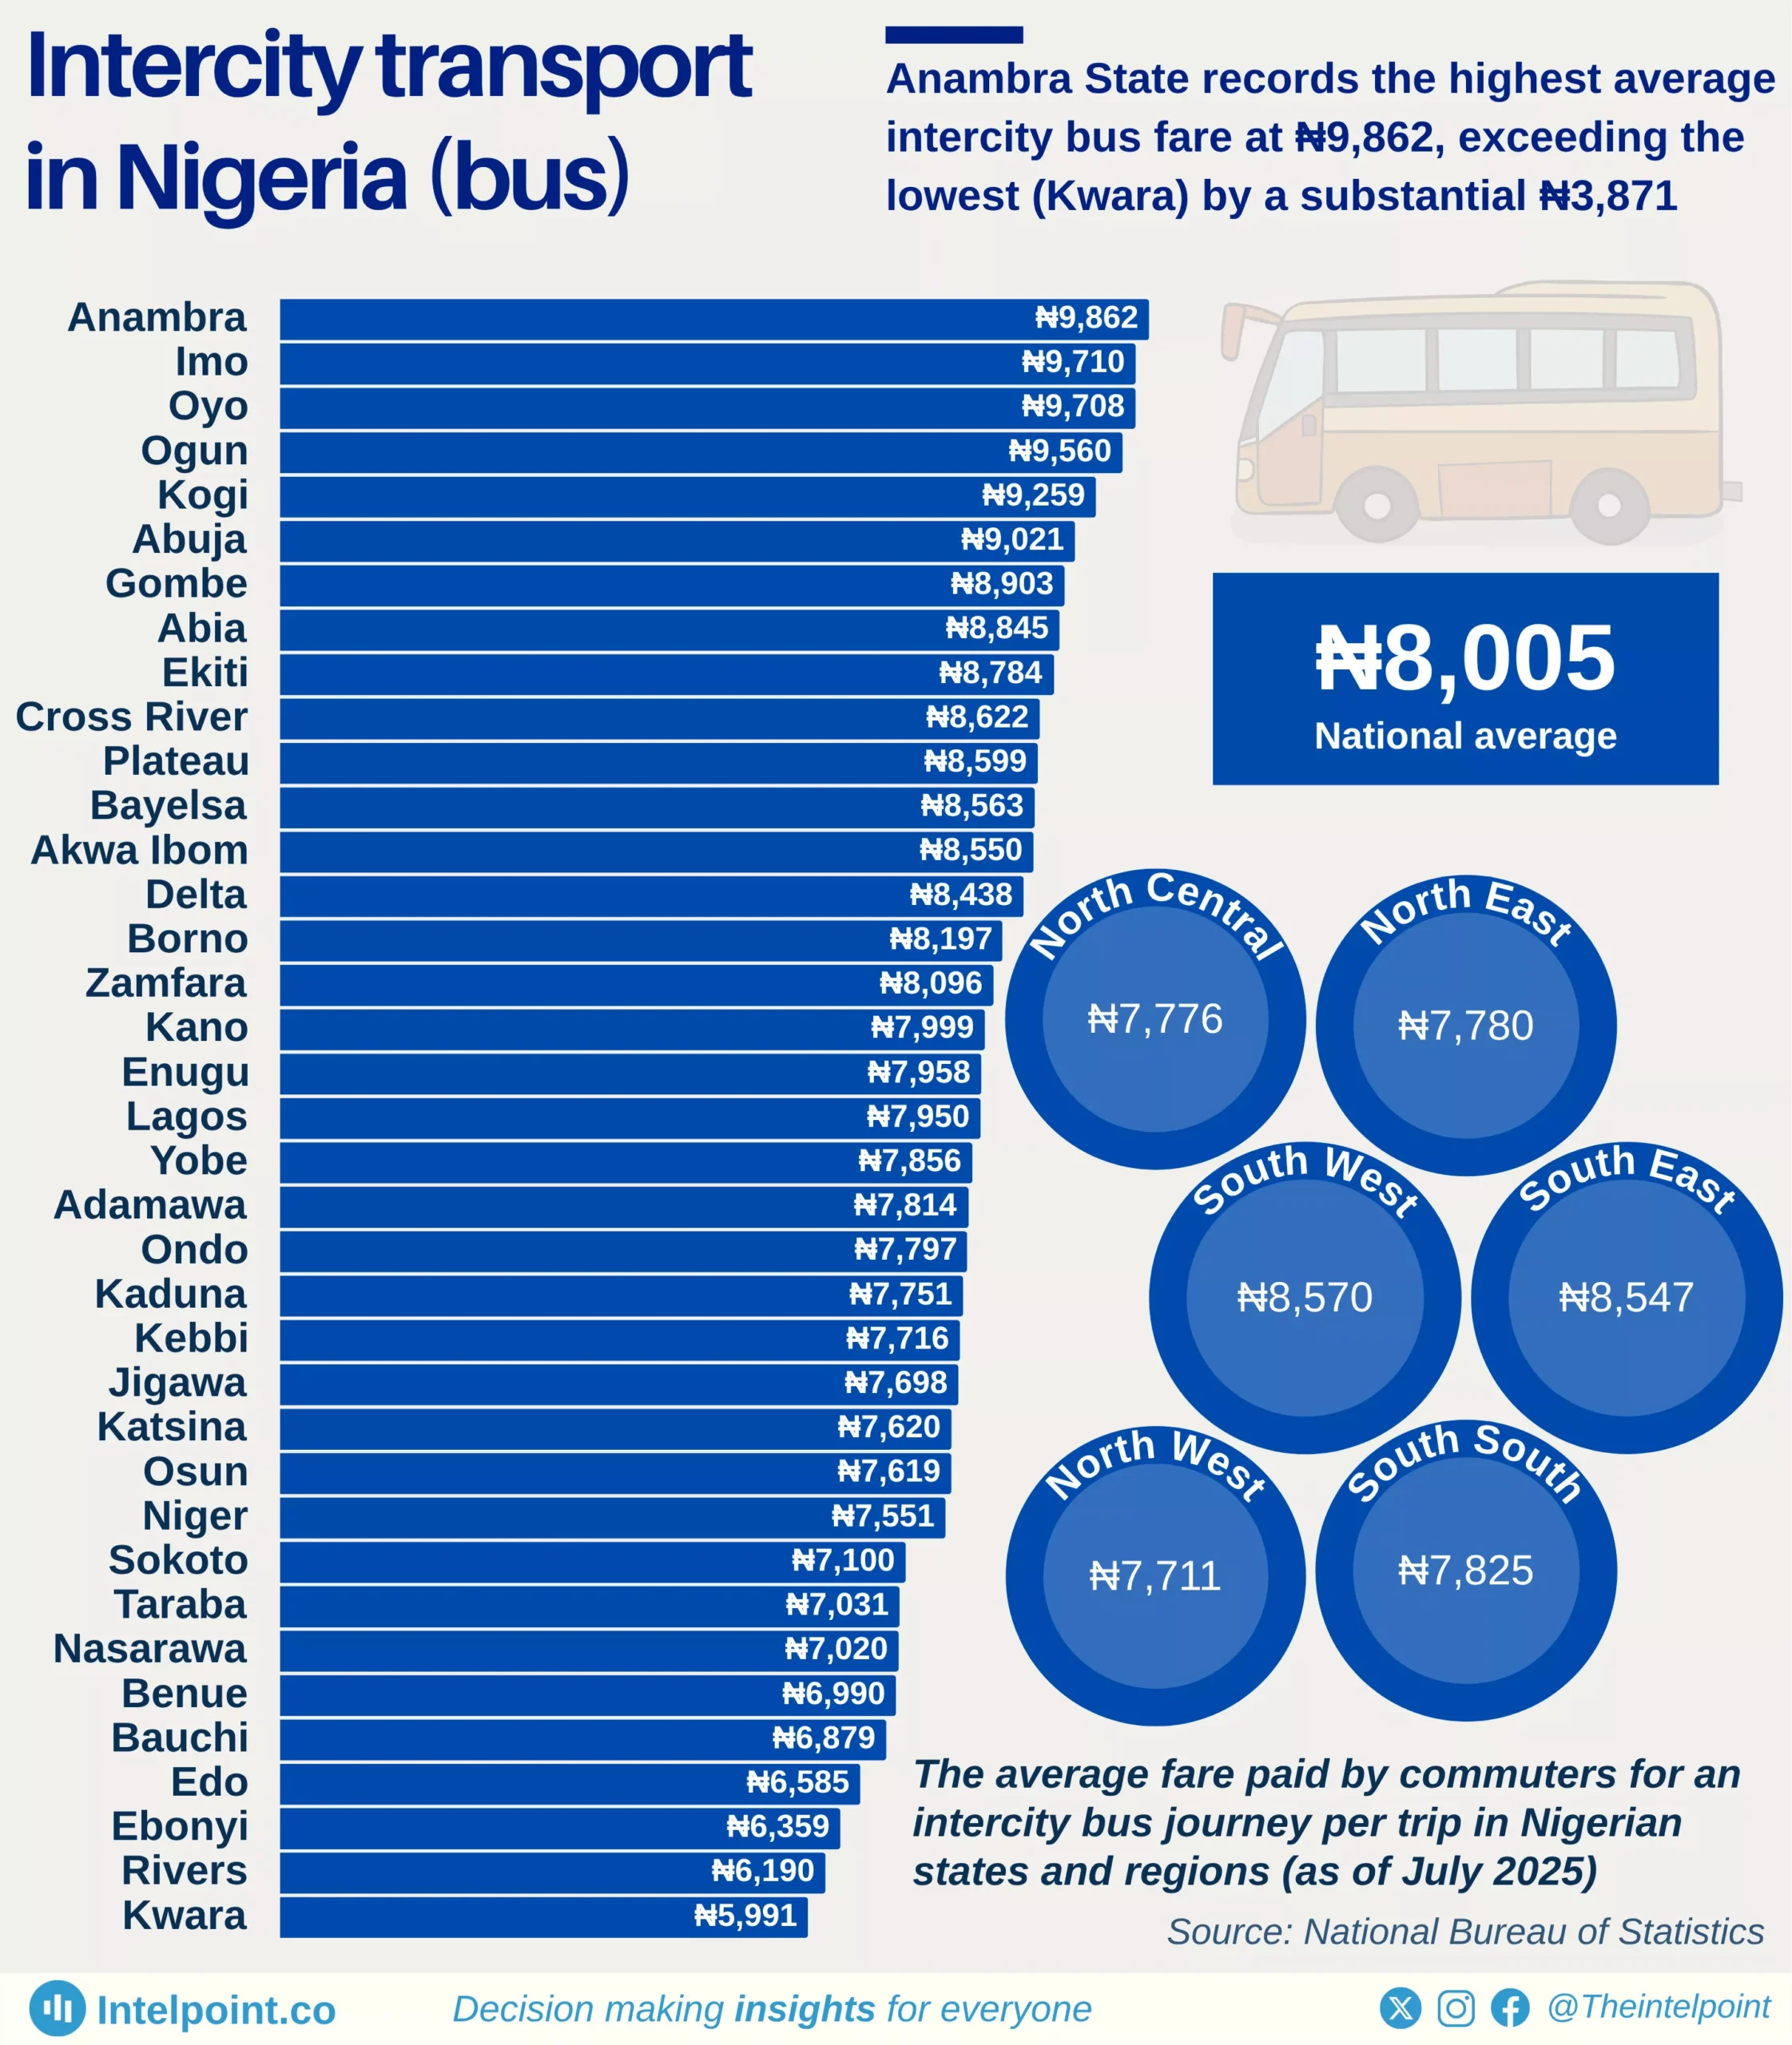
Anambra State recorded the highest average intercity bus fare in Nigeria at ₦9,862 as of July 2025, exceeding the national average of ₦8,005 and nearly doubling that of Kwara, which had the lowest fare at ₦5,991. This significant cost difference (₦3,871) highlights how distance, fuel prices, route demand, and regional economic activity shape transport pricing across Nigerian states.

Southern states dominate the top of the list, with Anambra, Imo, and Oyo leading, while northern states like Kwara, Bauchi, and Benue fall among those with lower intercity fares. At the regional level, the South West and South East recorded the highest average fares at ₦8,570 and ₦8,547, respectively — both above the national average. In contrast, North West (₦7,711) and North Central (₦7,776) recorded the lowest regional averages.

Source:

National Bureau of Statistics

Period:

July 2025
HTML code to embed chart
Want a bespoke report?
Reach out
Tags
Related Insights

Lagos State has the highest average intra-city bus fare in Nigeria at ₦1,384, exceeding the national average by over ₦355
  • Lagos State tops the list with the highest intra-city bus fare at ₦1,384, exceeding the national average by ₦355.
  • Abia State recorded the lowest average fare at ₦508, showing a stark difference of ₦876 between the highest and lowest states.
  • The national average fare for a bus trip within Nigerian cities stood at ₦1,028.40 as of July 2025.
  • Nasarawa (₦1,306) and Enugu (₦1,280) followed closely behind Lagos State, rounding out the top three highest fares.
  • The South West had the highest regional average fare (₦1,116), while the South South (₦985) and North West (₦995) had the lowest.
  • States like Taraba (₦1,250) and Zamfara (₦1,248) also featured in the top six, showing that high fares are not limited to Southern urban centres.
 

Nigerian's rail cargo volume has increased by 467% since 2020, reflecting growing trust in train transport
  • 2024 was the strongest year on record, with 495.6k tons of cargo transported, more than 60% higher than 2023 and ₦1.95 billion in freight revenue.
  • Cargo volume and revenue both crashed in 2020 due to COVID-19 disruptions, falling to 87.4k tons and ₦281.4 million respectively.
  • Recovery began in 2021–2022, as improved freight operations and industrial demand pushed steady gains in both tonnage and income.
  • Q1 2025 shows 181.5k tons and ₦650m (approx.) in revenue, signaling strong momentum that could surpass 2024 totals if maintained.

Nigeria’s rail revenue from passengers hit ₦6.7b in 2024 as traffic rebounded above 3million
  • 2020 marked the lowest point for both passenger volume (1.02 million) and revenue (₦1.7 billion), reflecting the full impact of COVID-19 lockdowns.
  • Strong recovery followed in 2021, with passenger numbers jumping to 2.71 million and revenue surging by 226% to ₦5.6 billion.
  • 2024 was the best-performing year, recording ₦6.7 billion in revenue and 3.14 million passengers, a clear sign of renewed public confidence in rail transport.
  • Q1 2025 (₦1.9 billion revenue, 929,000 passengers) suggests steady ridership levels but moderate momentum compared to the 2024 surge.

Number of road accidents by geopolitical zone in Nigeria (Cumulative, Q3 2020-Q3 2024)
  • The North Central zone accounts for the highest share of road accidents in Nigeria, contributing 34.55% of the national total.
  • Within the North Central zone, Abuja (FCT) recorded the most accidents, with a cumulative total of 8,133 cases.
  • The South West zone ranks second, responsible for 25.78% of all accidents nationwide, with Ogun State leading the zone at 6,418 accidents.
  • The South East zone has the lowest share, contributing just 5.38% of total accidents from Q2 2020 to Q2 2024.
  • Enugu State, the highest contributor within the South East, accounts for only 1.59% of the national total.

South Africa runs Africa’s longest rail network at 20,986km, while Nigeria trails 9th with 3,798km
  • South Africa leads the continent with a vast 20,986km rail network, nearly triple the size of Sudan’s, the second-largest.
  • Nigeria’s rail infrastructure measures 3,798km, ranking it behind Kenya (3,819km) and DR Congo (4,007km).
  • North African countries like Egypt and Algeria maintain significant rail mileage, exceeding 4,000km each.
  • Southern Africa dominates the top five, with Mozambique and Zimbabwe also featuring prominently.

Cars lead in road traffic crashes, while luxury bus accidents surge by 466.7% over four years
  • Cars were involved in the highest number of road accidents, recording 665 cases over the four-year period.
  • Luxury buses and bicycles recorded the highest quarter-on-quarter (QoQ) growth in accident involvement.
  • Tankers, cars, and motorcycles saw the sharpest QoQ declines, with accident rates falling by 47.2%, 30.6%, and 24.7% respectively.

POPULAR TOPICS
SIGN UP TO OUR NEWSLETTER
Get periodic updates about the African startup space, access to our reports, among others.
Subscribe Here
Subscription Form

A product of Techpoint Africa. All rights reserved