Formal financial access among Kenyan adults has more than tripled since 2006, rising from 26.7% to 84.9% by 2024

  • Formal financial access in Kenya surged from 26.7% in 2006 to 84.9% in 2024, a threefold increase.
  • The share of financially excluded adults dropped drastically from 41.3% to 9.9% over the same period.
  • Informal access, through community-based and unregulated systems, has declined steadily as more people moved to formal systems.
  • Kenya achieved over 80% formal access by 2019, marking a turning point in its financial inclusion journey.

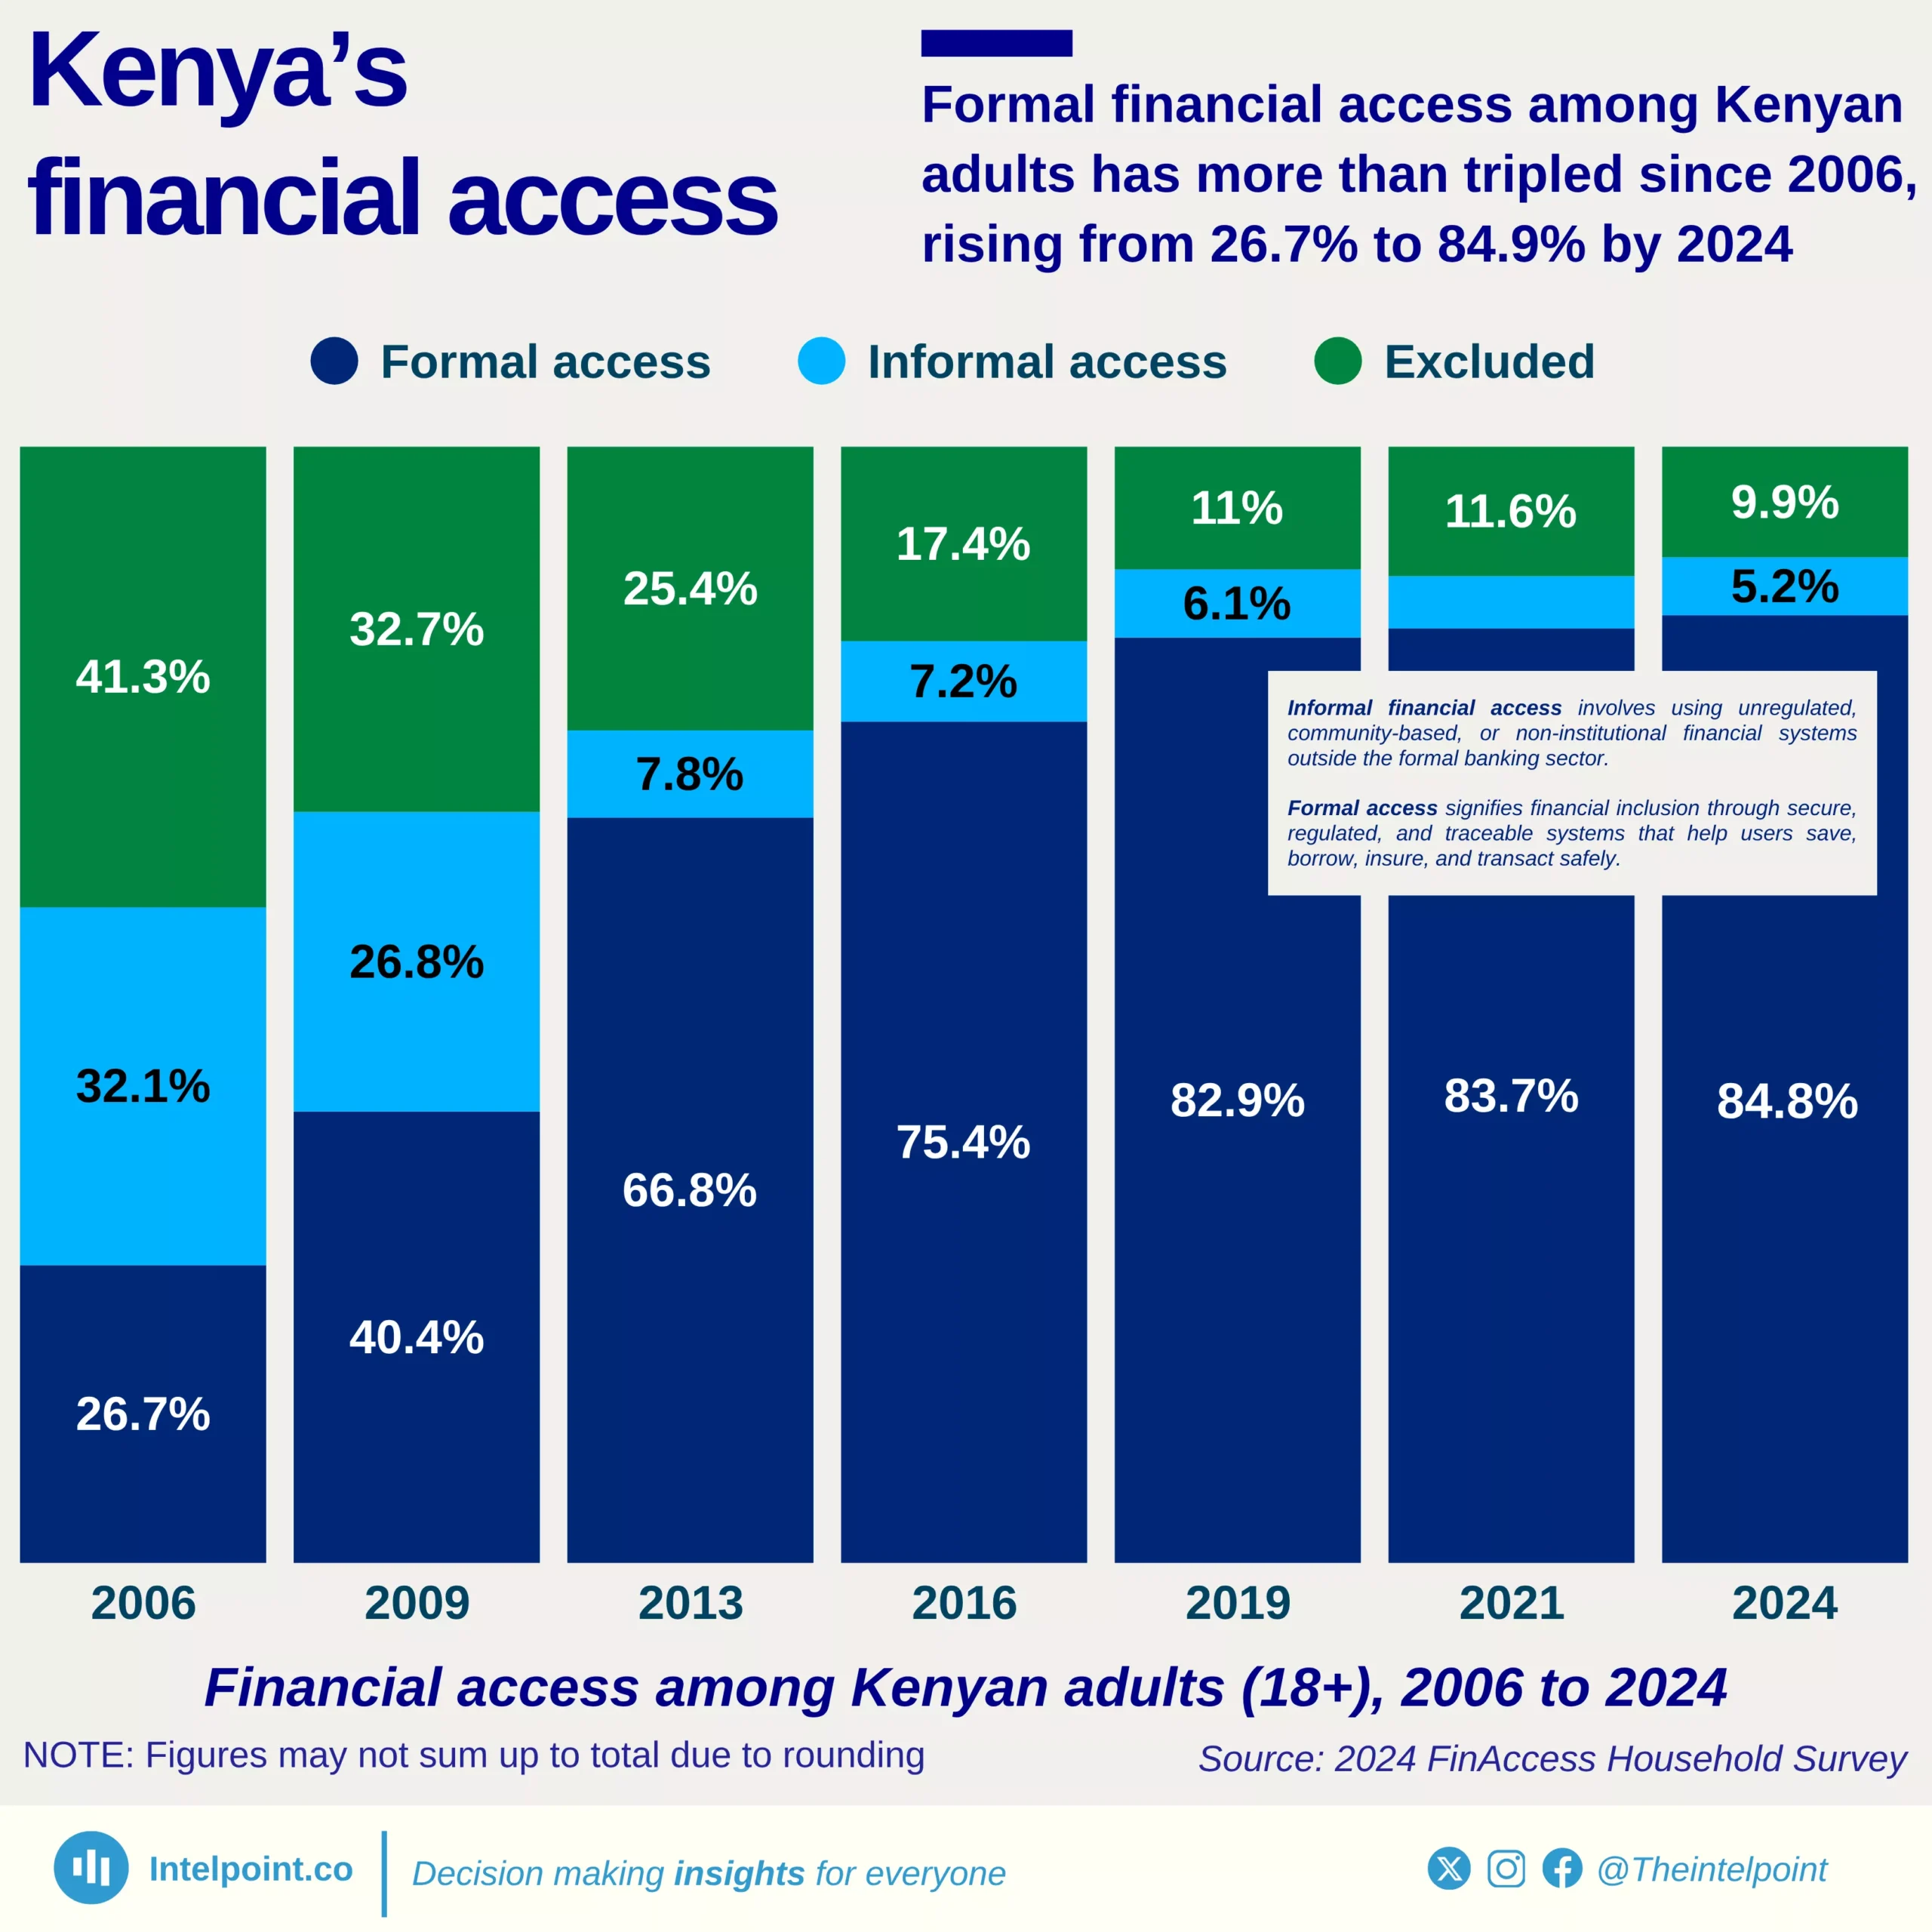
Kenya’s financial landscape has undergone a remarkable transformation in less than two decades. Formal financial access among adults has more than tripled, rising from 26.7% in 2006 to 84.9% in 2024. This shift underscores Kenya’s position as one of Africa’s leaders in financial inclusion, primarily driven by innovations in mobile banking and digital financial services.

Over time, the country has witnessed a steady decline in the number of financially excluded adults, from 41.3% in 2006 to just 9.9% in 2024. This progress reflects deliberate policy efforts, technological adoption, and the success of platforms like M-Pesa, which have helped bridge the gap between traditional banking and informal systems. By making financial services more accessible and secure, Kenya has demonstrated how innovation can drive inclusion even in developing economies.

Source:

2024 FinAccess Household Survey - Central Bank of Kenya

Period:

2006 - 2024
HTML code to embed chart
Want a bespoke report?
Reach out
Tags
Related Insights

Nearly a quarter (24.4%) of young adults (18–25 years) lack an ID document, a rate 12 times higher than that of any other age group
  • Nearly 1 in 4 young adults (18–25 years) in Kenya lack an ID document.
  • This rate (24.4%) is 12 times higher than that of any other adult age group.
  • ID ownership rises sharply after age 25, reaching over 98% across all older categories.
  • Adults aged 36–45 years and above 55 years show the highest ID possession rate at 98.5%.
  • Closing the ID gap among the youth is essential to advancing financial inclusion, employment access, and digital service uptake in Kenya.

Kenya’s financial inclusion gender gap fell sharply from 12.7 points in 2006 to 1.6 points in 2024
  • Kenya’s financial inclusion surged from 33.2% (men) and 20.5% (women) in 2006 to 85.7% and 84.1%, respectively, in 2024.
  • The gender gap in financial access has nearly disappeared, shrinking from 12.7 percentage points in 2006 to just 1.6 points in 2024.
  • Women’s financial inclusion grew faster, closing the gap primarily between 2009 and 2016, a period marked by mobile money expansion.
  • Digital finance has been a major driver, with mobile banking and fintech solutions providing easier and safer access to financial services.

Adults aged 26-45 years demonstrate the highest formal financial access in Kenya, with inclusion rate surpassing 92% in 2024
  • Adults aged 26–35 years have the highest formal financial access in Kenya at 92.9%.
  • The 36–45 age group follows closely with 92.7% formal inclusion, highlighting strong access among the middle-aged population.
  • Young adults (18–25 years) remain the most financially excluded group, with 23.1% still outside the financial system.
  • Older adults (above 55 years) also show weaker inclusion, with 84.1% formal access and 9.7% exclusion.
  • Informal access remains relatively low across all age groups, signalling the dominance of formal channels.

Over 60% of Nigerians use crypto for savings and long-term investing
  • Wealth-building dominates motivation: 45.4% cite “active wealth building” as their primary motive, and an additional 21.8% cite “long-term financial security”.
  • Payments and utility are minor drivers: Only 3.3% report “daily utility” and 2.2% “digital commerce” as their chief motive for using crypto.
  • Hedging and cross-border flows matter: 8.7% use crypto for currency hedging, and 4.1% for cross-border payments, showing a dual role of investment plus international value flows.
  • Nigerian retail users treat crypto like a conventional financial instrument rather than only as a means of payment or speculation.

Over 65% of surveyed Nigerian crypto users transact below ₦50,000; less than 3% move above ₦1 million
  • Nearly two-thirds (67%) of all crypto transactions in Nigeria are below ₦50,000, reflecting widespread use among everyday retail users.
  • The ₦15,000–₦25,000 band (28.2%) is the single largest group, showing consistent, small-scale engagement rather than high-value speculation.
  • Around 25% of users transact between ₦50,000 and ₦250,000, suggesting a growing middle class of more confident, mid-level investors.
  • Less than 3% of users transact above ₦1 million, confirming that Nigeria’s crypto market remains primarily retail-driven, not institutional or high-net-worth.

67.2% of active crypto users use cryptocurrency primarily for investment
  • A majority (67.2%) of Nigerian crypto users (17.7 million people) use digital assets mainly for investment and long-term financial growth.
  • Overall, 26.34 million Nigerians—over one in eight adults—actively use or hold cryptocurrency, giving the country the highest adoption rate globally.
  • About 18.4% (4.8 million) use crypto for everyday needs such as remittances, payments, and inflation protection.
  • 14.4% (3.8 million) identify as active traders, providing liquidity and earning income through market participation.

POPULAR TOPICS
SIGN UP TO OUR NEWSLETTER
Get periodic updates about the African startup space, access to our reports, among others.
Subscribe Here
Subscription Form

A product of Techpoint Africa. All rights reserved