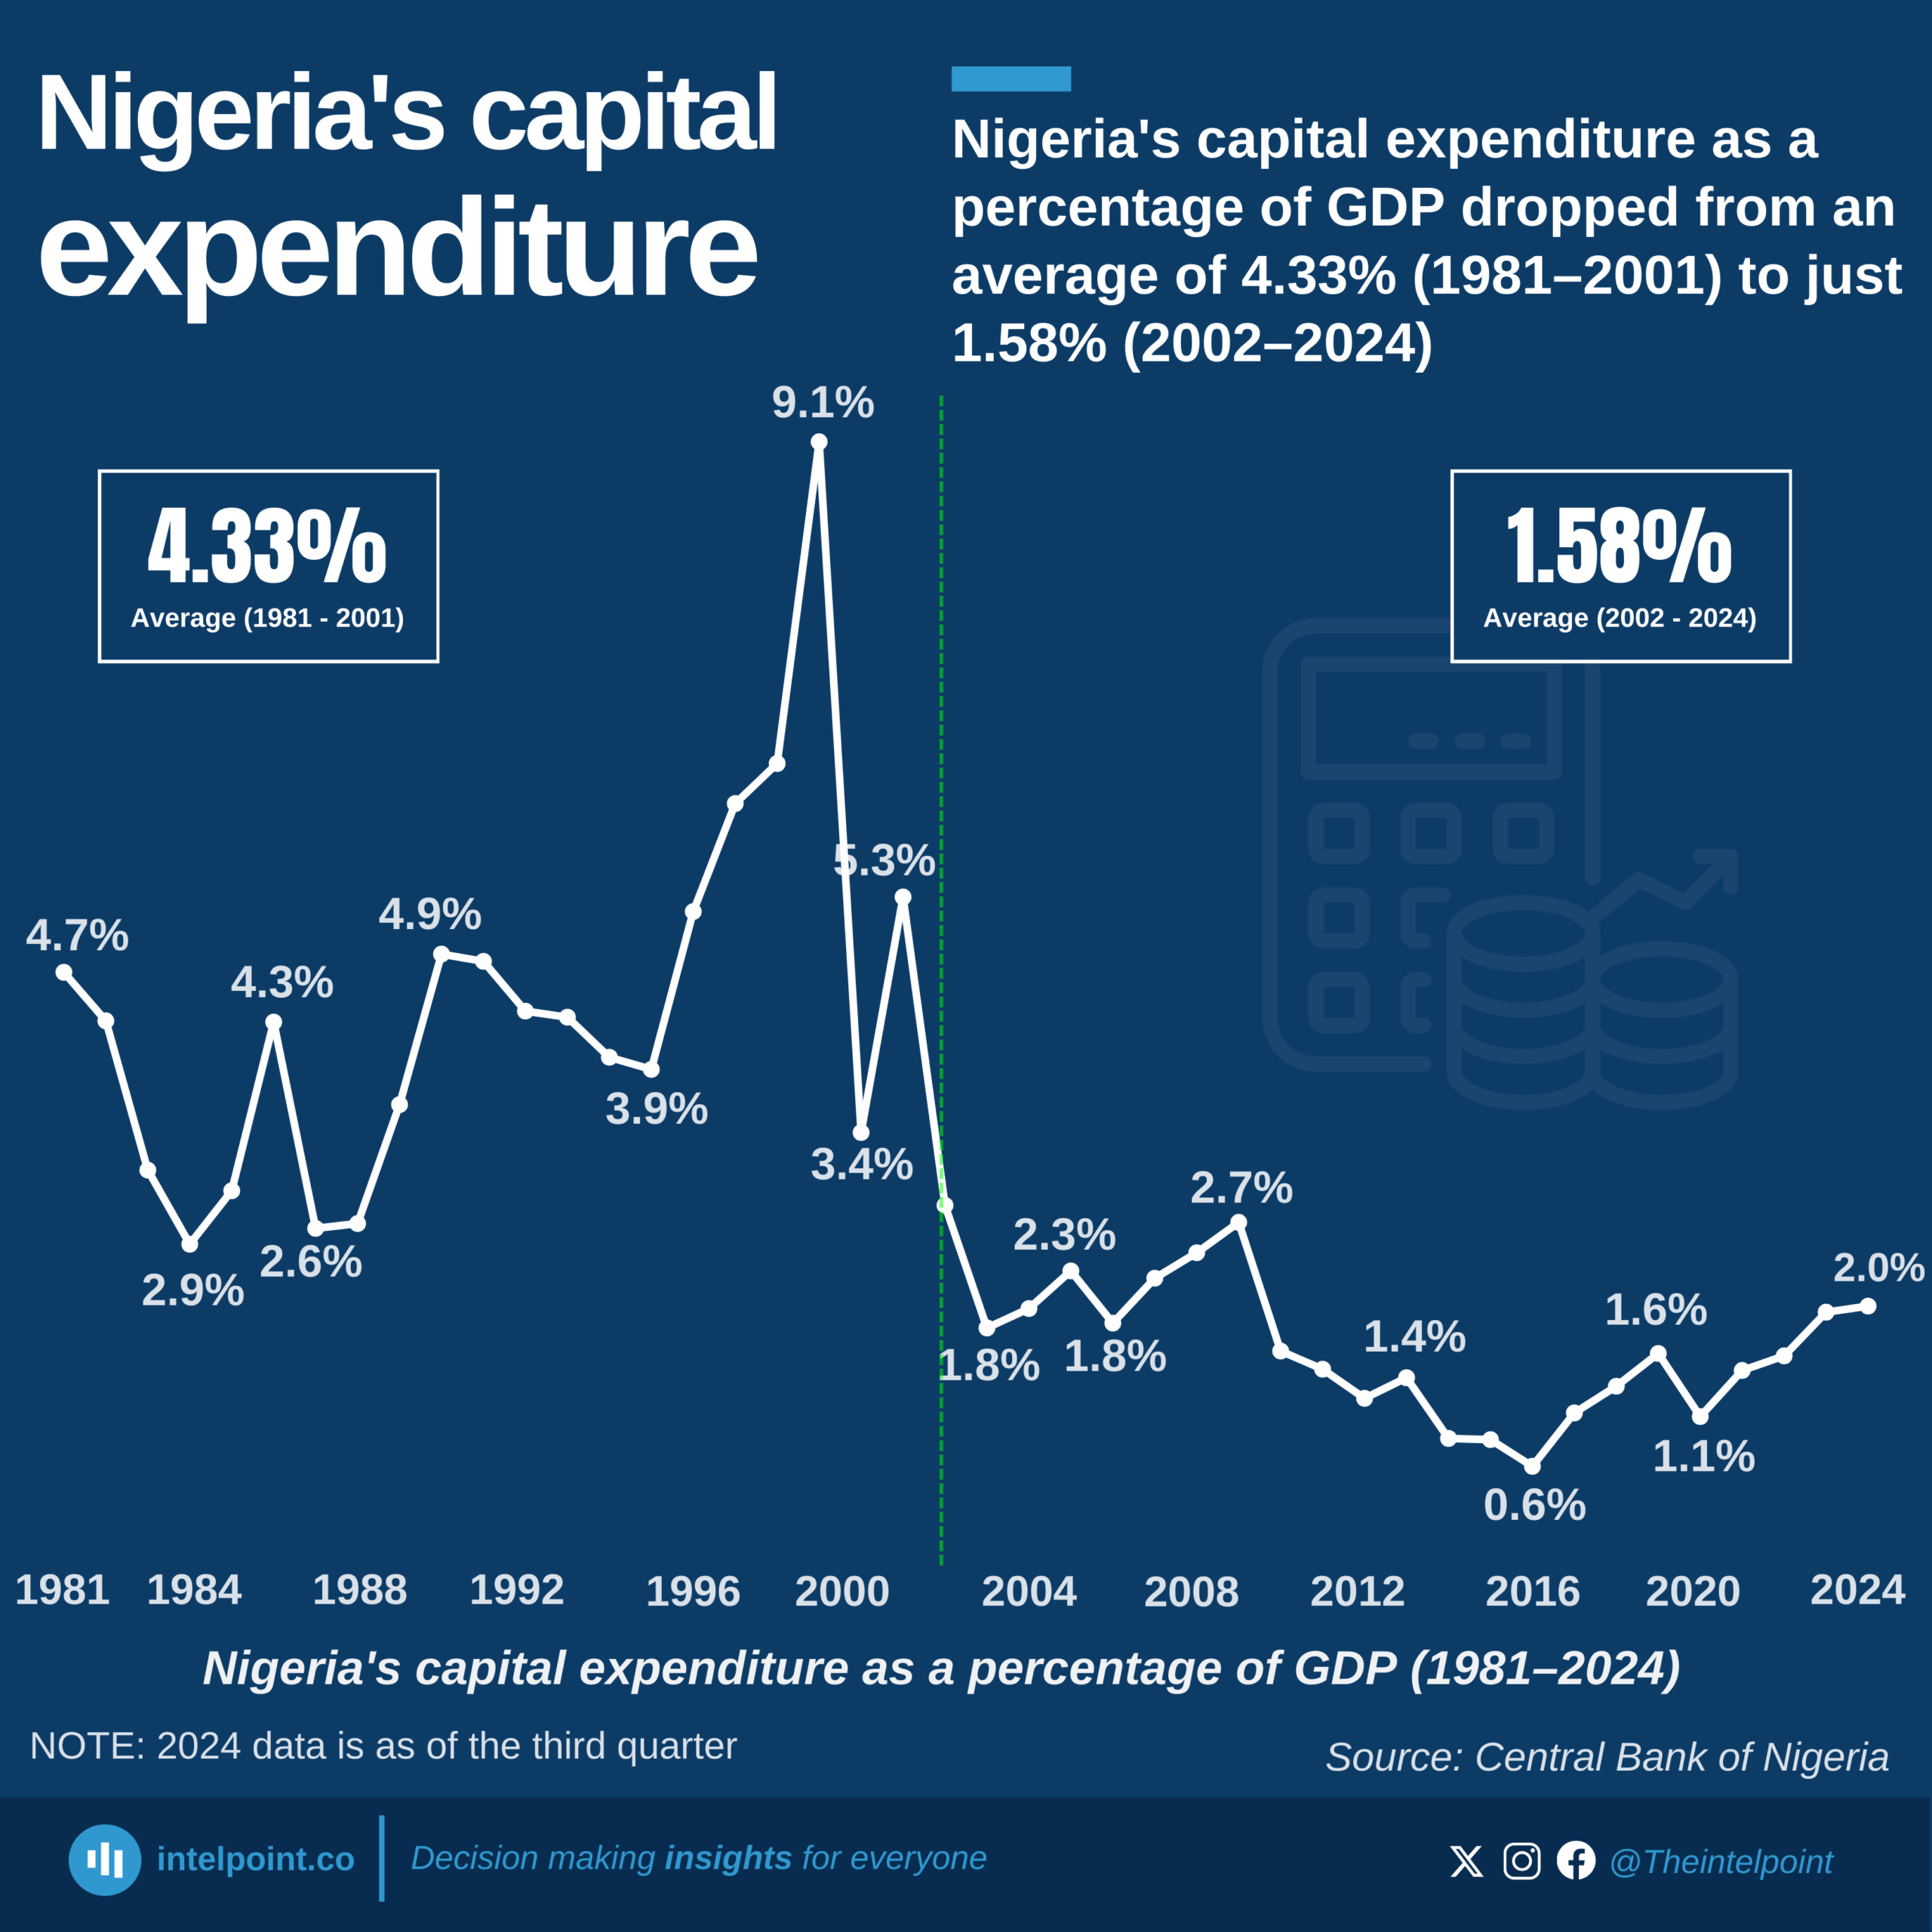
Nigeria's capital expenditure as a percentage of GDP dropped from an average of 4.33% (1981–2001) to just 1.58% (2002–2024)

Key takeaways:

  • From an average of 4.33% in 1981–2001 to just 1.58% in 2002–2024, Nigeria’s capital expenditure as a percentage of GDP has more than halved.
  • The early 2000s marked a major turning point. After peaking at 9.1% in 1999, capital spending nosedived, rarely surpassing 2% in the last two decades.
  • Recent figures show Nigeria’s capital expenditure hovering around 1–2% of GDP.
  • The data suggests a move away from infrastructure investments, potentially prioritising recurrent expenditure such as salaries and overheads.
  • Low capital spending can slow infrastructure development, limiting productivity, economic expansion, and foreign investment attractiveness.
  • If Nigeria is to achieve sustainable growth, there needs to be a renewed focus on capital investments to drive industrialisation, improve public services, and create jobs.

Nigeria’s capital expenditure as a percentage of GDP has seen a significant decline over the past two decades, dropping from an average of 4.33% (1981–2001) to just 1.58% (2002–2024). The data reveals a clear shift in government spending priorities, with capital investments taking a backseat despite the country’s growing infrastructure and development needs.
This drop is even more concerning when compared to historical peaks. Capital spending once hit 9.1% of GDP in 1999, but in recent years, it has struggled to cross 2%. The decline suggests that while Nigeria’s economy has expanded, public investments in critical infrastructure like roads, power, and healthcare have not kept pace. This raises crucial questions about the sustainability of economic growth in the absence of strong public sector investment.
Source:

Central Bank of Nigeria (CBN)

Period:

1981 - 2024
HTML code to embed chart
Want a bespoke report?
Reach out
Tags
Related Insights

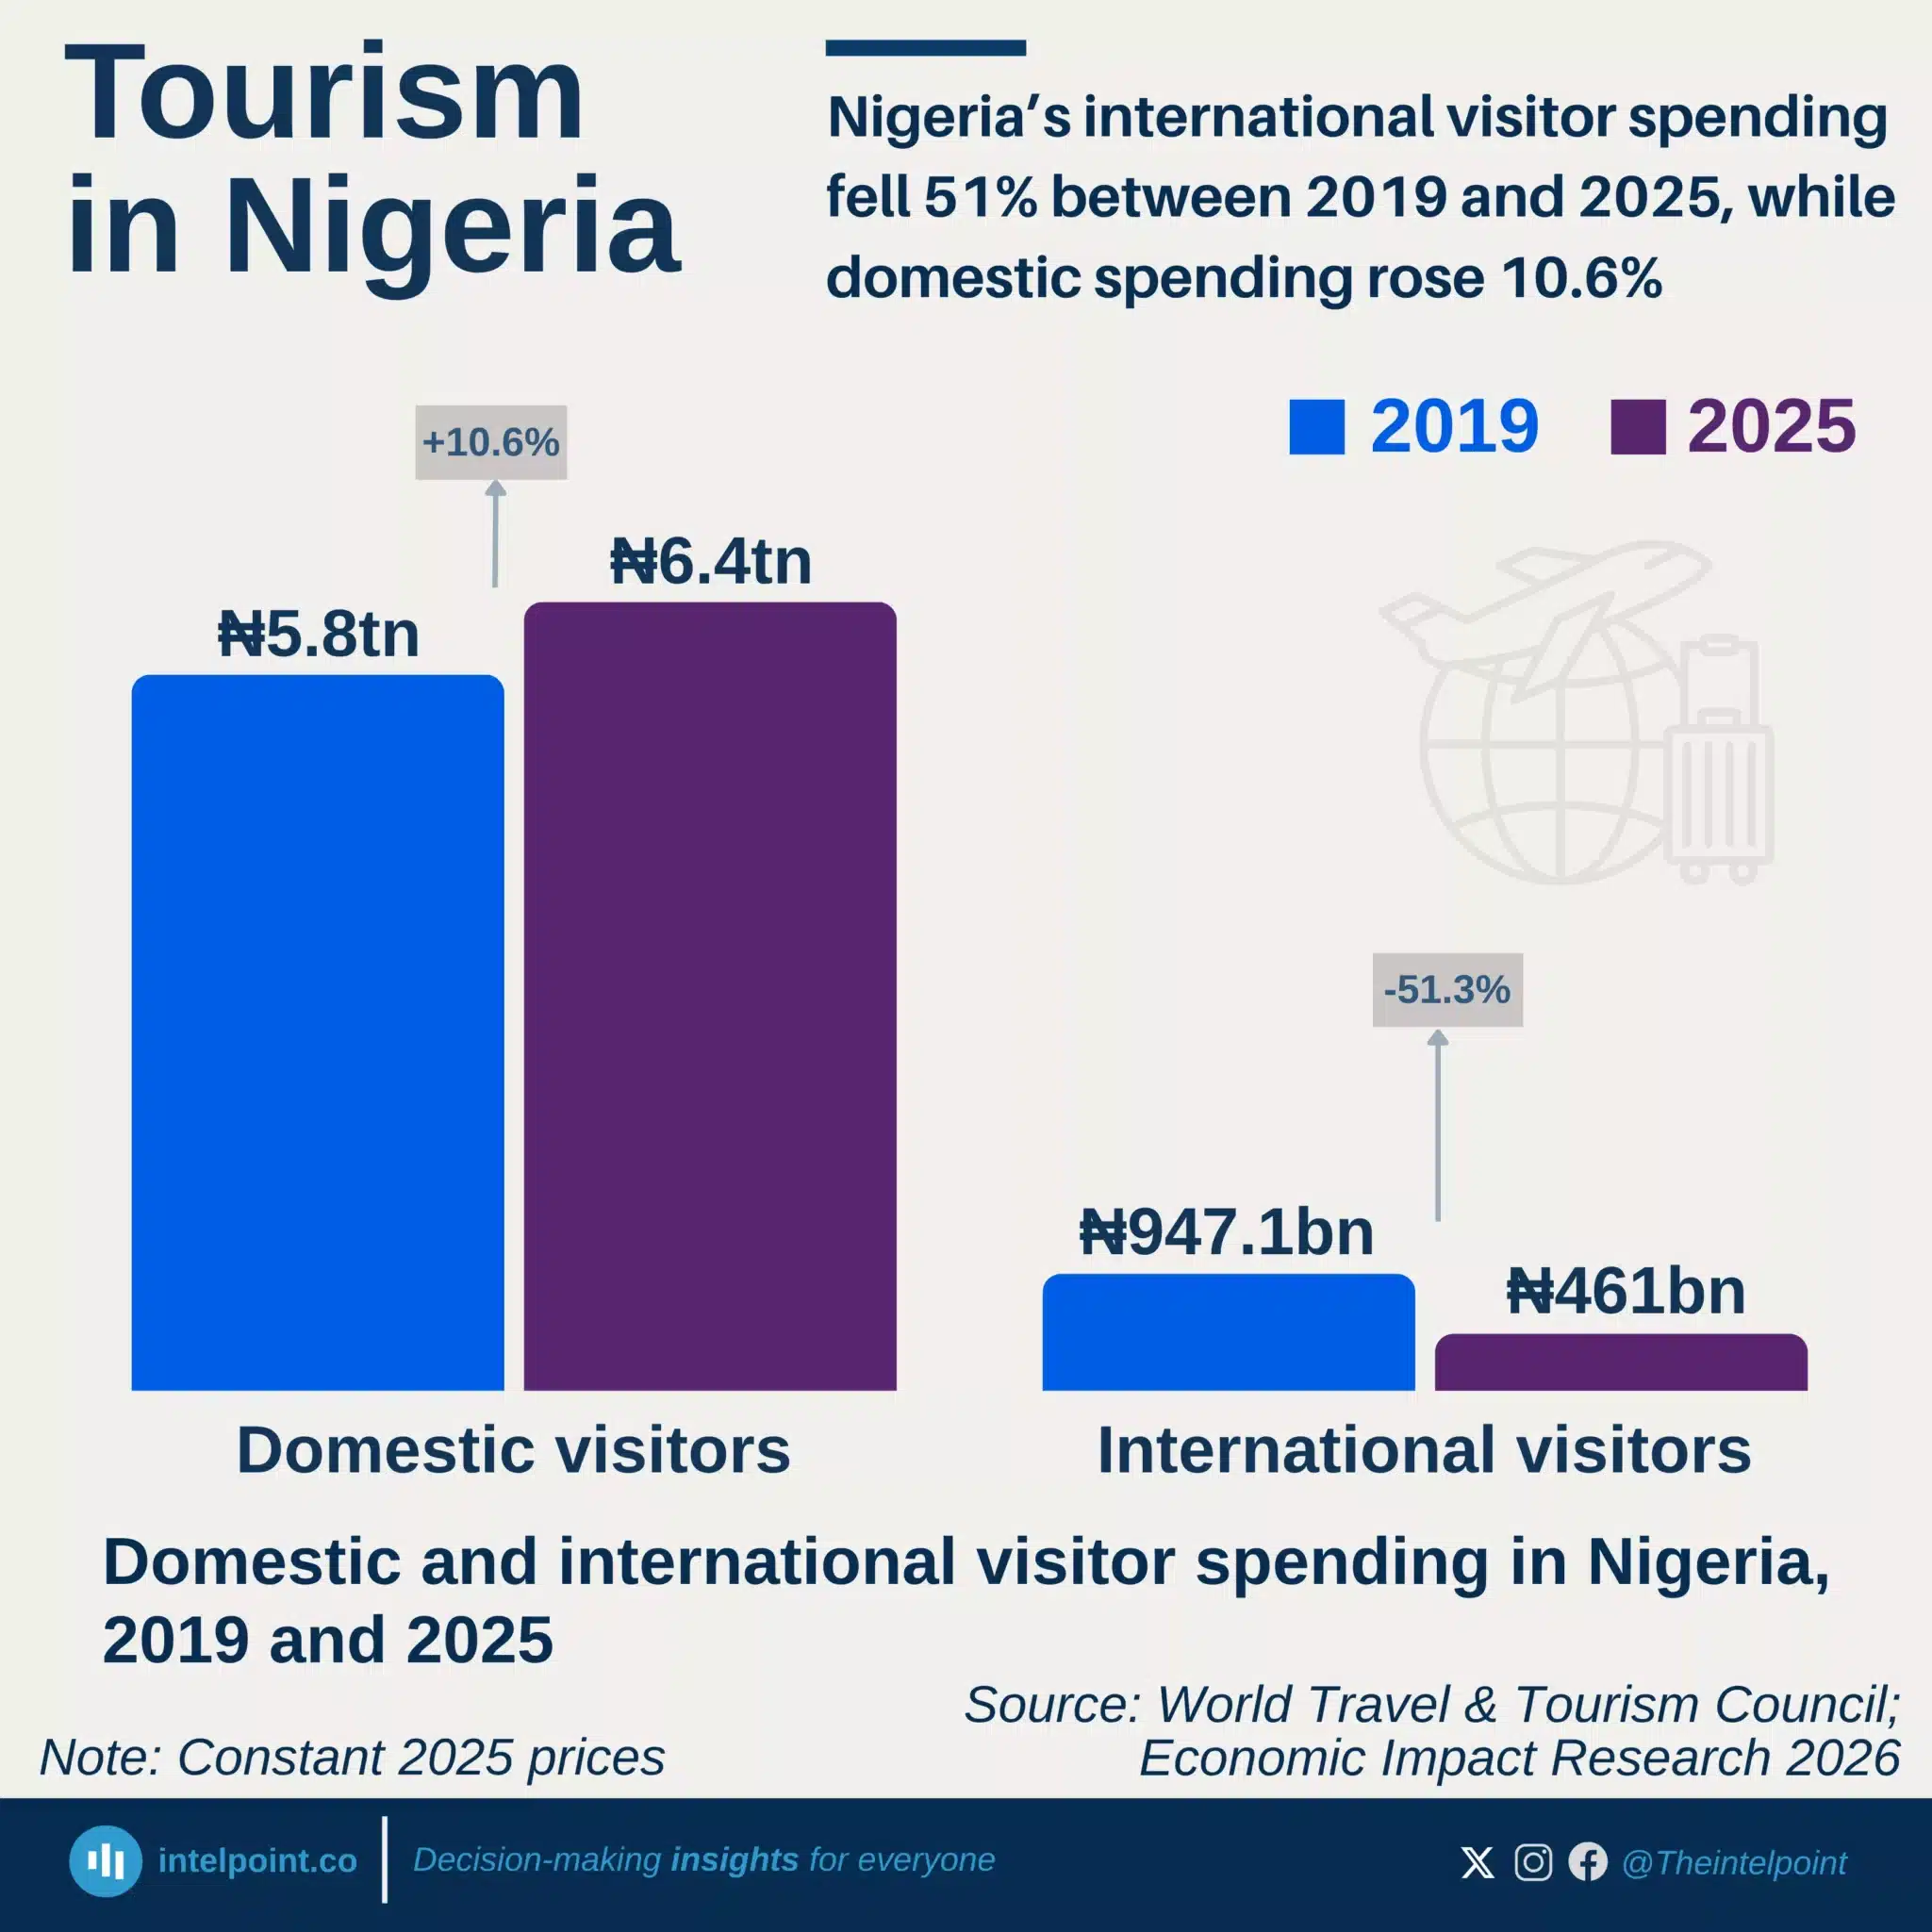
Nigeria’s international visitor spending fell 51% between 2019 and 2025, while domestic spending rose 10.6%
  • International visitor spending fell 51.3%, from ₦947.1 billion in 2019 to ₦461 billion in 2025.
  • For every ₦100 international visitors spent in 2019, they spent about ₦49 in 2025, adjusted for inflation.
  • International visitor spending declined for three consecutive years, falling 18.6% in 2025.
  • Domestic visitor spending rose 10.6% between 2019 and 2025 to ₦6.39 trillion.
  • Domestic visitors accounted for roughly ₦93 of every ₦100 spent on travel and tourism within Nigeria in 2025.

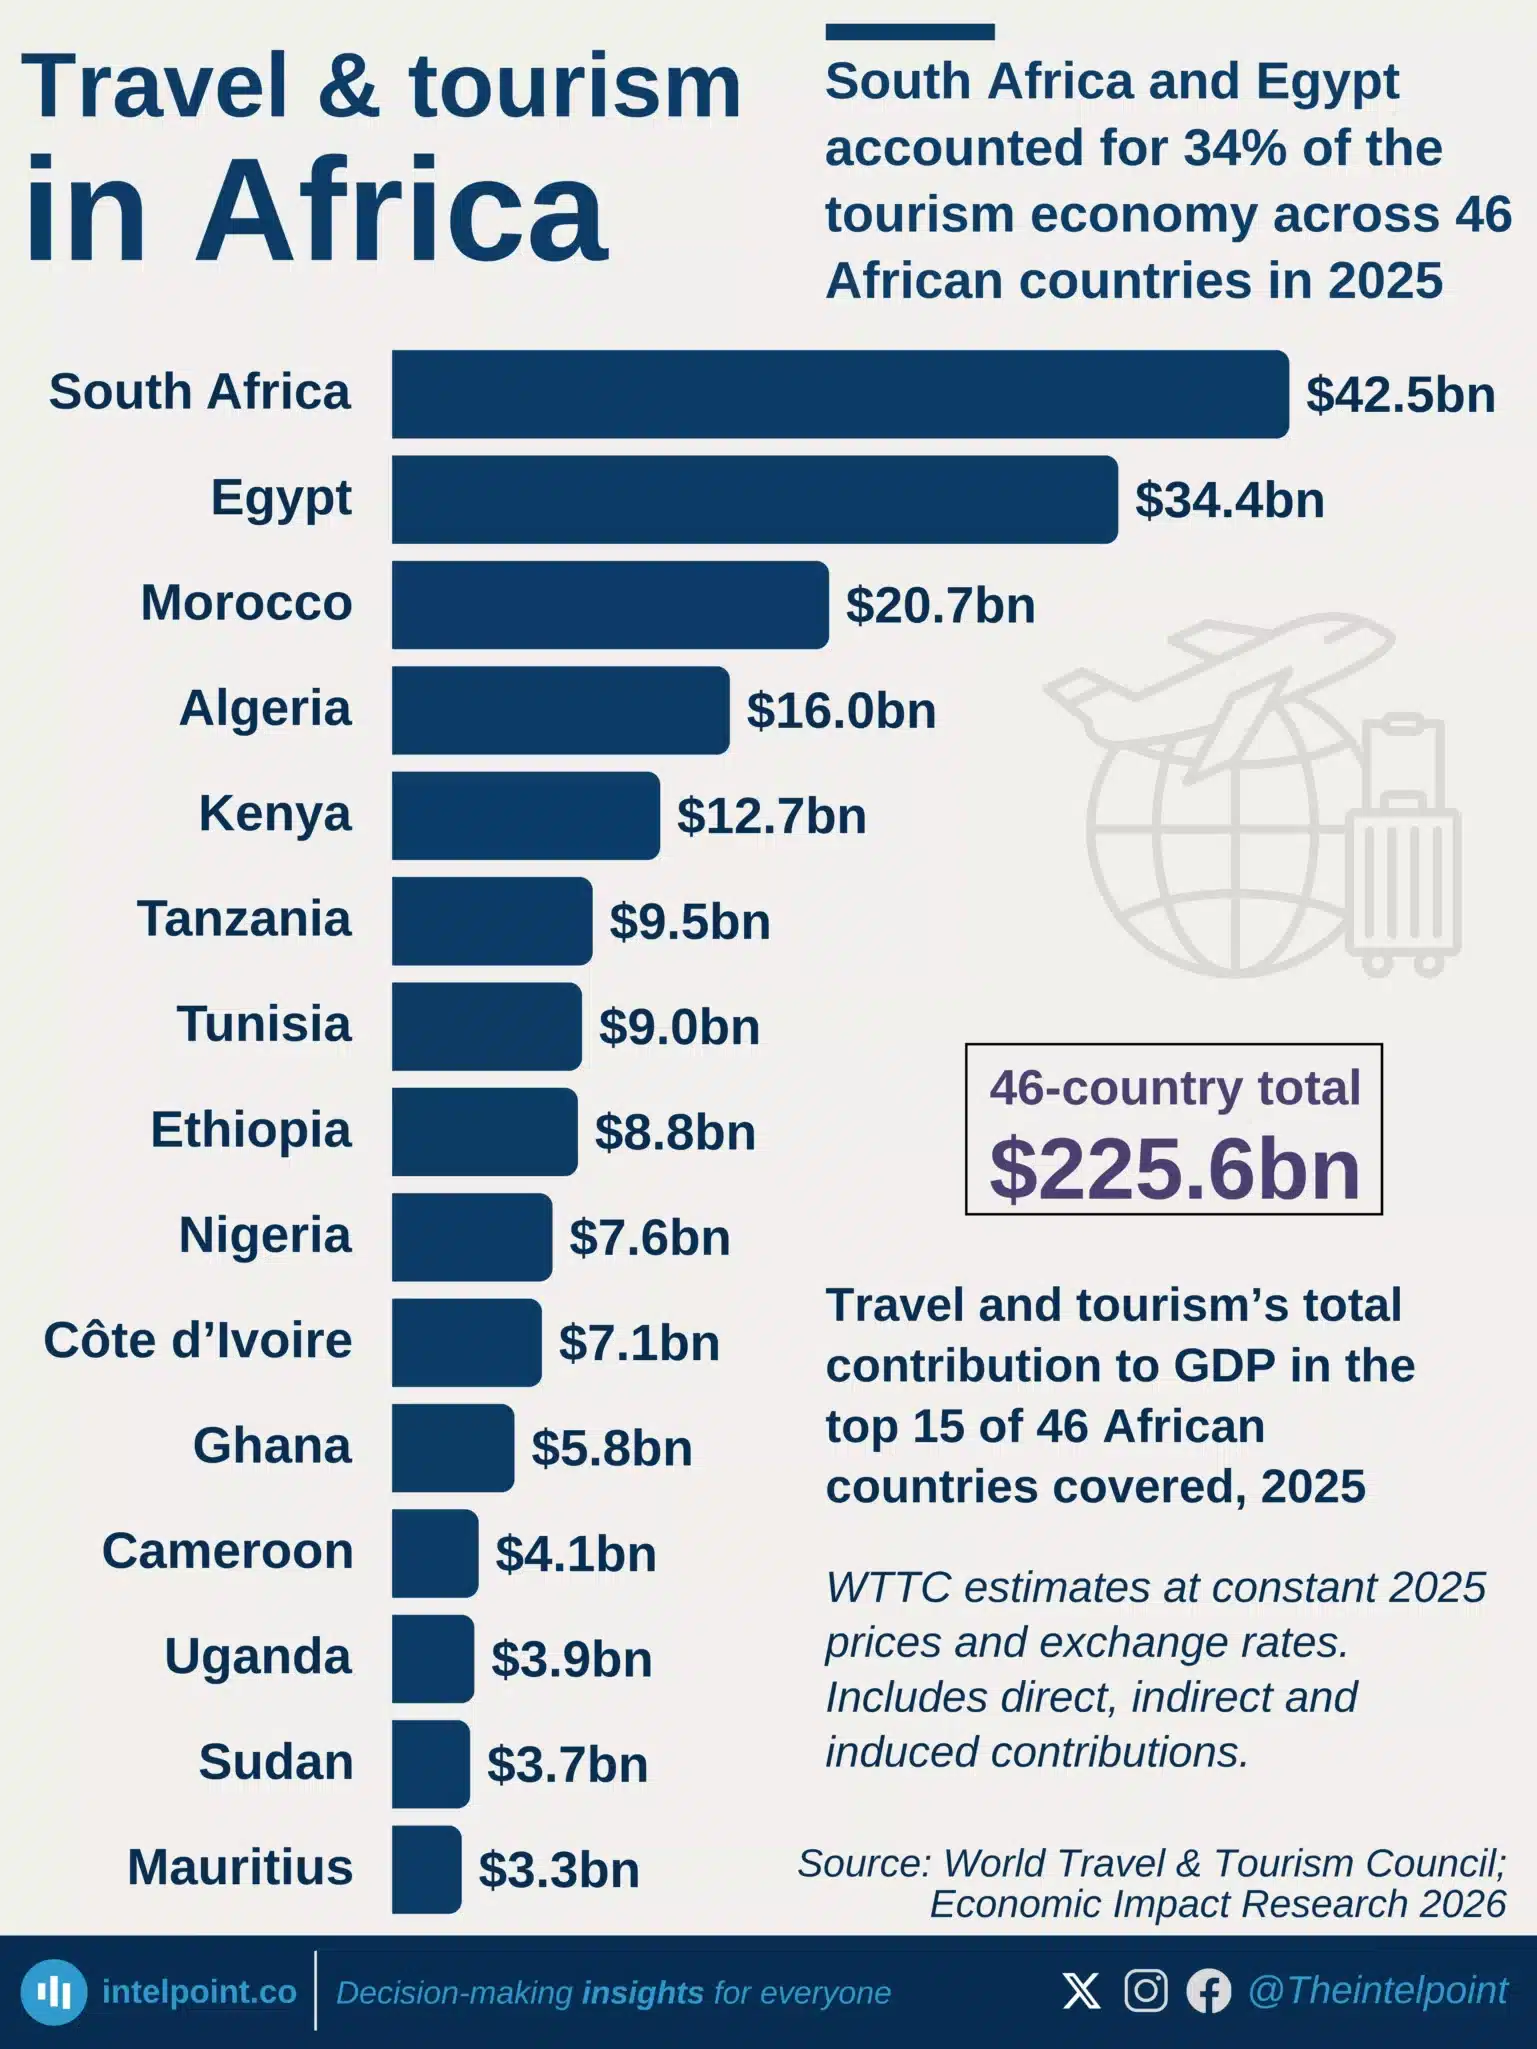
South Africa and Egypt accounted for 34% of the tourism economy across 46 African countries in 2025
  • South Africa and Egypt contributed $76.9 billion, roughly a third of the 46-country total.
  • South Africa led with $42.5 billion, followed by Egypt at $34.4 billion.
  • The top four countries accounted for slightly more than half of the $225.6 billion total.
  • Nigeria ranked ninth among the countries covered, with $7.6 billion.
  • Nigeria had the largest contribution among the West African countries included.

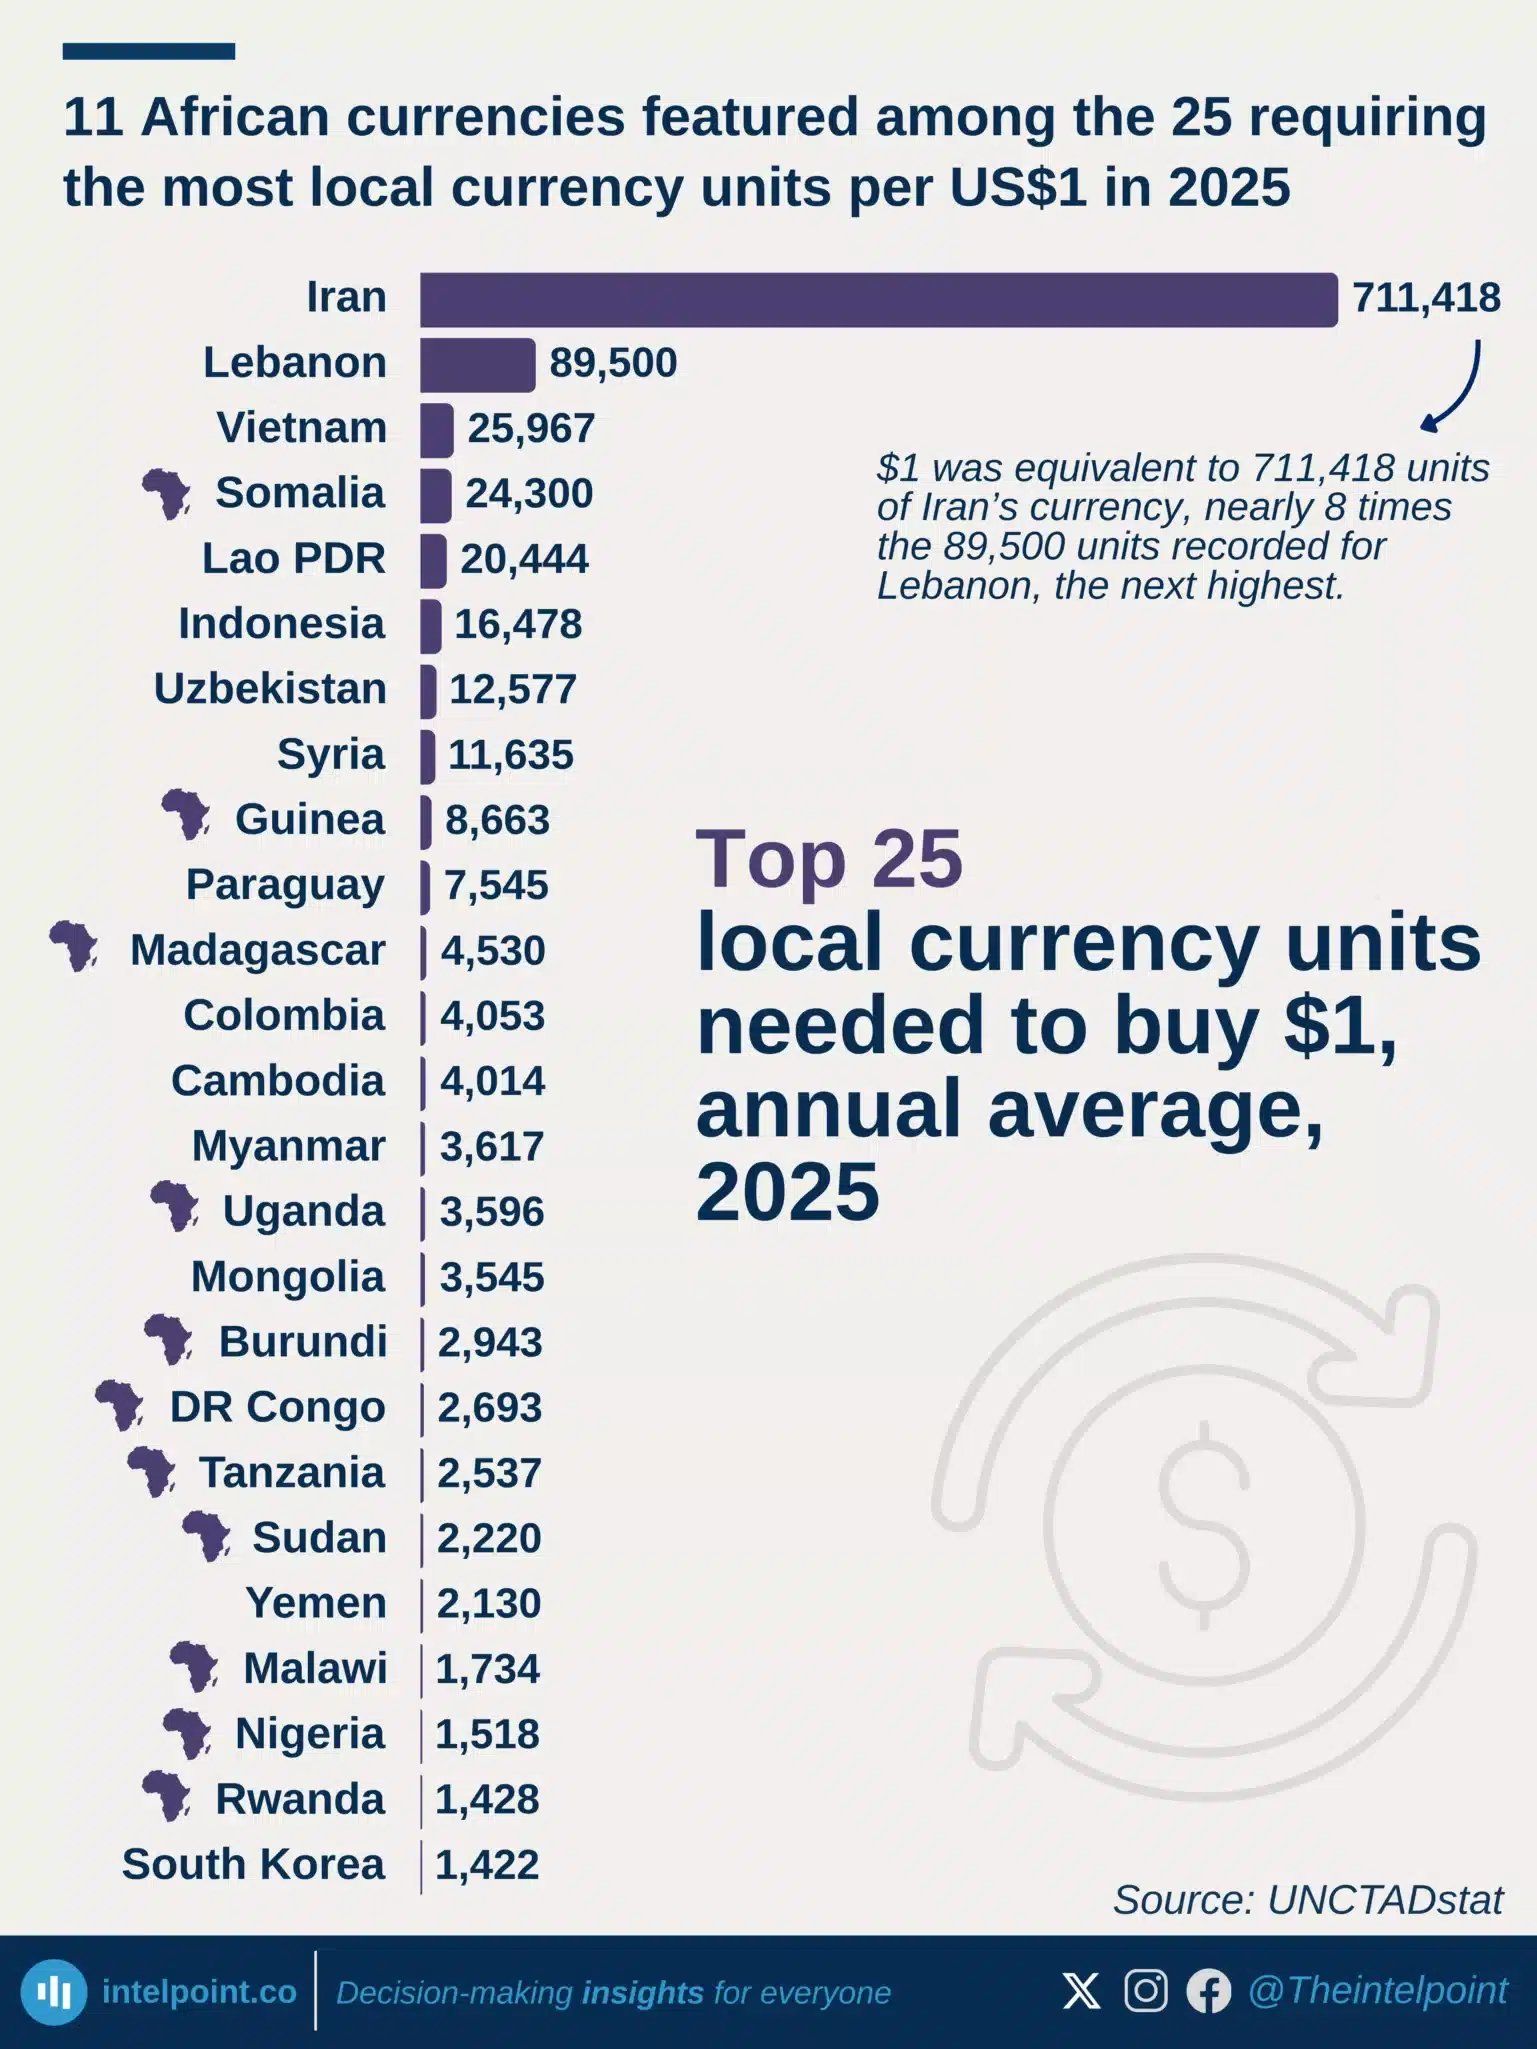
11 African currencies featured among the 25 requiring the most local currency units per US$1 in 2025
  • 11 African currencies featured among the 25 listed.
  • Somalia had the highest exchange rate among the African currencies highlighted, at 24,300 shillings per US$1.
  • Nigeria’s naira averaged ₦1,518 per US$1 in 2025.
  • 7 of the 11 African countries were in Eastern Africa, based on the UN M49 subregional classification.
  • Iran was the global outlier, averaging 711,418 rials per US$1, nearly eight times Lebanon’s 89,500.

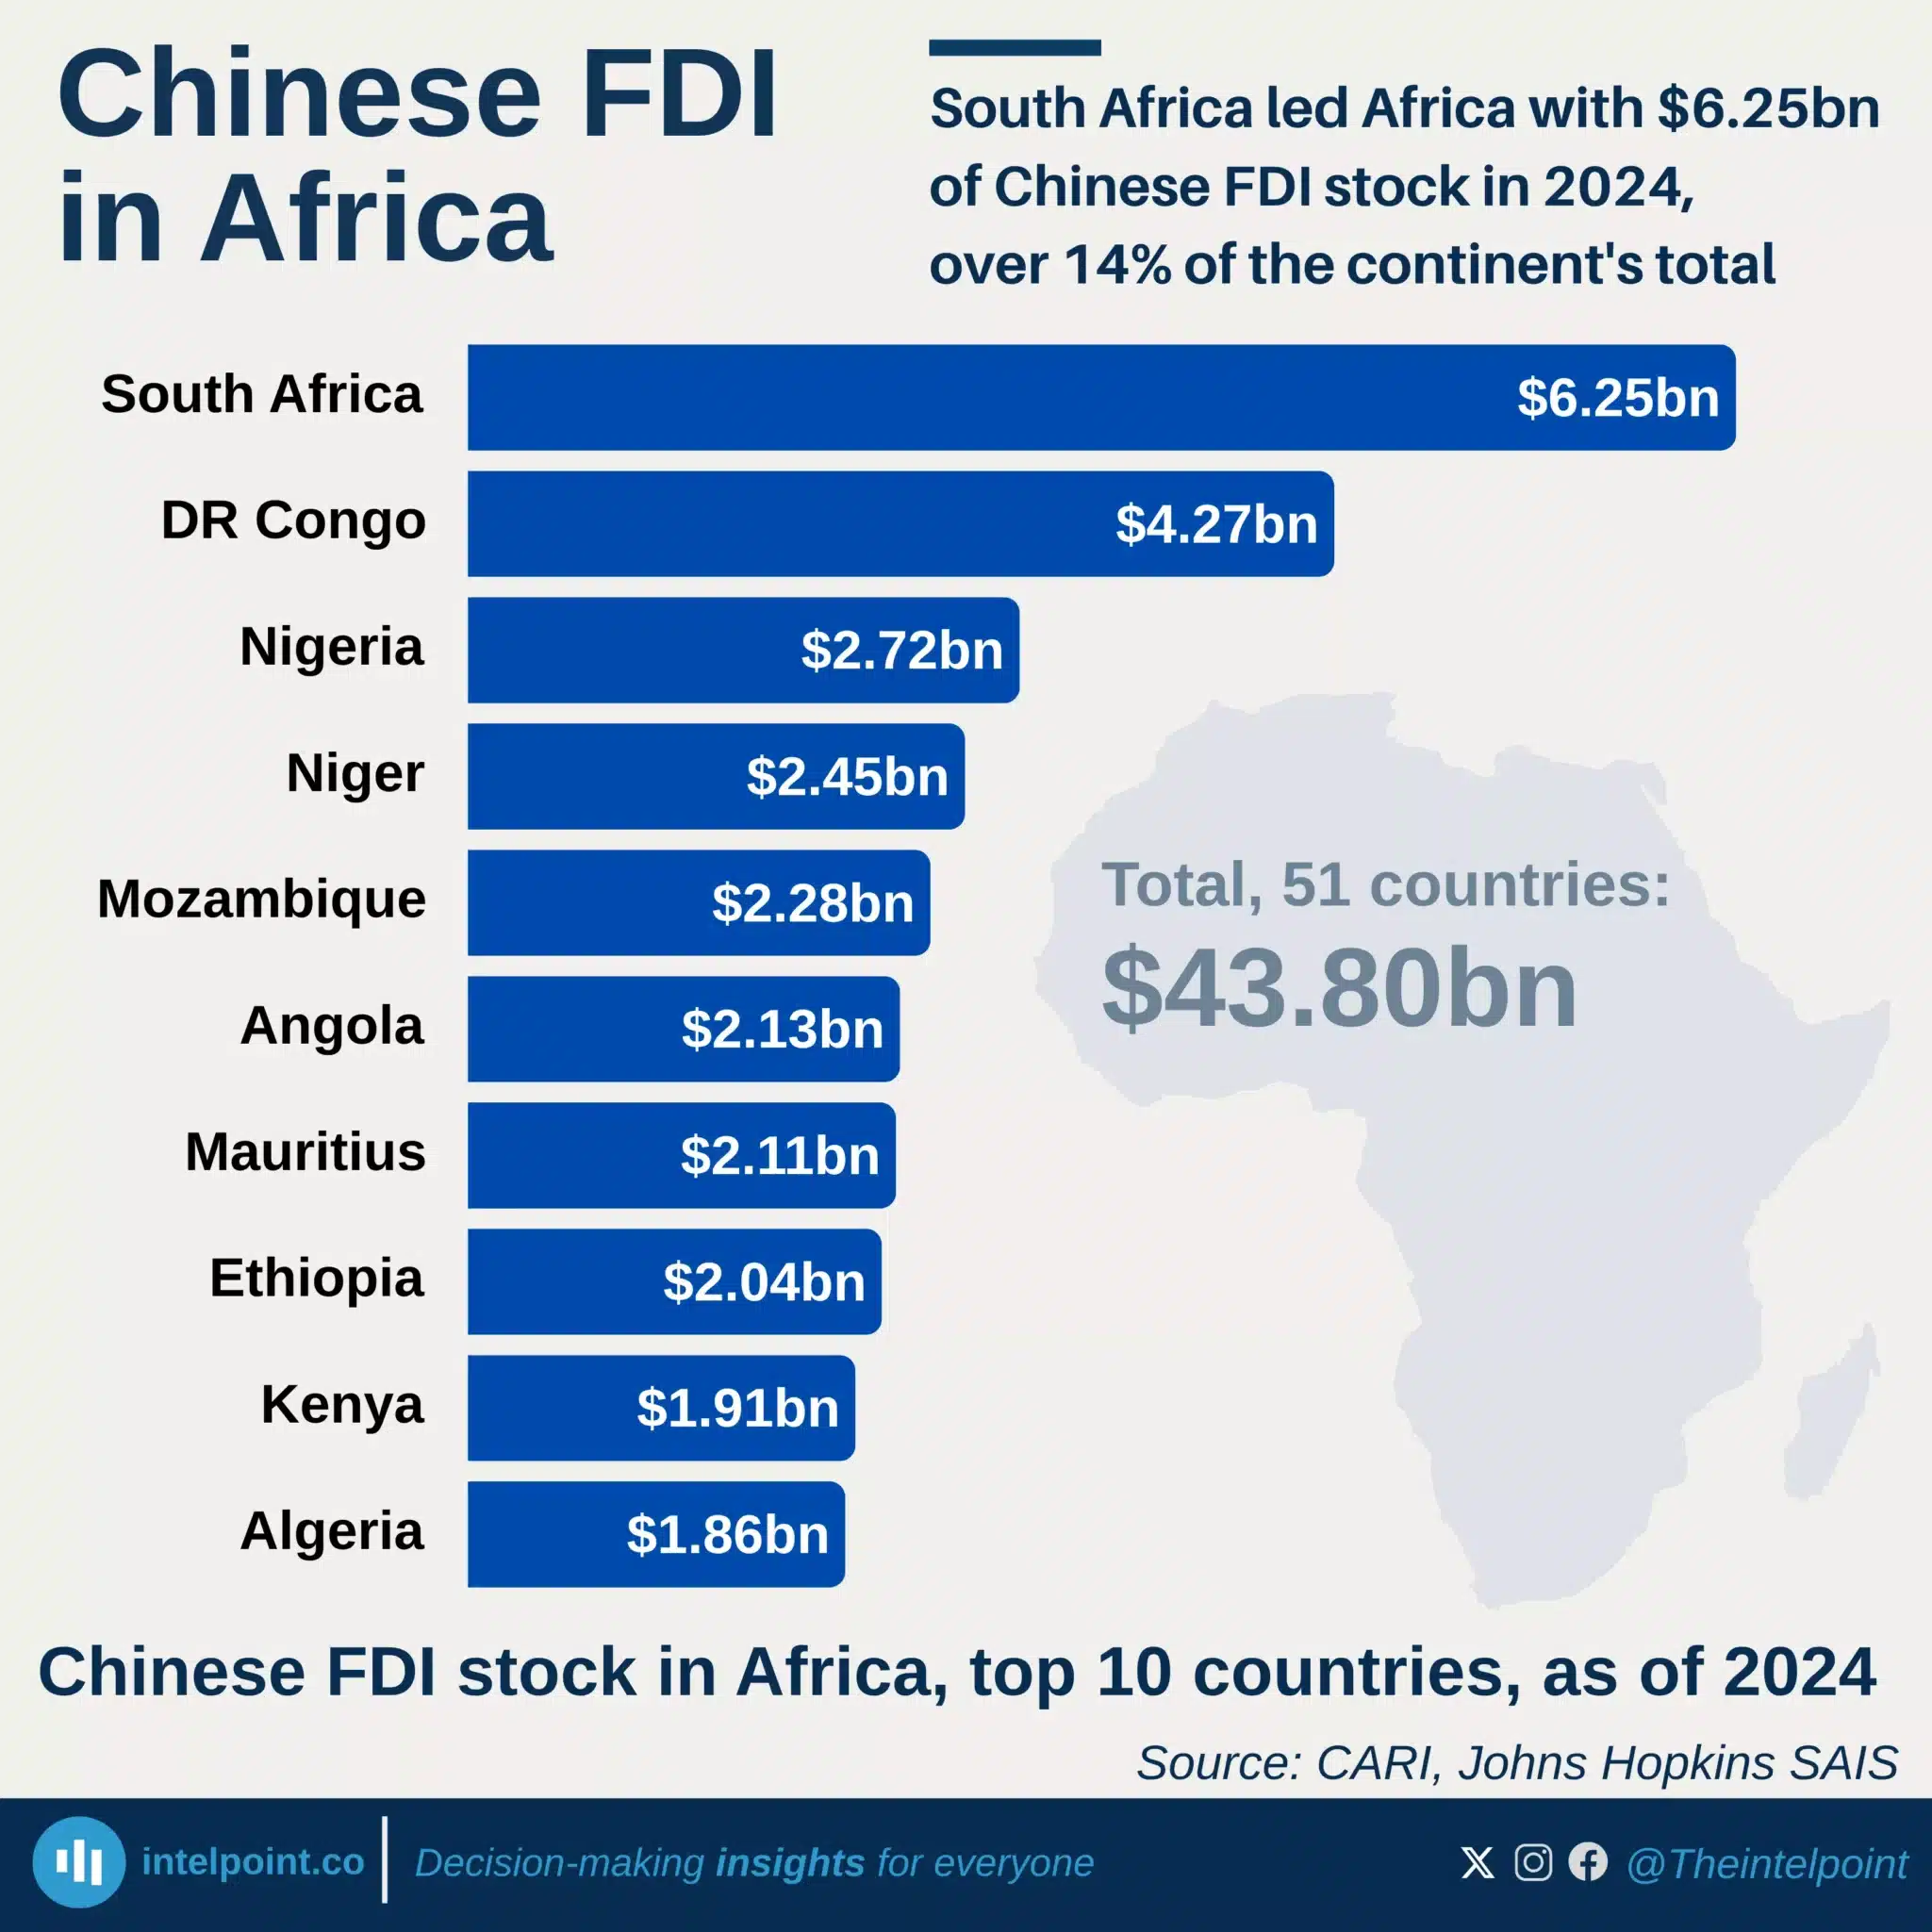
South Africa led Africa with $6.25bn of Chinese FDI stock in 2024, over 14% of the continent's total
  • South Africa held the largest Chinese FDI stock in Africa at $6.25 billion in 2024.
  • South Africa, DR Congo and Nigeria held 30% of Africa’s Chinese FDI stock.
  • The top 10 countries accounted for 64% of the continent’s total Chinese FDI stock.
  • Niger led the remaining top 10 countries with $2.45 billion, followed by Mozambique at $2.28 billion.

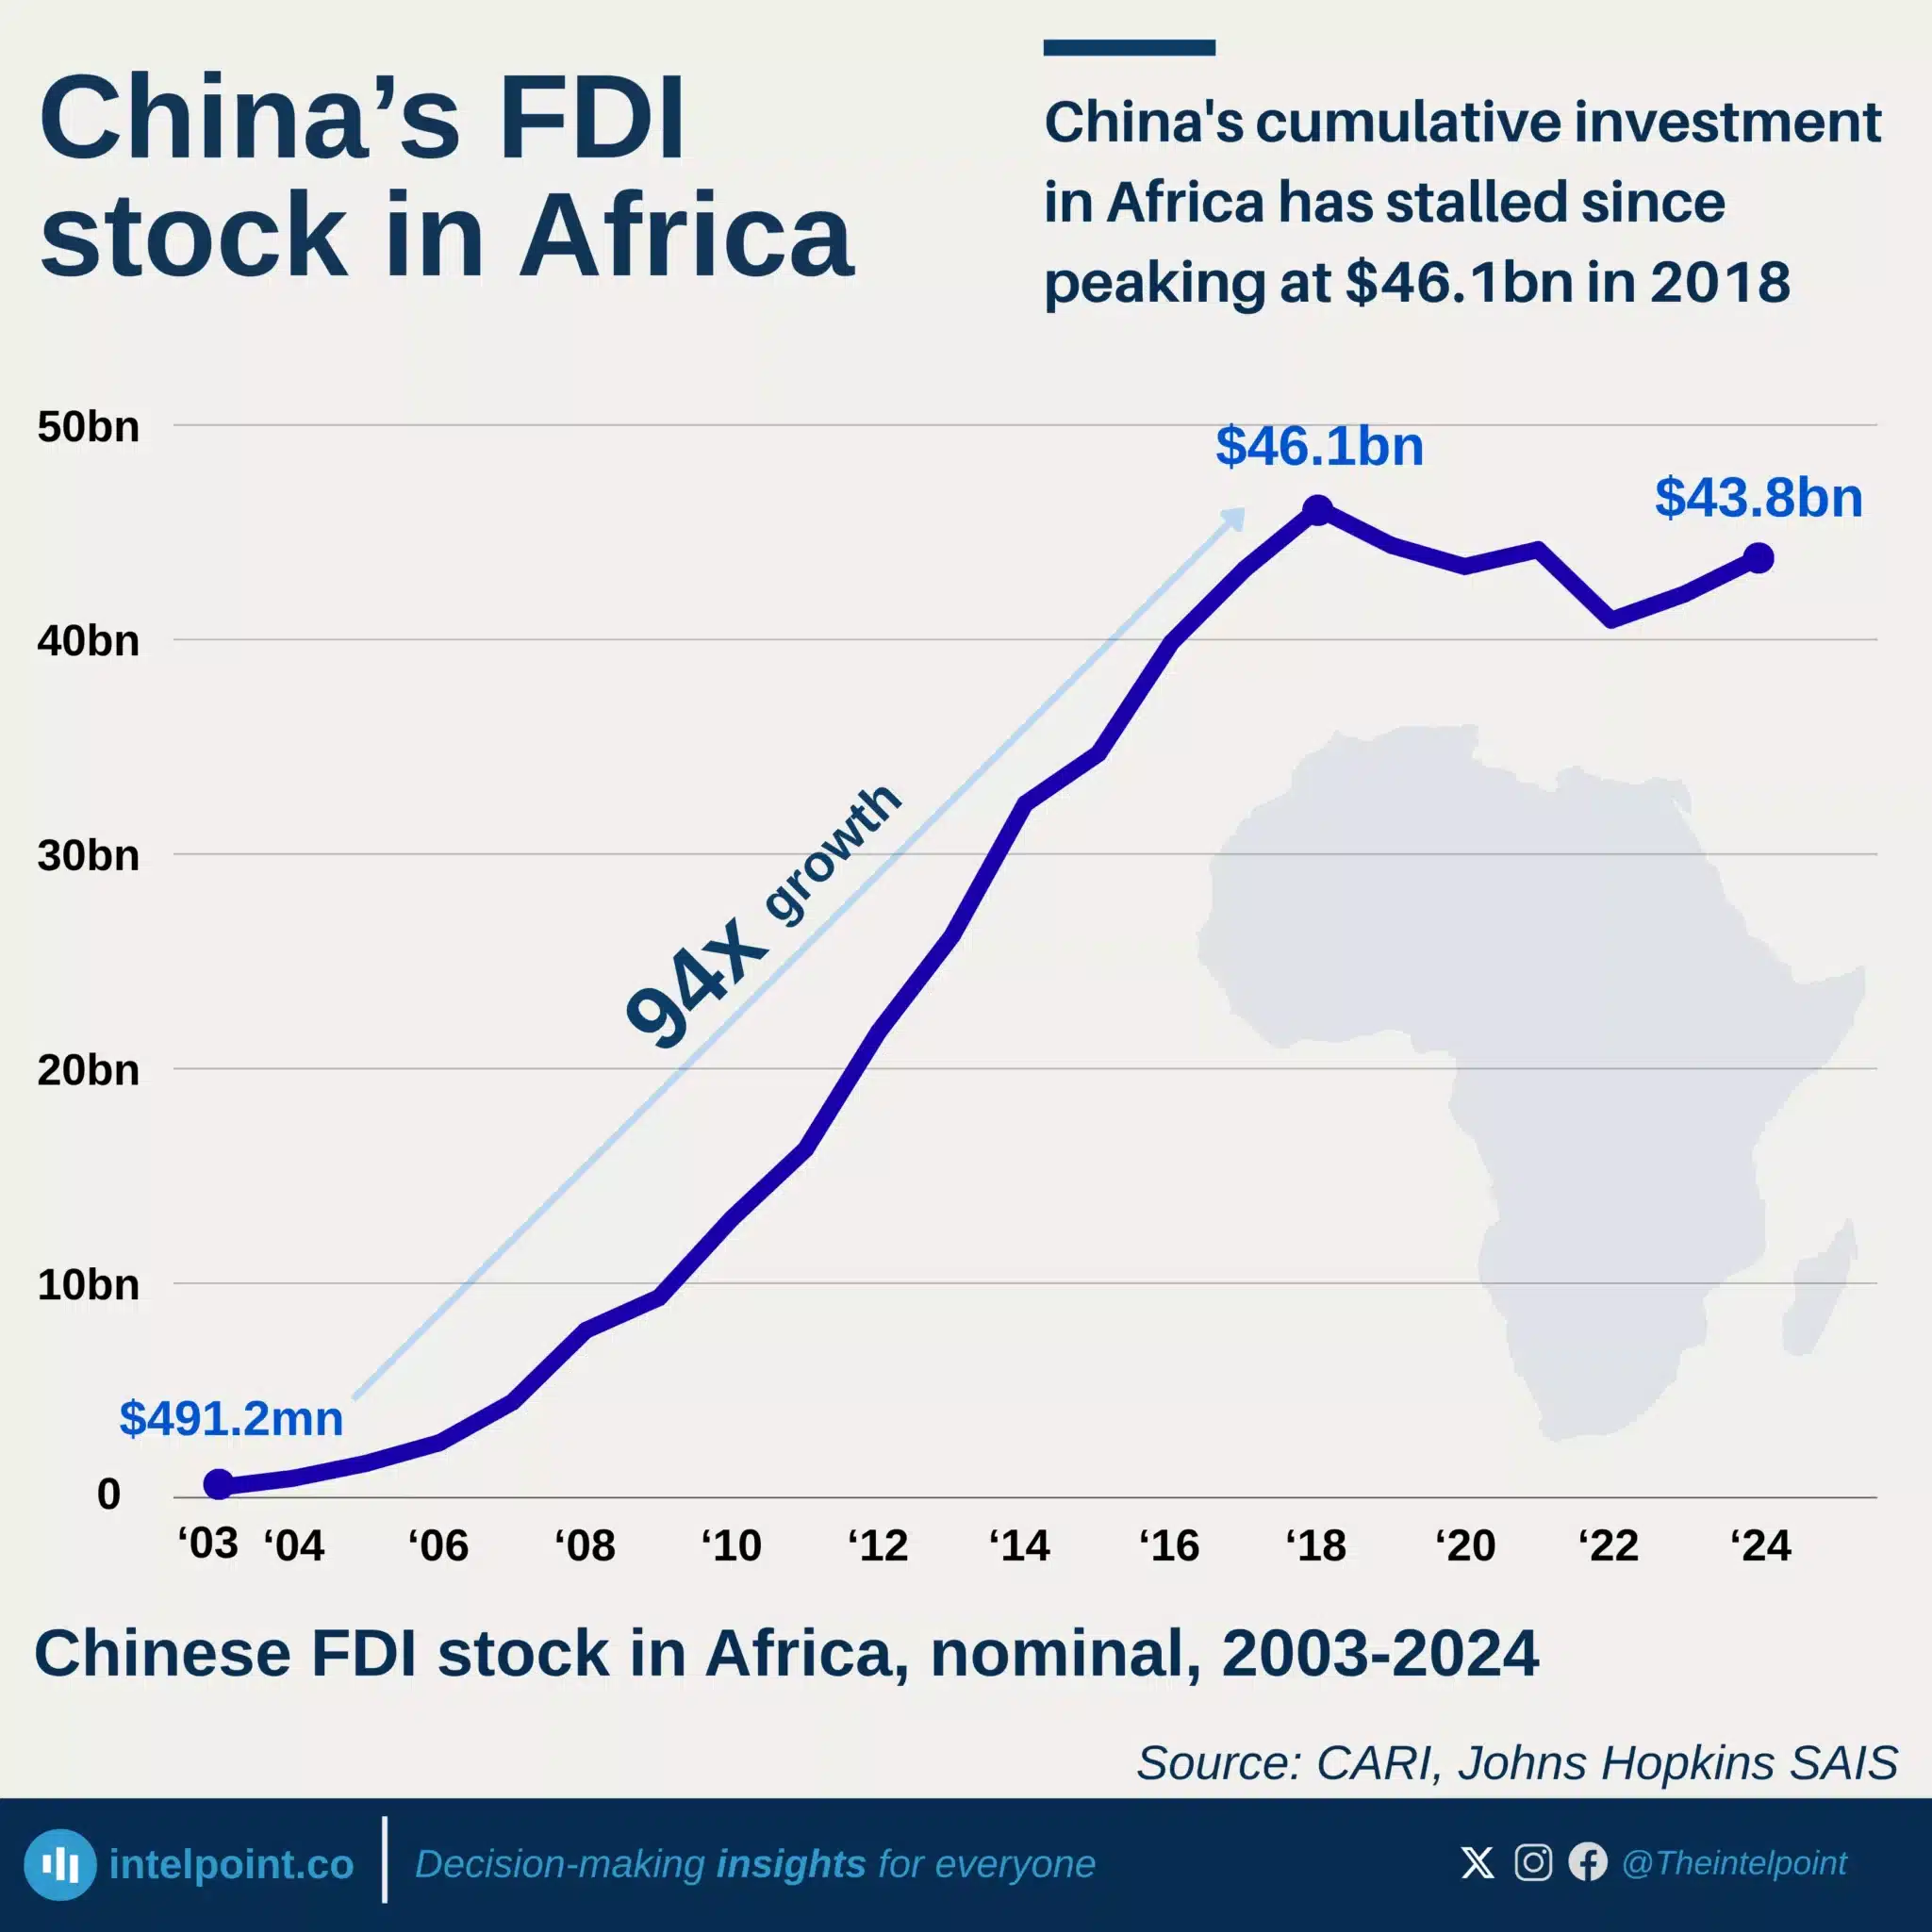
China's cumulative investment in Africa has stalled since peaking at $46.1bn in 2018
  • China's FDI stock in Africa rose 94-fold, from $491 million in 2003 to $46.1 billion in 2018.
  • By 2024, the stock had recovered to $43.8 billion, still 5% below its 2018 peak.
  • Africa accounted for just 1.4% of China's $3.14 trillion global FDI stock in 2024.
  • Nigeria's Chinese FDI stock fell from a 2017 peak of $2.86 billion to $2.72 billion in 2024.
  • African countries recorded a net $2.31 billion decline in Chinese FDI stock between 2018 and 2024.
  • Niger recorded the largest increase, from $758 million in 2018 to $2.45 billion in 2024.
  • Zambia recorded the largest decline, from $3.52 billion in 2018 to $1.70 billion in 2024.

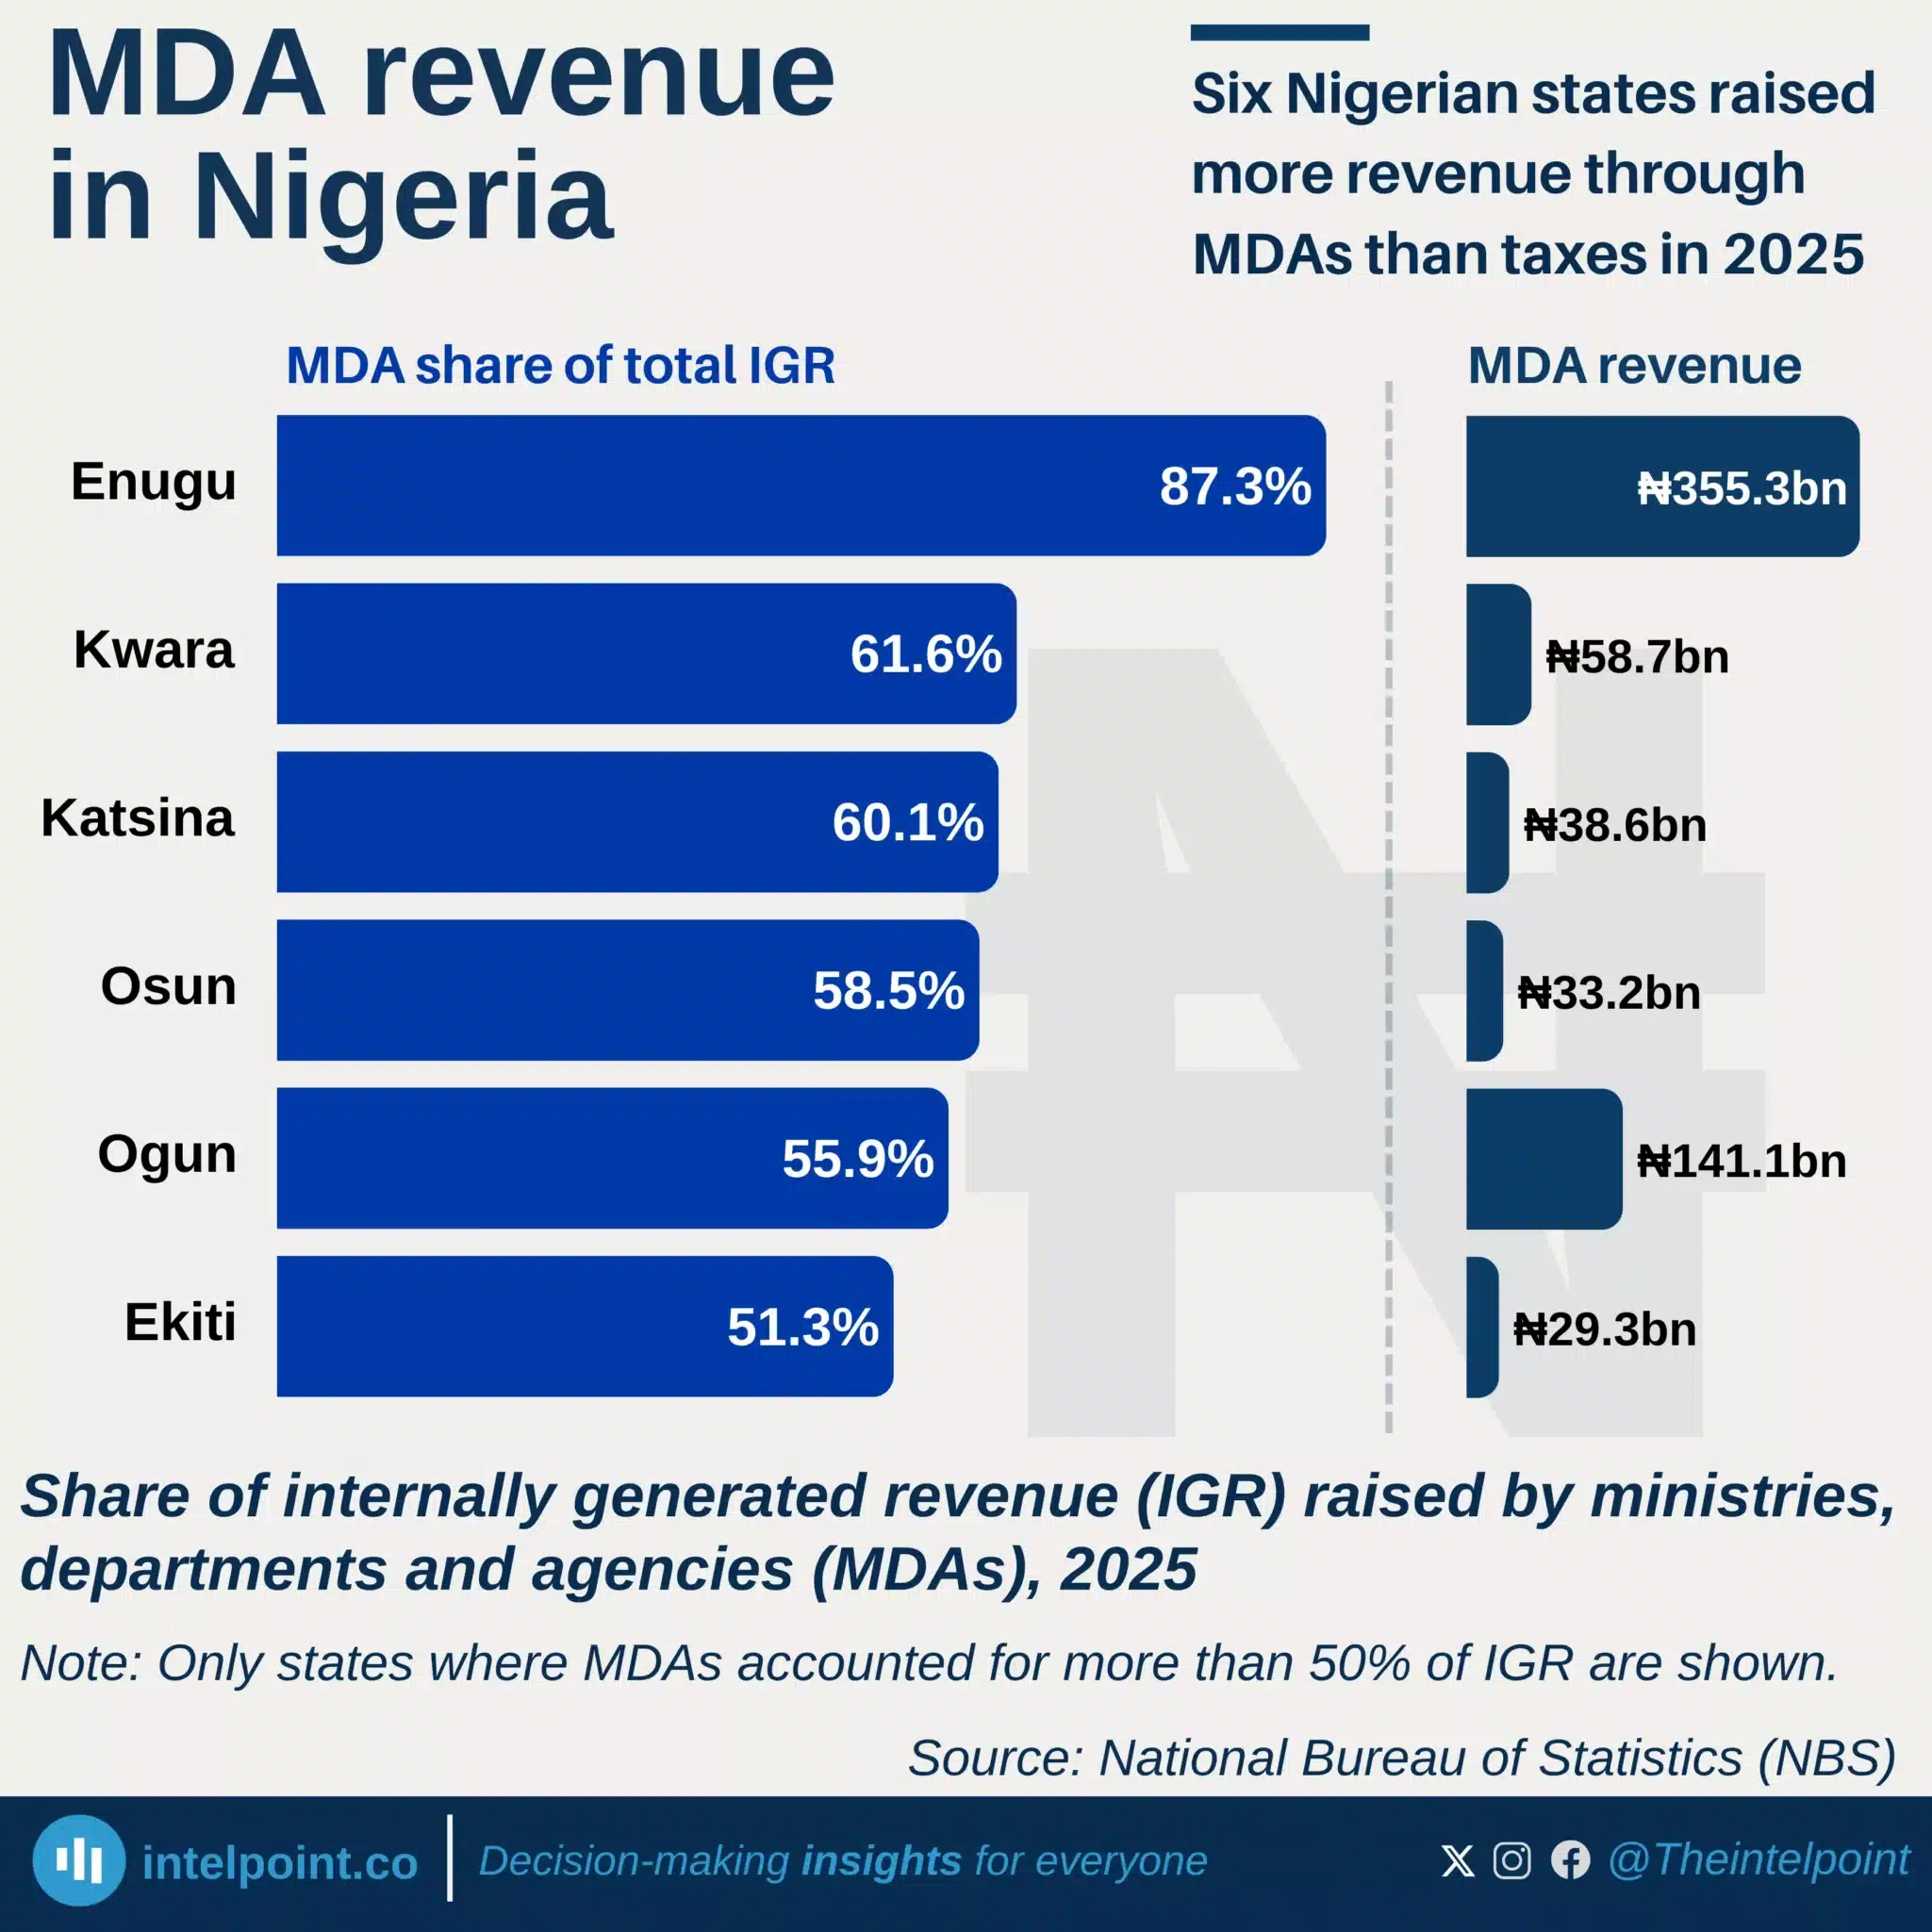
Six Nigerian states raised more revenue through MDAs than taxes in 2025
  • Six states generated about ₦656 billion through MDAs in 2025, nearly half of all MDA revenue.
  • The number of states where MDAs accounted for over half of IGR fell from seven in 2024 to six in 2025.
  • Enugu’s MDA share rose from 82.9% in 2024 to 87.3% in 2025, widening its lead.
  • Kwara, Katsina and Osun recorded MDA shares of 61.6%, 60.1% and 58.5%, respectively.

POPULAR TOPICS
SIGN UP TO OUR NEWSLETTER
Get periodic updates about the African startup space, access to our reports, among others.
Subscribe Here
Subscription Form

A product of Techpoint Africa. All rights reserved