North and Southern Africa grew their reserve in 2023, while West, East, and Central Africa saw declines

  • North Africa dominates with 53.8% of Africa’s total reserves.
  • West Africa holds 17.6%, despite economic challenges.
  • Southern Africa accounts for 20.3%, benefiting from strong reserves in South Africa.
  • East Africa lags behind with 4.4%, indicating lower reserve accumulation in the region.
  • Central Africa holds the smallest share at 4%, reflecting economic struggles and weak financial buffers.

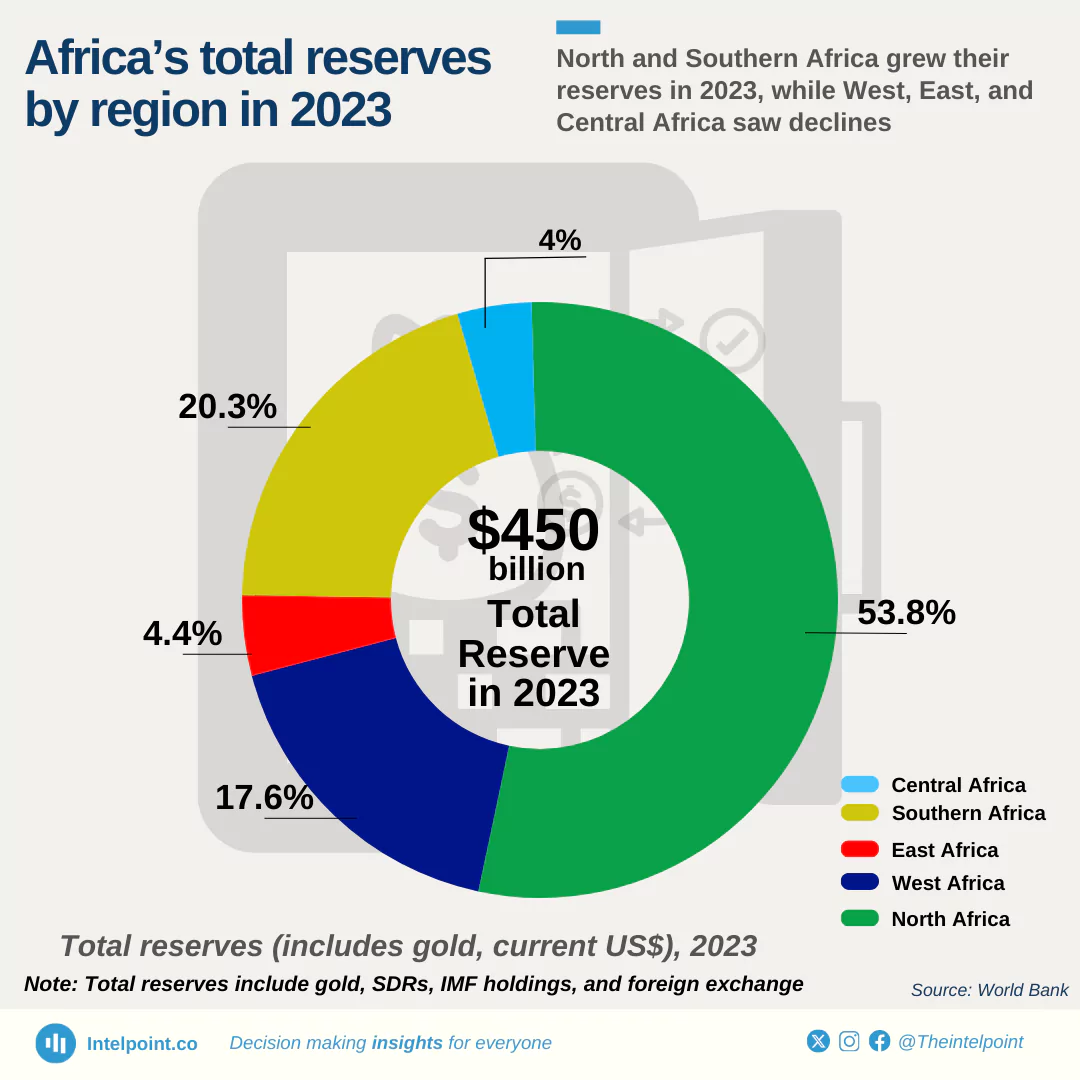
Africa’s total reserves, including gold, stood at $450 billion in 2023. North Africa, with 53.8% of the total reserves, is the dominant force. In contrast, East Africa holds only 4.4%. West Africa holds 17.6% Southern Africa, accounting for 20.3%, benefits from South Africa’s strong reserves.  Central Africa fares the worst with just 4%, which leaves the region particularly exposed to economic shocks.

Source:

World Bank

Period:

2023
HTML code to embed chart
Want a bespoke report?
Reach out
Tags
Related Insights

Borno records lowest domestic debt in North-East Nigeria at ₦22.3 billion in Q2 2025
  • The six North-Eastern states collectively owe around ₦450 billion in domestic debt as of Q2 2025.
  • Borno State maintains the lowest debt in the region at ₦22.3 billion, showing signs of controlled borrowing amid post-conflict rebuilding.
  • Bauchi State has the highest domestic debt burden of ₦143.6 billion, accounting for about 31% of the region’s total.
  • The top three states, Bauchi, Taraba and Gombe, collectively account for more than two-thirds of the zone’s total subnational debt stock.

In just six months, Nigeria spent over $2.3 billion servicing external debts
  • Nigeria paid $816.3 million to the International Monetary Fund, accounting for over 35% of total external debt service payments.
  • Eurobond payments followed closely, with $687.8 million paid, reflecting Nigeria’s heavy reliance on commercial debt instruments.
  • Multilateral lenders like IDA and AfDB collectively received about $463 million, signalling continued exposure to concessional financing.
  • China’s share shrinking: Payments to Chinese lenders (EXIM + CDB) totalled $235.6 million, less than 11% of total outflows, suggesting reduced Chinese debt servicing in H1 2025.

Over 60% of Nigeria’s ₦1.7 trillion domestic debt service in Q2 2025 was spent on Federal Government Bonds
  • FGN bonds dominated: ₦1.07 trillion went to Federal Government Bonds, accounting for about 63% of total domestic debt servicing.
  • Treasury bills followed: Payments on NTBs reached ₦537.9 billion, making up roughly 31% of the total.
  • Sukuk and promissory notes together cost ₦90.8 billion, reflecting Nigeria’s mix of infrastructure and settlement instruments.
  • Green and savings bonds remained minimal, together below ₦5 billion, showing limited traction for retail and sustainability-focused debt.

93% of Nigeria's public debt is owed by the Federal Government
  • The Federal Government’s share of total public debt rose from 79.5% in 2019 to 92.6% in 2025.
  • States’ share has more than halved, from 20.5% to 7.4% in six years.
  • Total public debt grew from $83.9 billion to $99.7 billion, peaking at $113.4 billion in 2023.
  • Nigeria’s debt burden is increasingly concentrated at the centre, amplifying federal repayment risks and reducing fiscal independence for states.

60% of Nigeria's ₦152.4 trillion public debt is owed to domestic lenders
  • Total public debt hits ₦152.4 trillion, marking another milestone in Nigeria’s expanding debt profile.
  • Domestic debt leads at ₦80.5 trillion, making up about 53% of total obligations.
  • External debt stands at ₦71.8 trillion, equivalent to roughly 47%, reflecting Nigeria’s ongoing exposure to foreign lenders.
  • The data signals growing fiscal dependence on local markets, as authorities seek to limit exchange rate risks while still financing deficits.

Nigeria’s 2024 GDP just got a $65 billion boost after the 2025 rebasing
  • The IMF’s new 2019 GDP base year added between $20 billion and $235 billion annually to Nigeria’s GDP from 1990–2025.
  • 2014 saw the biggest jump — an upward revision of $235.1 billion, raising GDP to $811.1 billion from $576.0 billion under the old base.
  • The rebased data consistently show 40–45% higher GDP values through the 2000s and 2010s, revealing a larger economy than earlier estimates.
  • The impact was strongest during Nigeria’s oil boom years (2007–2014), when rebasing captured fast-growing sectors like digital services, informal trade, and modular refining.

POPULAR TOPICS
SIGN UP TO OUR NEWSLETTER
Get periodic updates about the African startup space, access to our reports, among others.
Subscribe Here
Subscription Form

A product of Techpoint Africa. All rights reserved