Zenith Bank remained Nigeria's most profitable bank in 2024, with a profit after tax (PAT) of ₦1.03 trillion, a 53% increase from the 2023 value

Key takeaways:

  • Zenith Bank Plc led the profitability ranking with a Profit After Tax (PAT) of ₦1.03 trillion.
  • Guaranty Trust Holding Company followed closely with ₦1.02 trillion in PAT.
  • Each of the top six banks recorded profits exceeding ₦600 billion.
  • The total PAT for the top ten banks rose by 53%, from ₦3.39 trillion in 2023 to ₦5.54 trillion in 2024.
  • FCMB Group Plc was the only bank among the top ten to record a year-on-year decline in PAT.
  • Ecobank, First Holdco, Fidelity Bank, and Wema Bank each recorded over 100% growth in PAT compared to 2023.

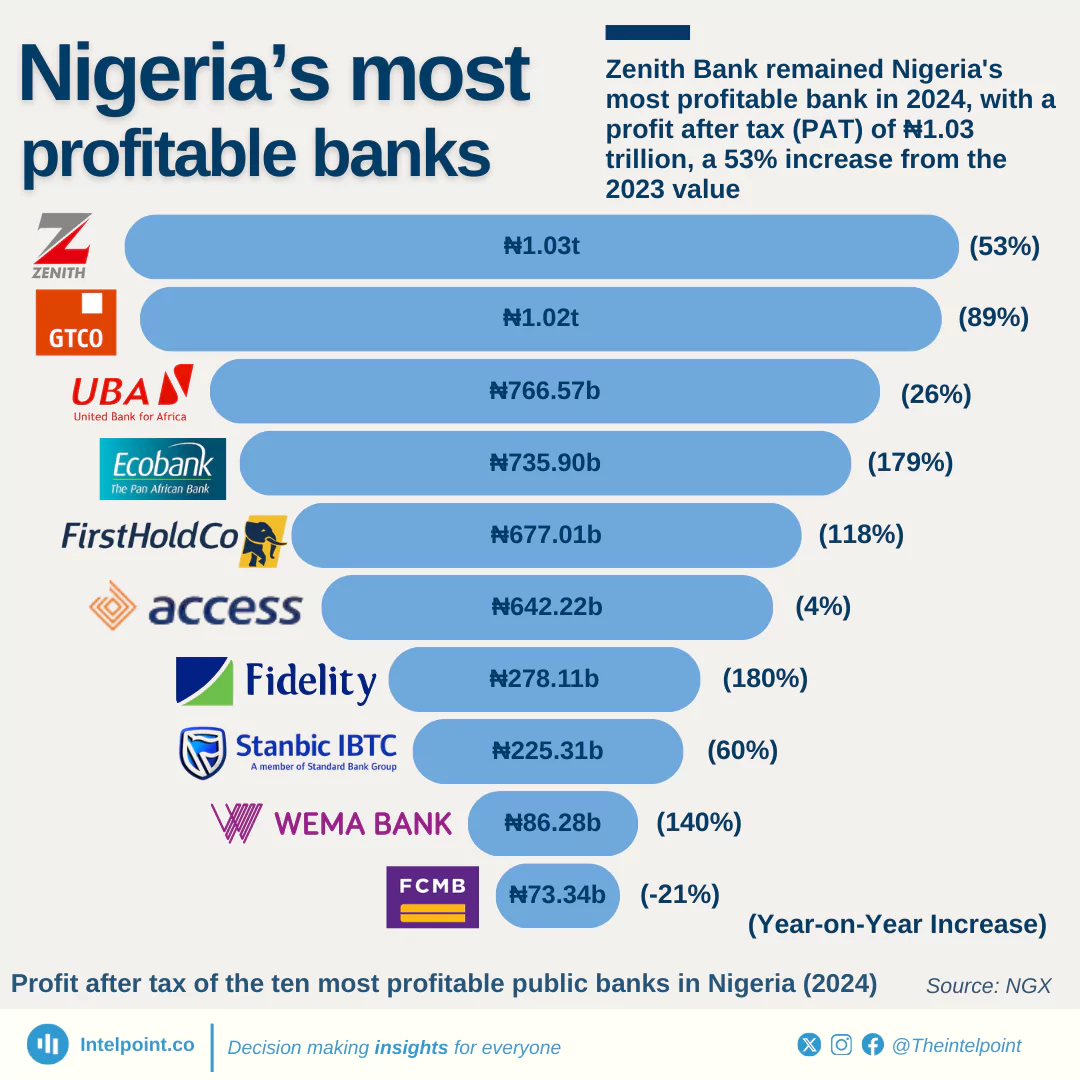
The Nigerian banking sector posted robust financial results in 2024, with the ten most profitable banks collectively reporting a profit after tax (PAT) of ₦5.54 trillion. This marks a significant 53% increase from the ₦3.39 trillion recorded in 2023.


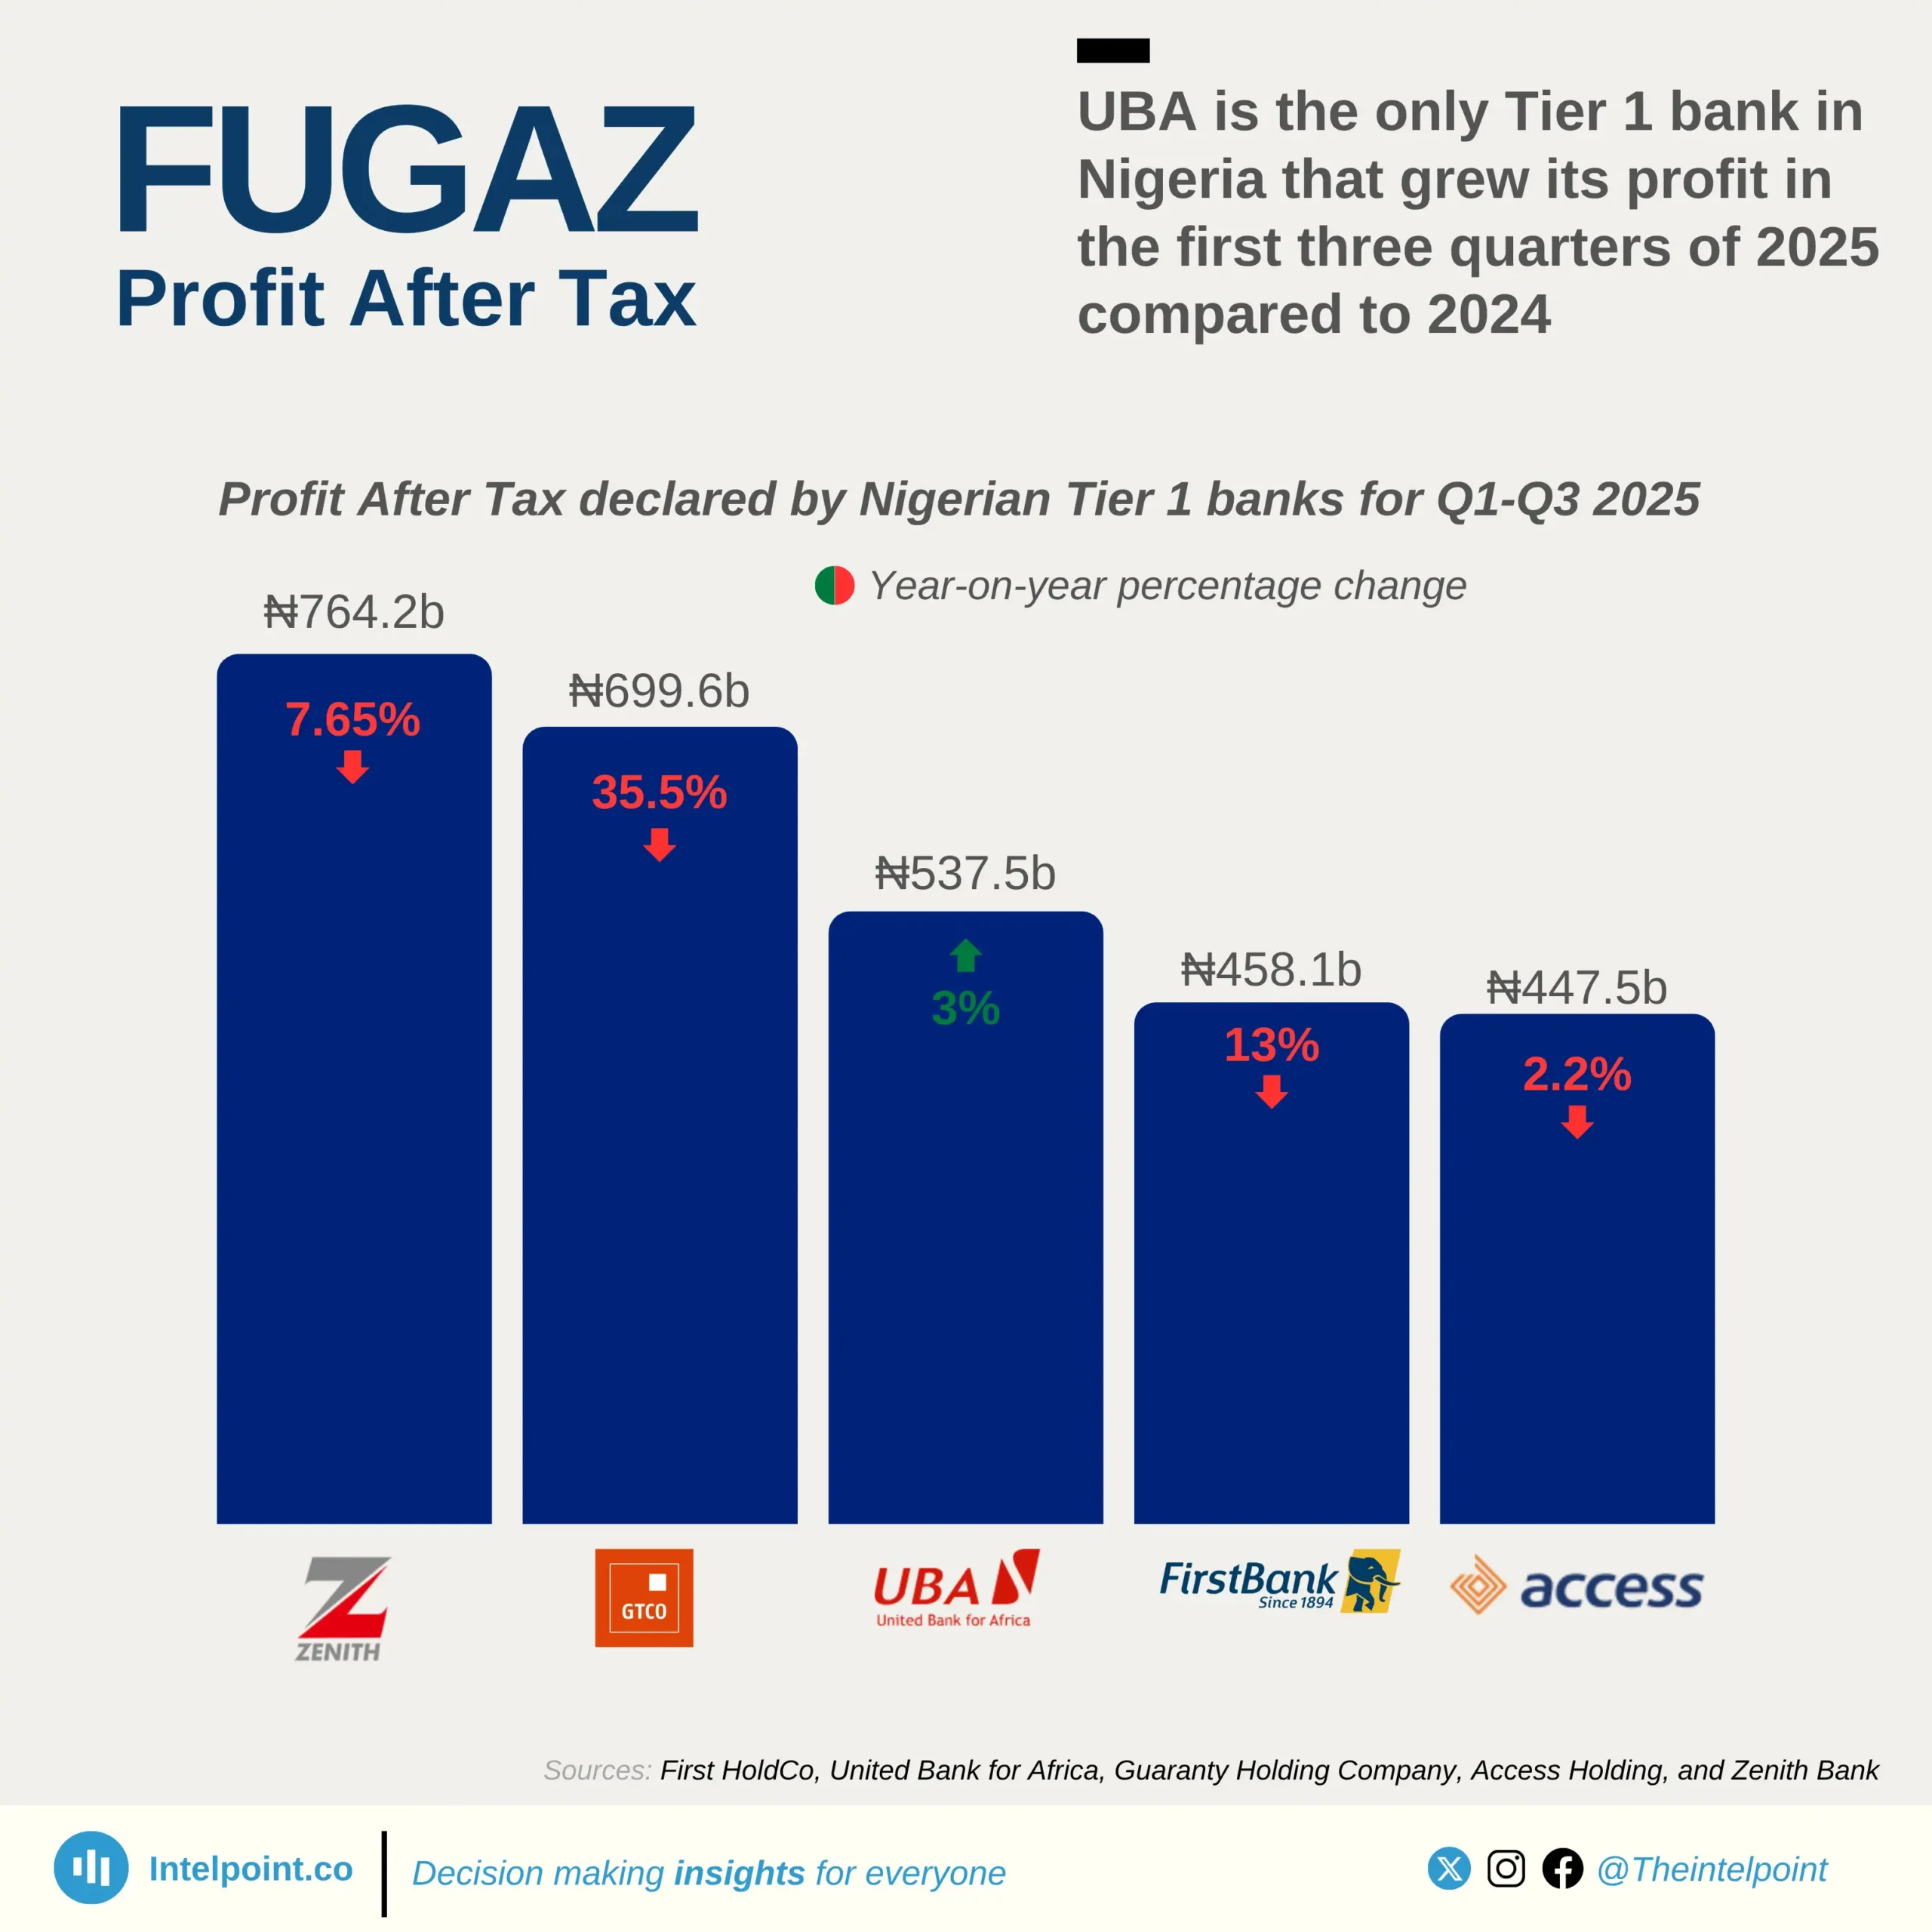
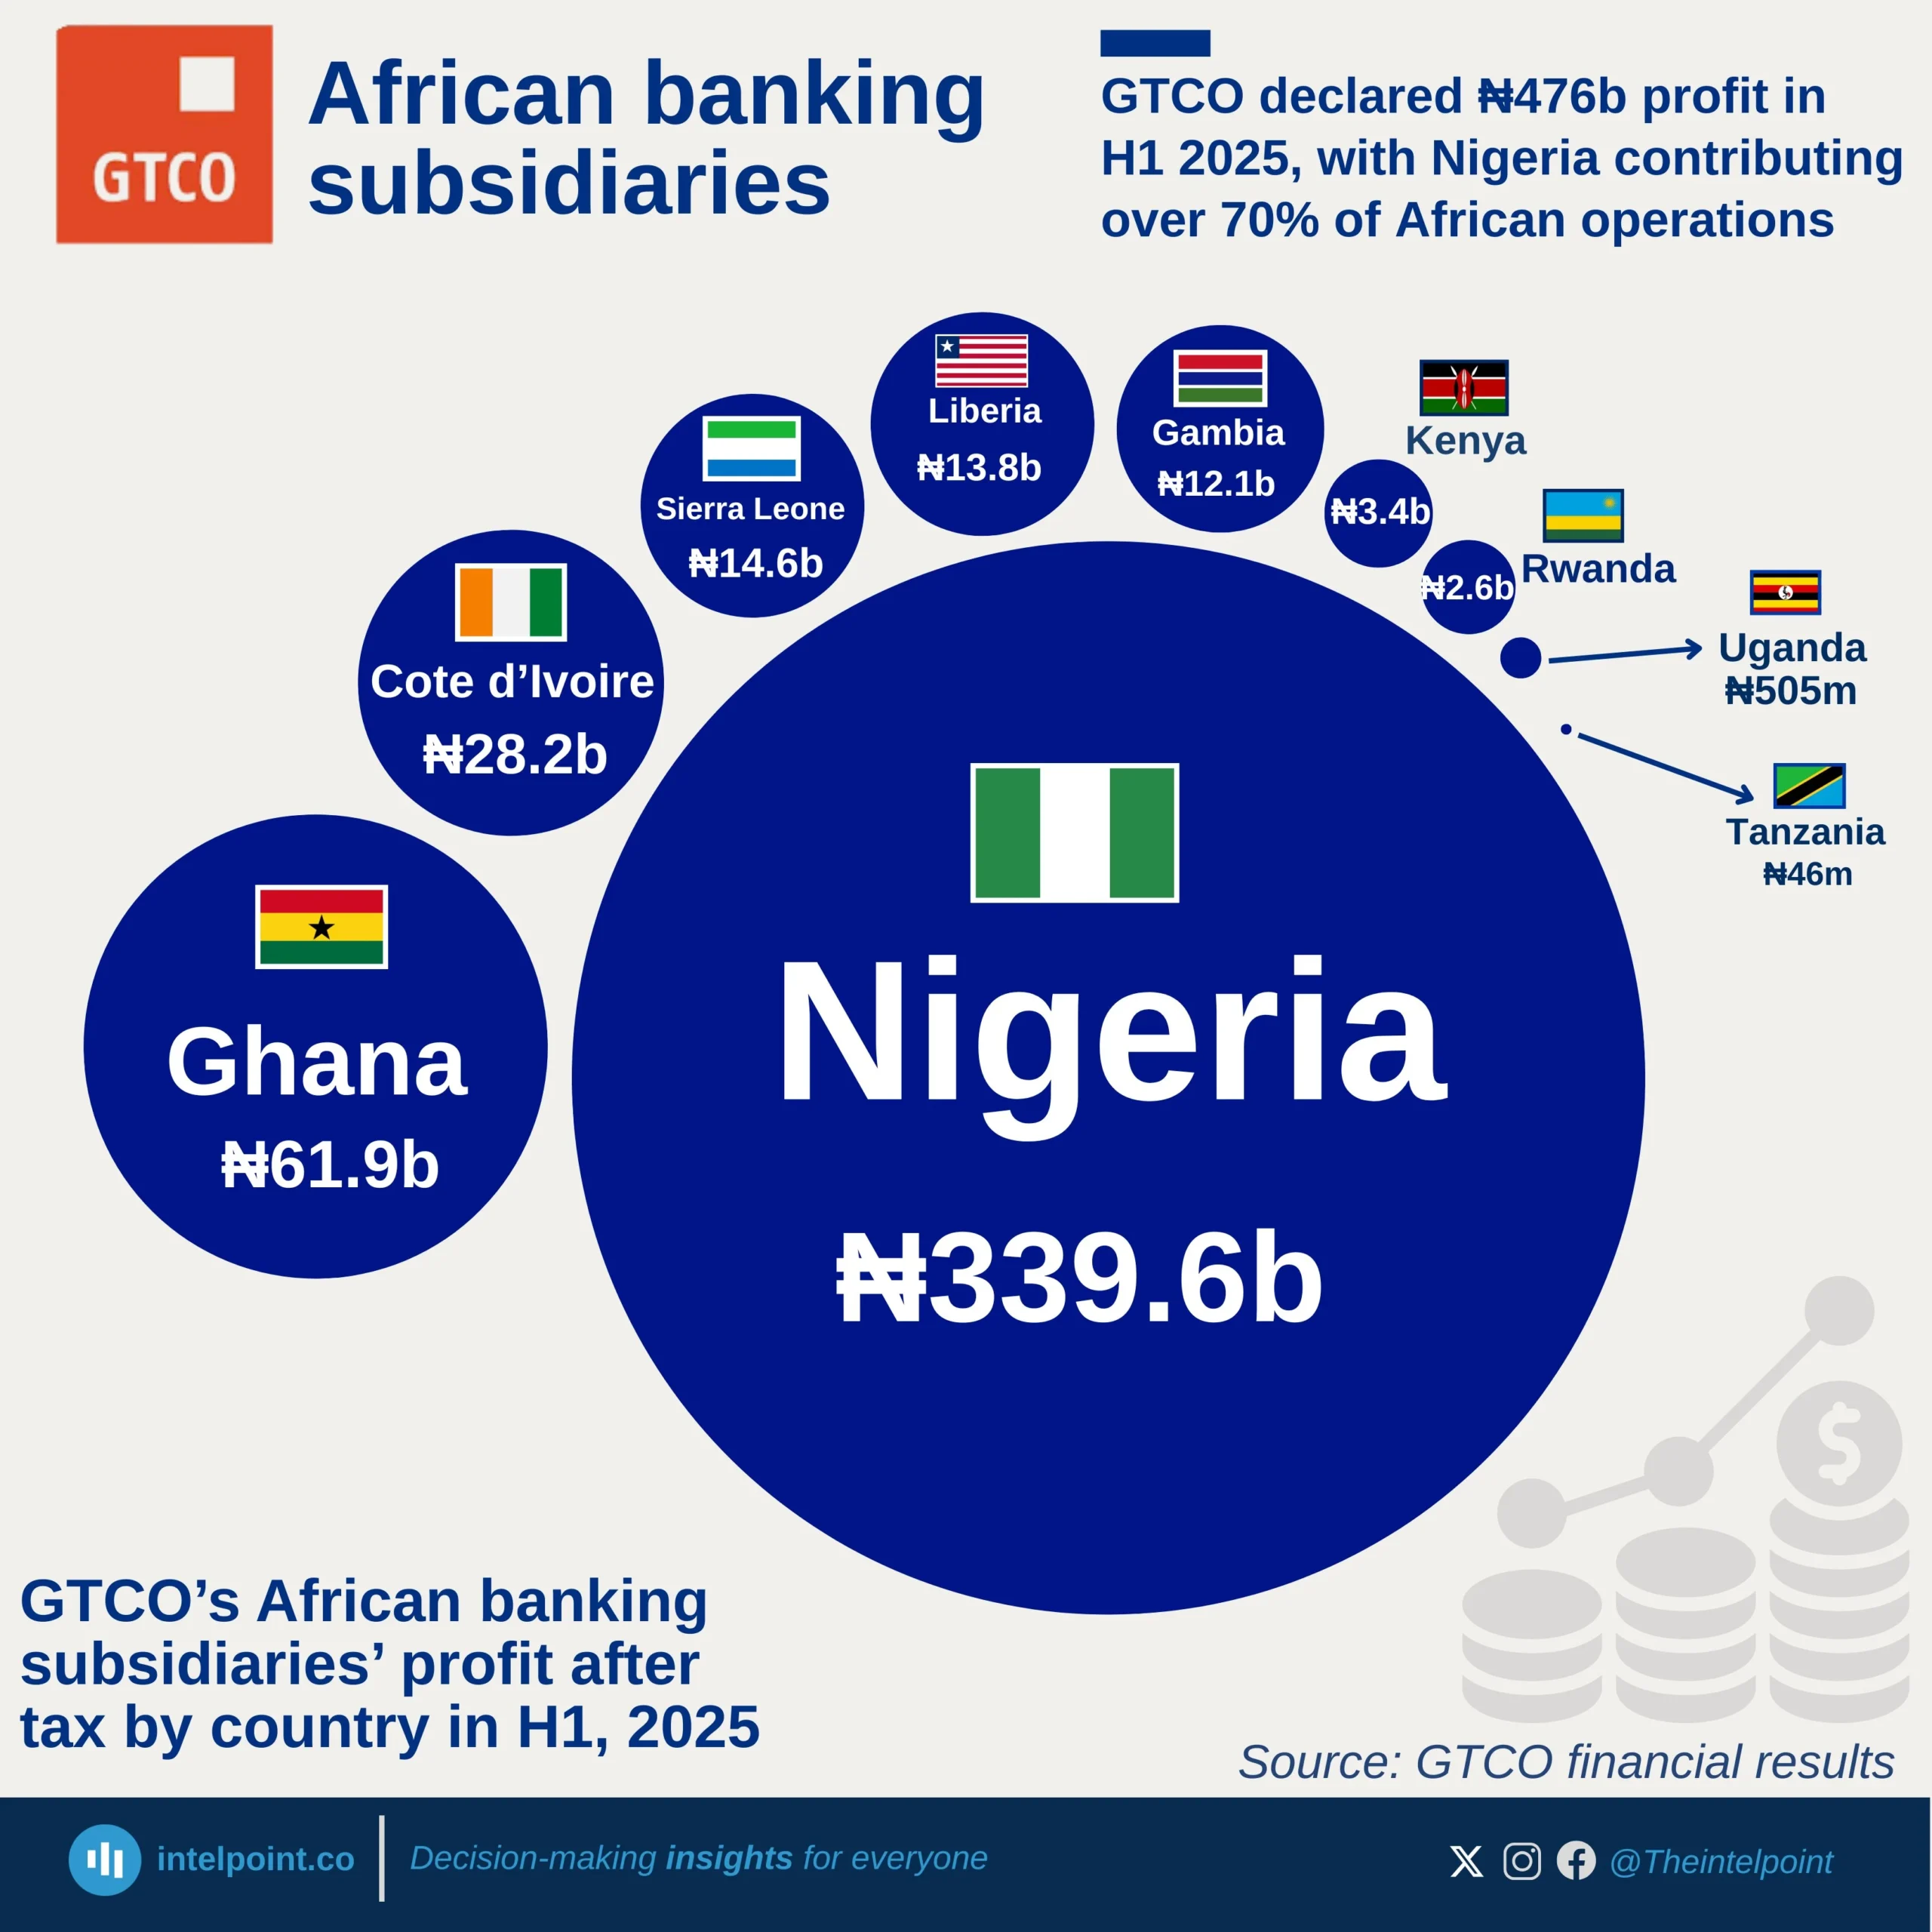
Zenith Bank Plc topped the profitability chart with a PAT of ₦1.03 trillion, closely followed by Guaranty Trust Holding Company, which posted ₦1.02 trillion. United Bank for Africa (UBA) and Ecobank ranked third and fourth with ₦766.6 billion and ₦735.9 billion, respectively. First Holdco Plc and Access Holdings also recorded strong profits, each exceeding ₦600 billion.


Other banks on the top ten list include Fidelity Bank, Stanbic IBTC, Wema Bank, and FCMB Group Plc, with profits ranging from ₦279 billion to ₦73 billion. Notably, FCMB was the only bank on the list to experience a decline in profit compared to the previous year.

Source:

NGX

Period:

2024
HTML code to embed chart
Want a bespoke report?
Reach out
Tags
Related Insights

GTCO declared ₦476b profit in H1 2025, with Nigeria contributing over 70% of African operations
  • Nigeria dominates with ₦339.6b, contributing over 70% of GTCO’s total profit after tax in Africa.
  • Ghana (₦61.9b) and Côte d’Ivoire (₦28.2b) followed as the strongest non-Nigerian subsidiaries.
  • Tanzania (₦46m) and Uganda (₦505m) contributed negligible profits compared to peers.
  • GTCO subsidiaries across Africa collectively generated around ₦476b profit after tax in the first half of 2025.

Total microfinance deposits in Kenya only grew 1.66% CAGR over 10 years, ending at KSh 43.0B
  • Microfinance deposits in Kenya grew at only 1.66% CAGR between 2014 and 2024.
  • The peak occurred in 2021 at KSh 50.2B, after which deposits began a steady decline.
  • 2015 (+13.2%) and 2020 (+12.3%) posted the strongest year-on-year growth rates.
  • The sector saw consecutive contractions from 2022 (-7.3%), 2023 (-5.7%), to 2024 (-2.0%).
  • Despite small rebounds in 2018 (+7.3%) and 2019 (+12.3%), the long-term trend is weak.

Microfinance banks in Kenya have consistently posted losses since 2016, reaching KSh -3.5B in 2024
  • Microfinance banks in Kenya recorded their last profit in 2015 (KSh 0.6B) before sliding into losses.
  • The sector’s losses deepened from KSh -0.4B in 2016 to KSh -3.5B in 2024.
  • The steepest single-year decline occurred in 2020, when losses increased by 560.8% to KSh -2.2B.
  • Even in recovery years like 2019 (KSh -0.3B) and 2021 (KSh -0.7B), the sector remained in losses.
  • Over the 10 years, profitability fell at a -212.1% CAGR, reflecting a structural collapse.
  • Since 2016, there has been no single year of profit, highlighting sustained weakness.
  • The worsening losses mirror other sector struggles, such as stagnant deposits, weak asset growth, and rising NPLs.

Kenya’s microfinance banks’ total assets over the years have ranged from KSh 57.0B to KSh 76.4B (2014–2024), standing at KSh 57.9B in 2024
  • Kenya’s microfinance assets grew by just 1.62% between 2014 and 2024.
  • The sector peaked in 2019 at KSh 76.4B, before entering a steady decline.
  • 2023 (-8.8%) and 2024 (-9.8%) posted the steepest year-on-year declines.
  • The sector recorded only two notable growth spikes: 2015 (+21.9%) and 2019 (+7.9%).
  • Overall, the trend from 2020 onward shows persistent contraction in asset value.

After years of growth, Kenyan banks’ asset value declined by 1.6% to KSh 7.6T in 2024
  • Kenyan banks’ total assets grew by 56.6% between 2019 and 2024.
  • In 2024, assets declined slightly by 1.6%, the first drop in five years.
  • The sector recorded consistent growth from 2019 to 2023 before dipping in 2024.
  • The highest growth came in 2023, when assets surged 17.6% to KSh 7.7T.
  • Assets rose from KSh 4.8T in 2019 to KSh 7.6T in 2024.
  • Despite the 2024 dip, banks added nearly KSh 3 trillion in assets over the five years.

POPULAR TOPICS
SIGN UP TO OUR NEWSLETTER
Get periodic updates about the African startup space, access to our reports, among others.
Subscribe Here
Subscription Form

A product of Techpoint Africa. All rights reserved