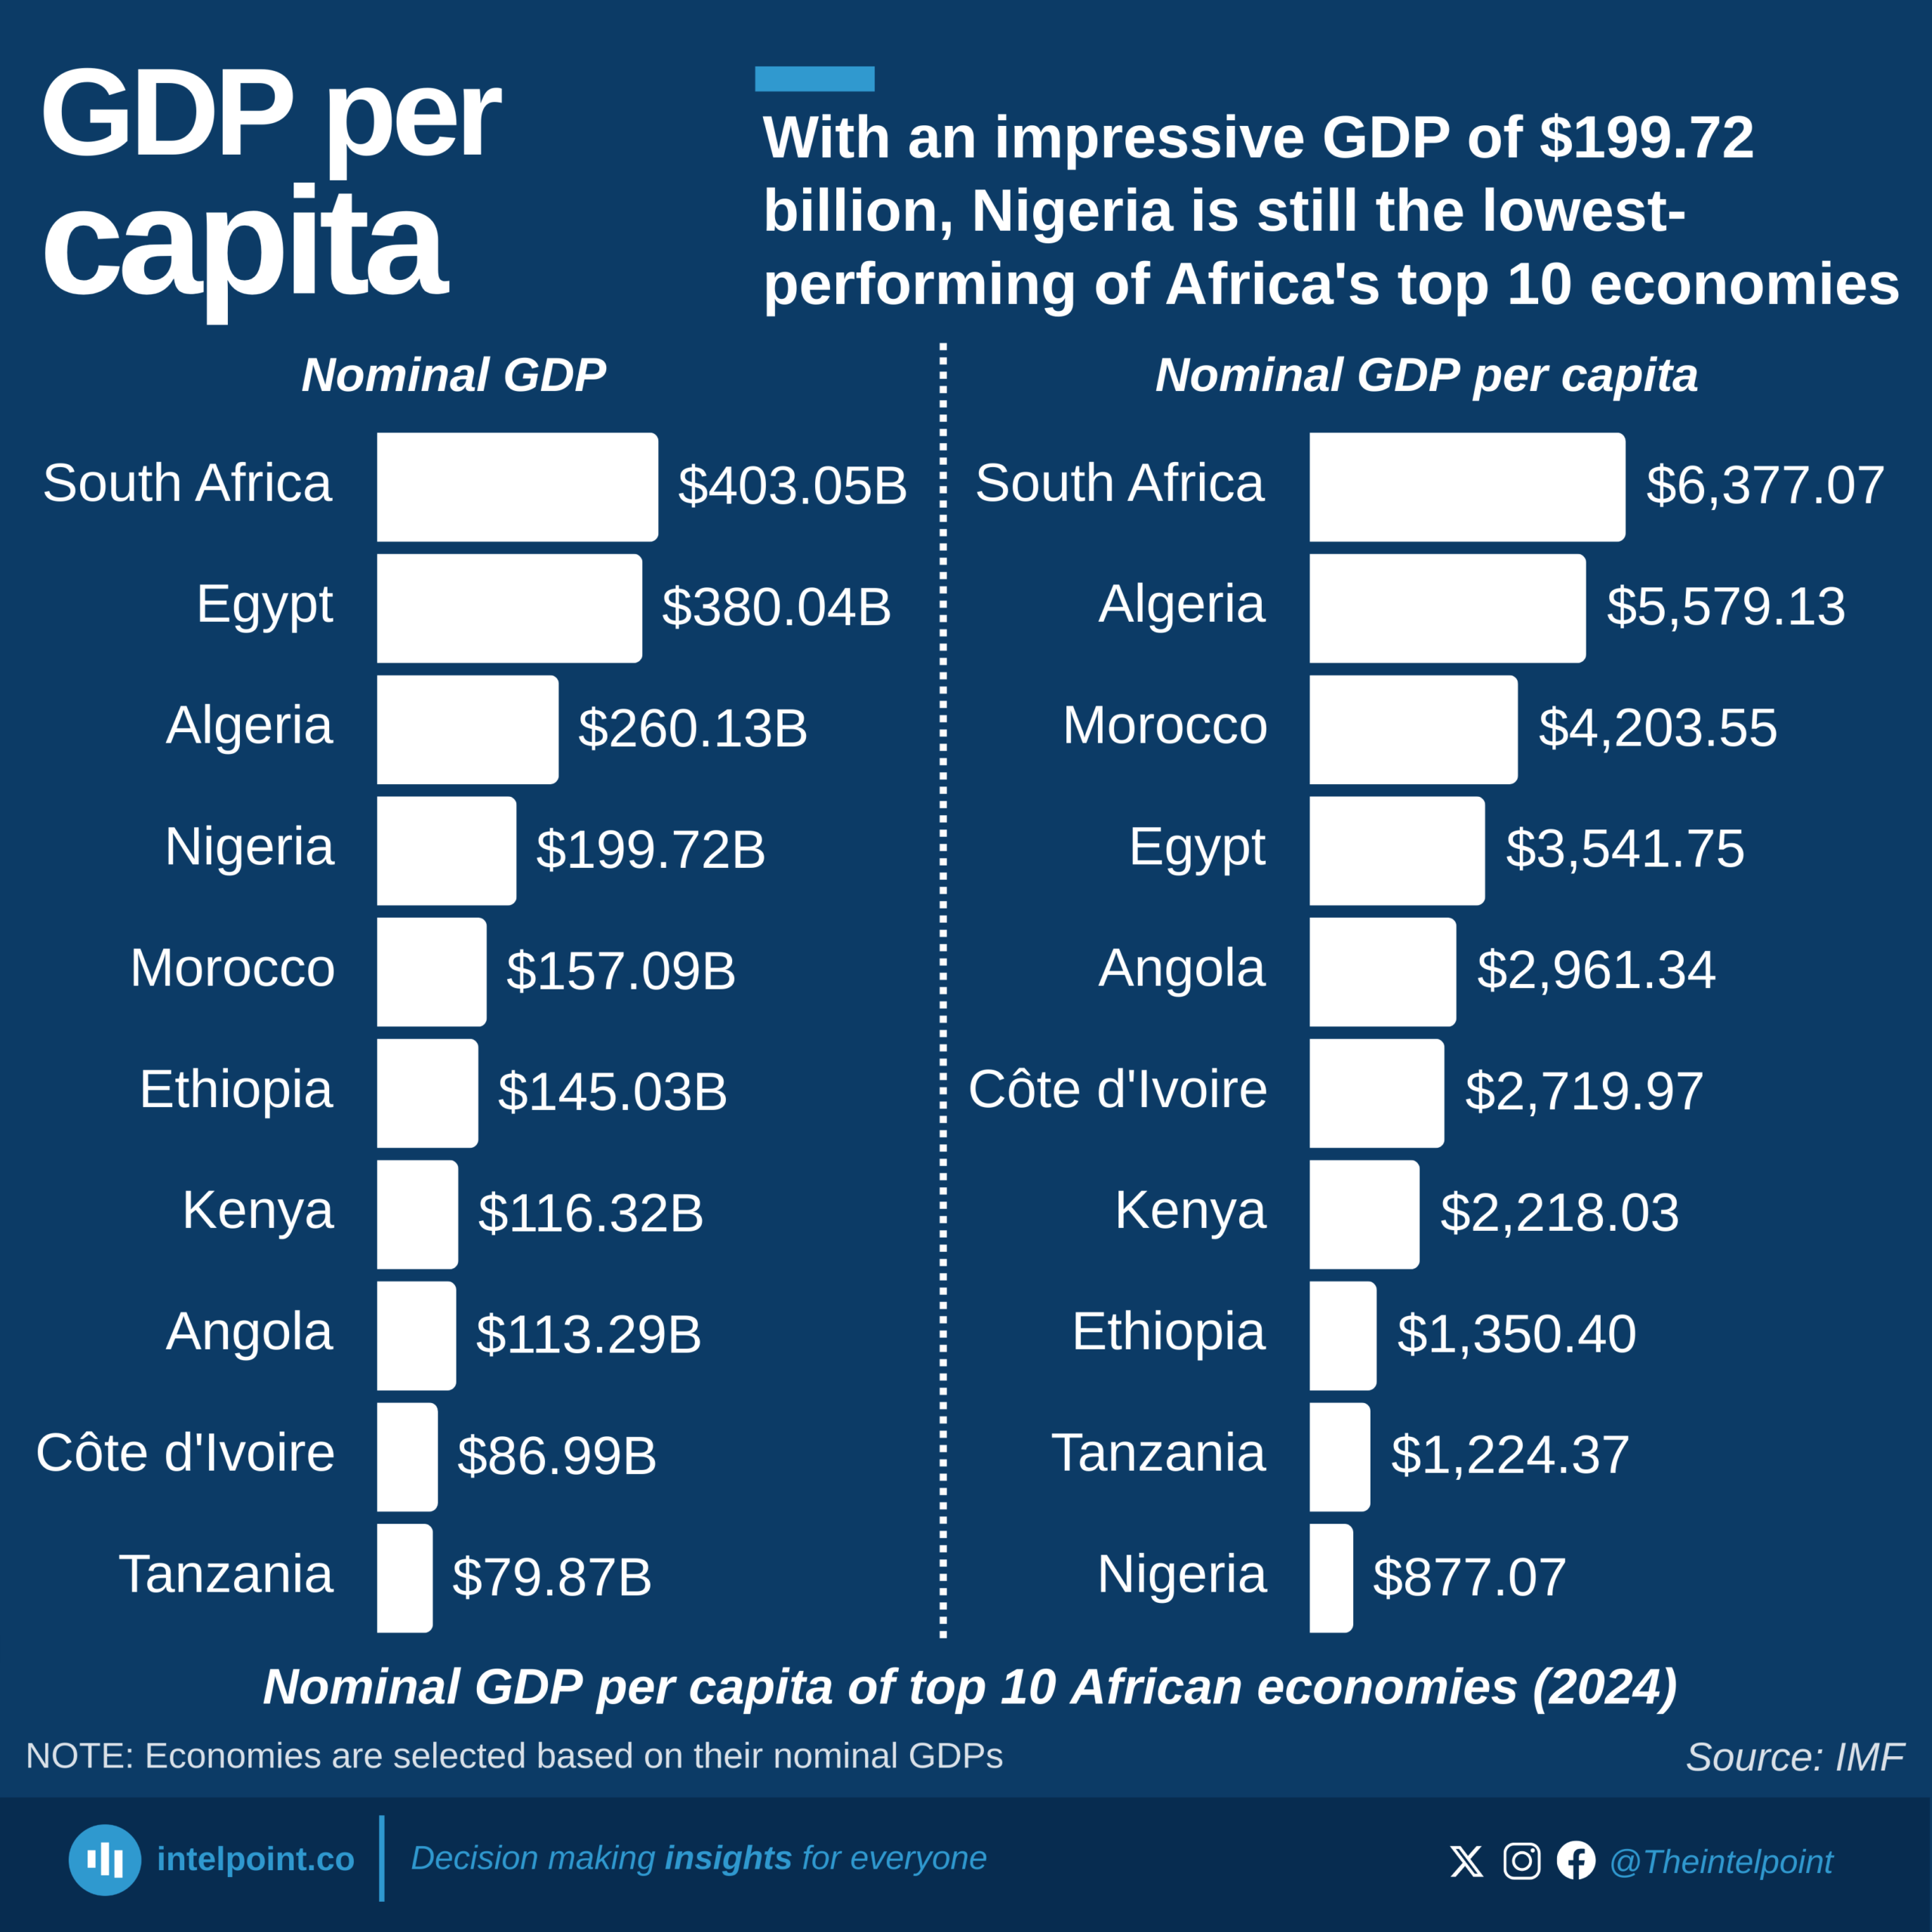
With an impressive GDP of $199.72 billion, Nigeria is still the lowest-performing of Africa's top 10 economies
Key takeaways:
Despite being among the top 4 economies by size, Nigeria ranks low in GDP per capita, revealing a disconnect between total wealth and individual prosperity.
With the highest nominal GDP and highest per capita GDP, South Africa showcases balanced growth and better wealth distribution.
Countries like Ethiopia and Nigeria have huge populations, which dilutes their GDP and drags down per capita figures.
Though fifth in total GDP, Morocco performs better in GDP per capita, highlighting efficiency in wealth distribution.
This proves that a country’s economic “size” doesn’t always translate to individual opportunity, wealth, or standard of living.
Economies like Nigeria and Ethiopia must focus not just on increasing GDP but on ensuring that economic growth improves lives at the grassroots level.
Nigeria has a nominal GDP of $199.72 billion, the fourth highest among Africa’s top 10 economies in 2024. However, when it comes to GDP per capita, which measures how much of that wealth touches the average citizen, Nigeria ranks last (among the top 10 economies) with just $877.07. This is the paradox: a massive economy with minimal impact on individual livelihoods.
In comparison, South Africa not only tops the list in total GDP but also leads with a GDP per capita of over $6,300. This suggests that total economic size doesn’t reflect high standards of living if growth doesn’t reach the people.
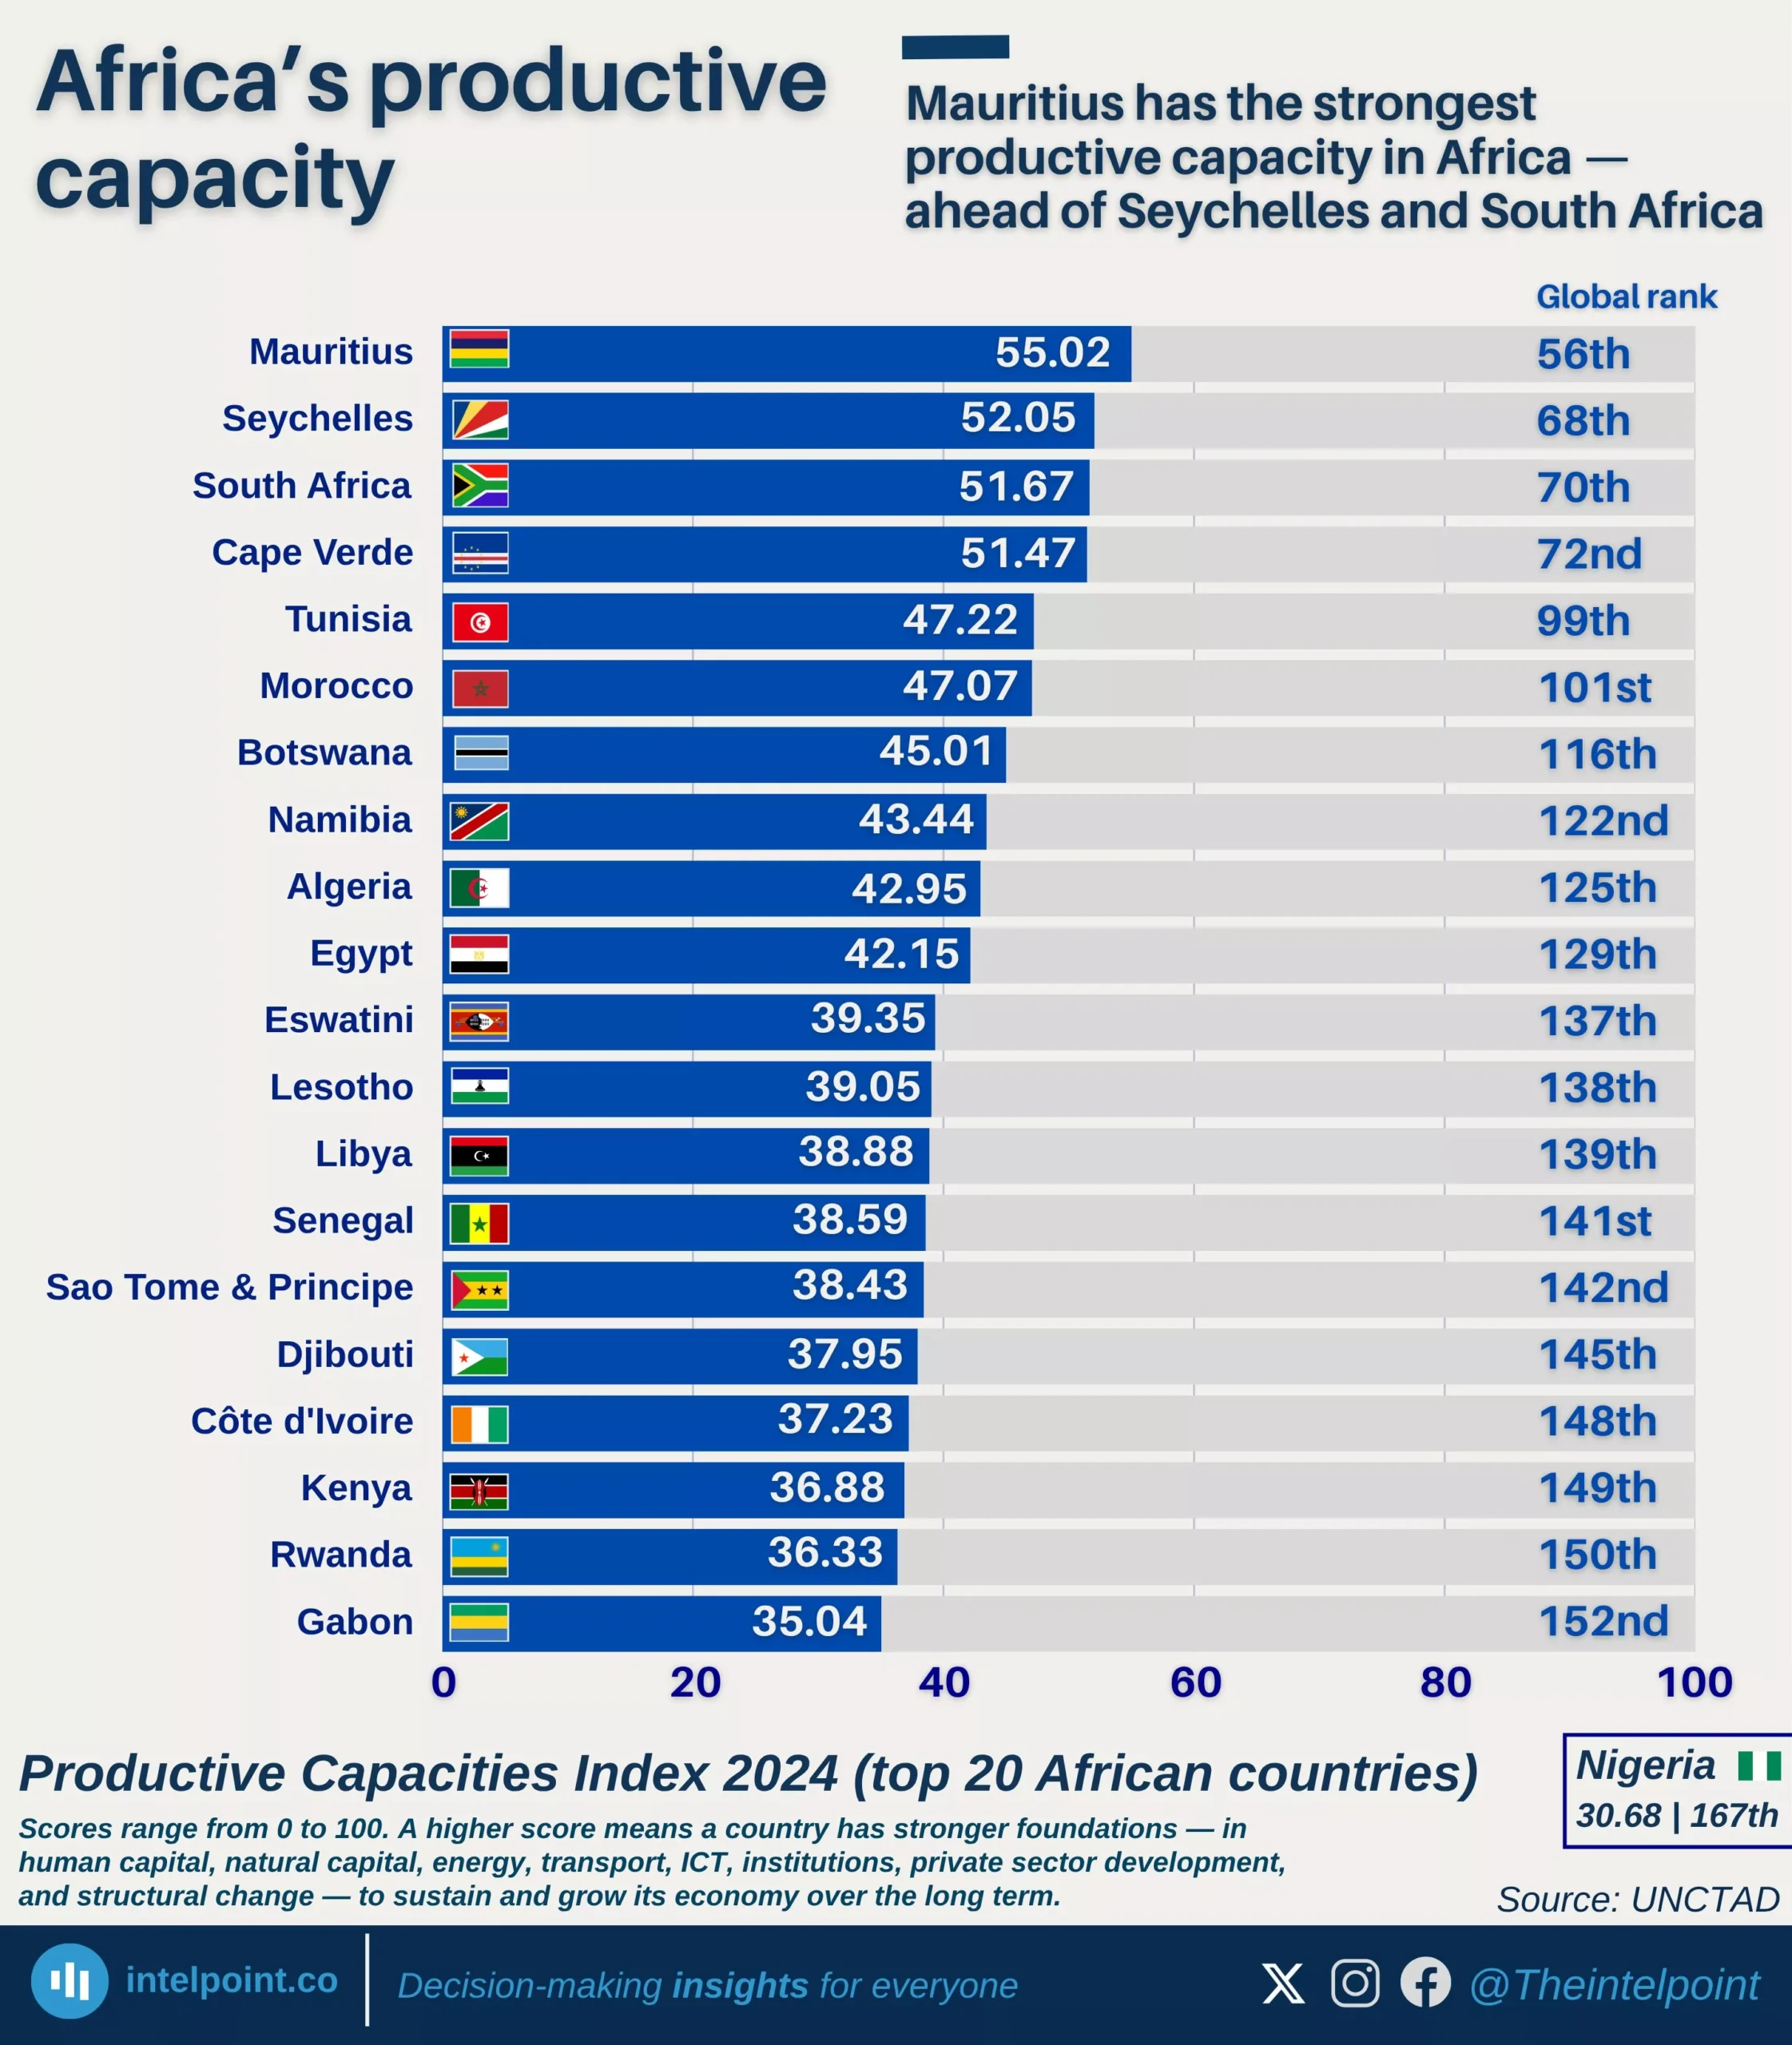
Mauritius leads Africa on the Productive Capacities Index with a score of 55.02, ranking 56th globally.
Seychelles, South Africa, and Cape Verde complete Africa’s top four, but none enters the global top 50.
Nigeria ranks much lower at 167th globally, with a score of 30.68, despite being one of Africa’s largest economies.
The ranking shows that economic size does not always translate into stronger productive foundations like human capital, ICT, energy, transport, and institutions.