US visitor visas: Nigeria's refusal rates have been on the rise since 2015 but there have been drops since 2020

In the US fiscal year 2022, 26% of Nigerians who applied for a US visitor visa were denied, marking the lowest refusal rate in 17 years. After a steady refusal rate of between 32% and 38% from 2007 to 2015, there was an increase to 67% over four consecutive years.
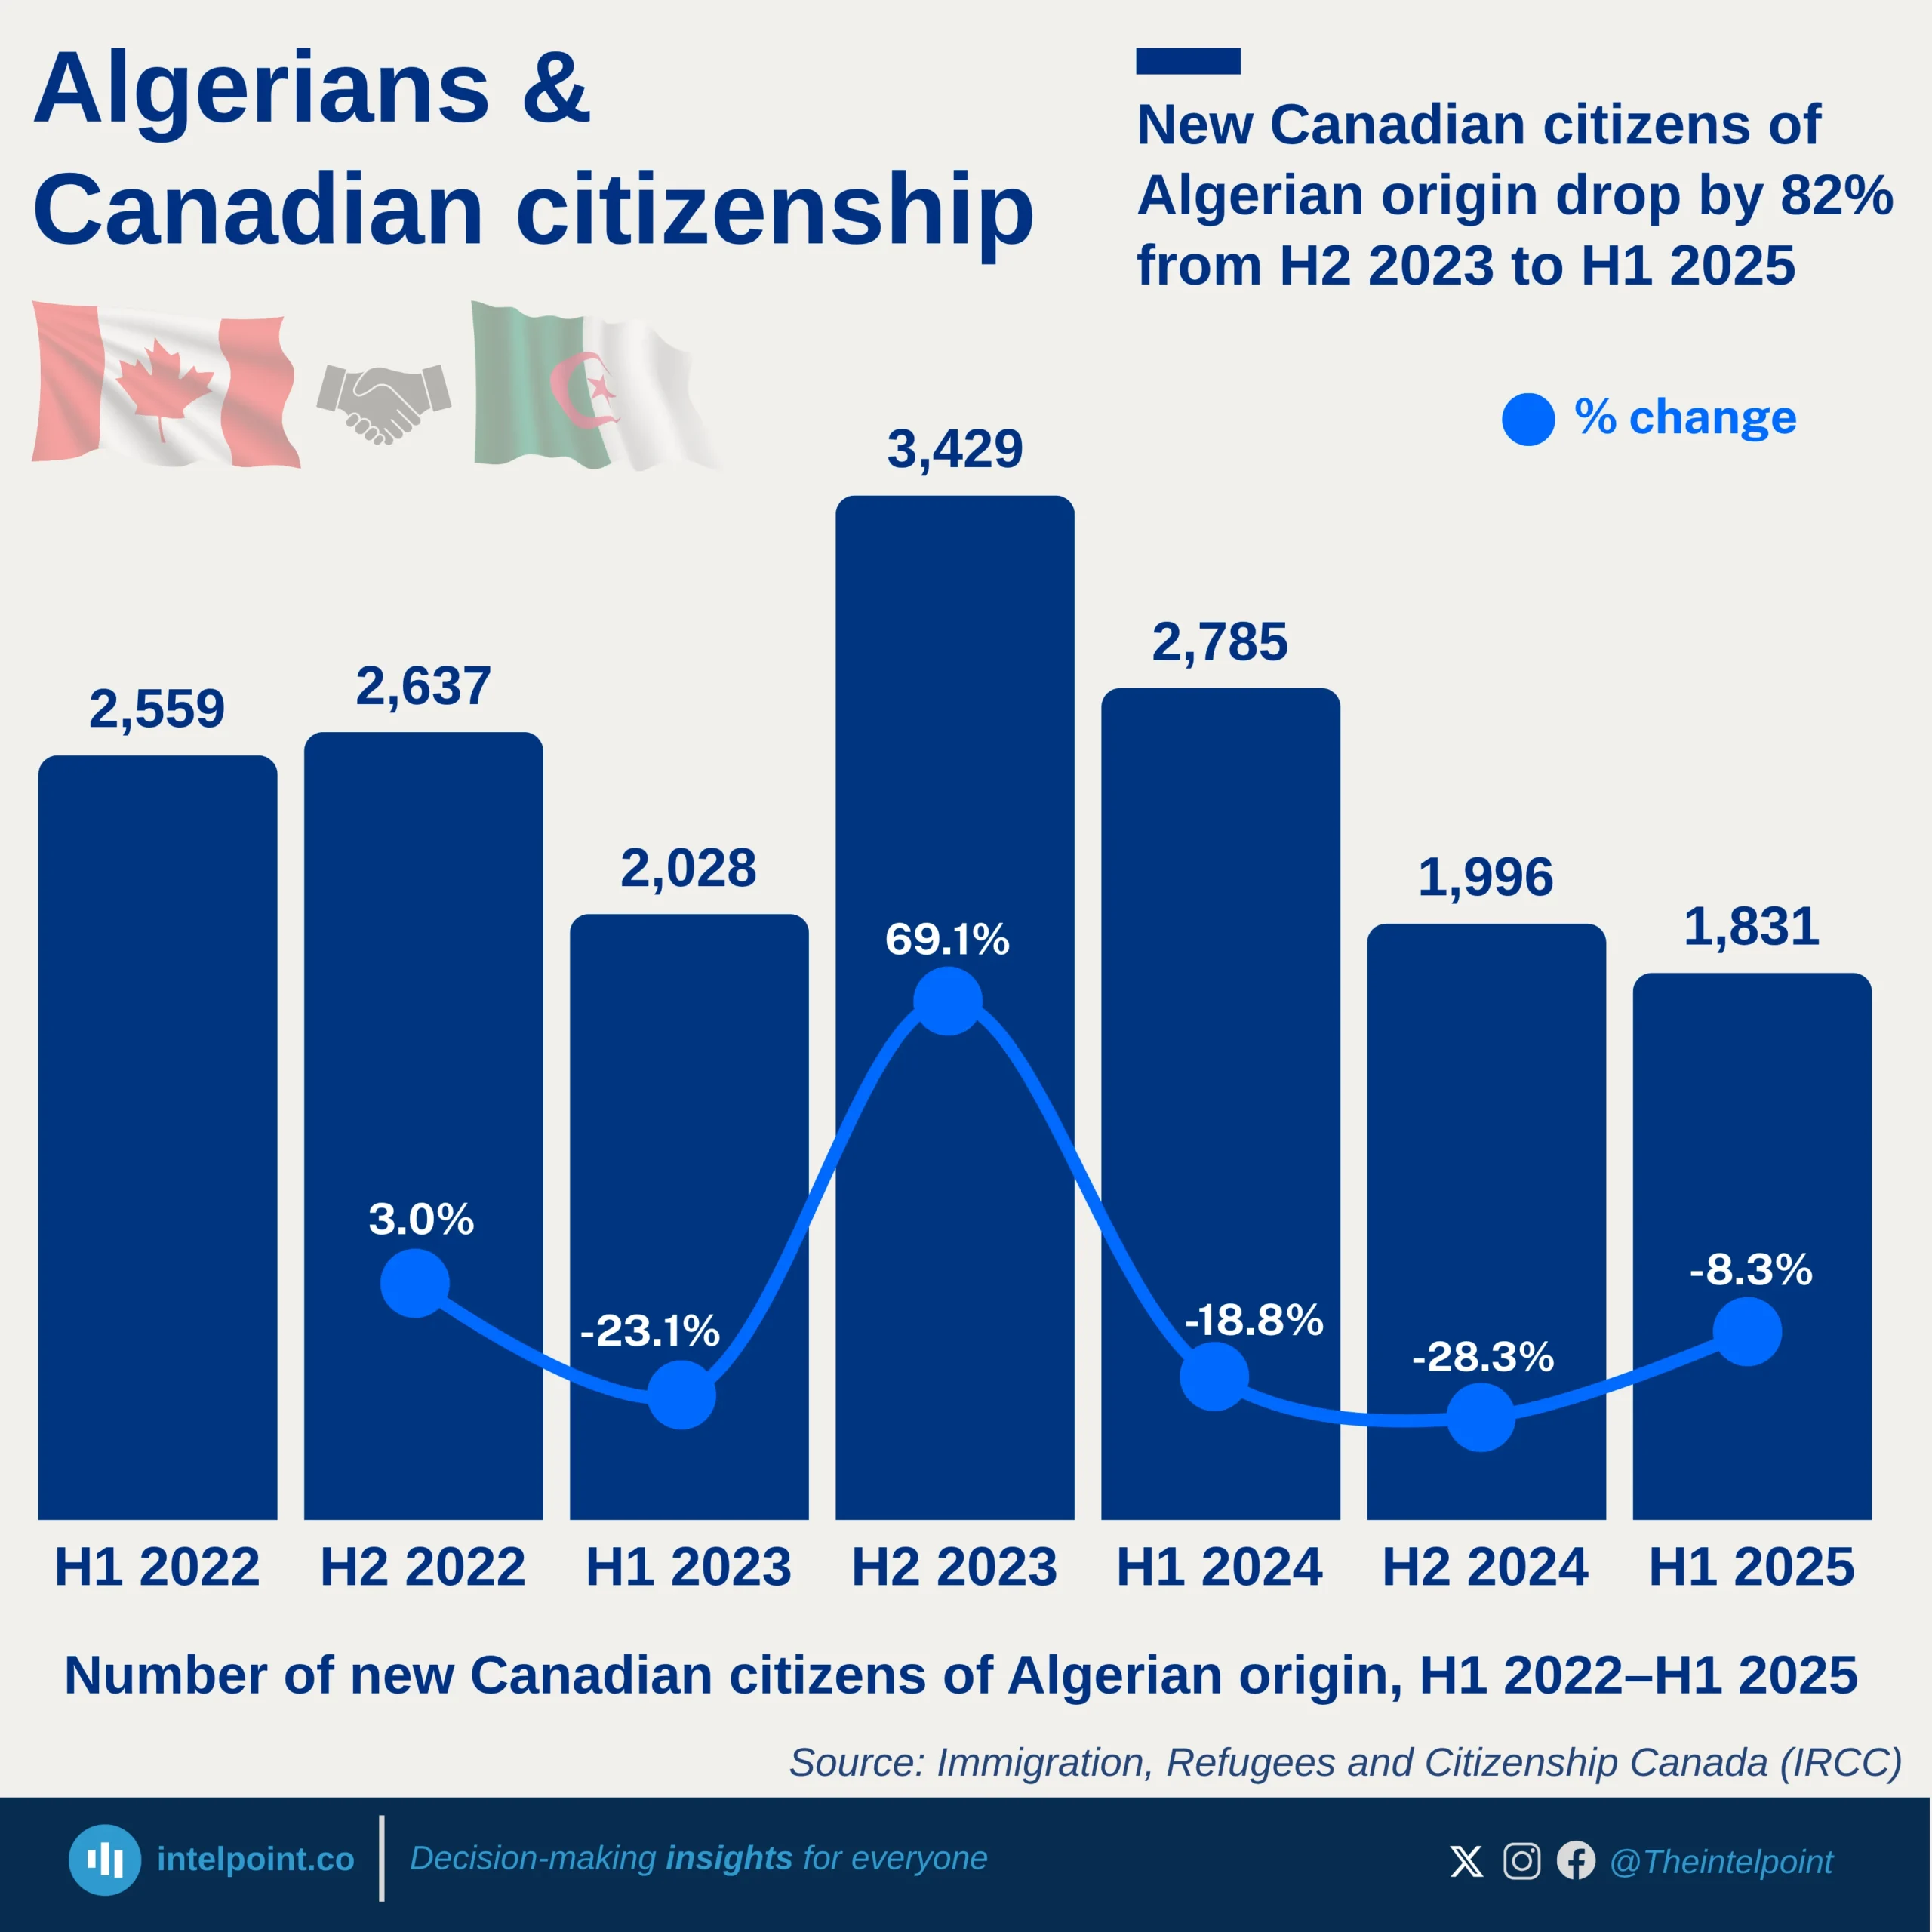
Source:

US Department of State

Period:

2006 - 2022
HTML code to embed chart
Want a bespoke report?
Reach out
Tags
Related Insights

Immigrants make up nearly 1 in 5 people in Gabon, leading African countries with highest migrant populations
  • Gabon leads with 18.7% of its population being immigrants, the highest in Africa.
  • Equatorial Guinea follows with 16.4%, also driven by oil-related labor demand.
  • Djibouti (12.1%) and Libya (12.0%) round out the top four with migrant shares over 10%.
  • South Africa has the highest immigrant population in Southern Africa at 4.8%.
  • Most African nations still record under 5% immigrant share, indicating modest migration levels continent-wide.

UAE’s population is 88% immigrants as Gabon tops African list with 19% migrant share
  1. The United Arab Emirates tops the list with immigrants making up 88% of its total population.
  2. Qatar follows closely with 87% of its residents being immigrants.
  3. Kuwait (73%) and Bahrain (55%) also feature prominently, showing a regional trend where nationals are a minority and foreign workers form the economic backbone
  4. Middle Eastern dominance in the top rankings highlights how the Gulf region’s economic model is heavily dependent on imported labor and expatriate populations.

42% of Nigeria’s applications have been rejected over the past 15 years amidst surging demand for Schengen visas
  • Nigerians submitted 1.1 million Schengen visa applications between 2009 and 2024.
  • The highest rejection rates occurred in 2017 (53%) and 2019 (51%).
  • A total of 491,844 applications were rejected, a cumulative denial rate of 42.1%.
  • Despite post-pandemic recovery, 2024 recorded the highest applications (111k), with a 45% rejection rate.
  • The year 2010 stands out as the period with the least number of Schengen visa applications submitted by the Nigerian consulate.

Comoros topped Schengen visa rejection rates in 2024 with 62.90%, despite Algeria leading globally by total denials of 185,101
  • Comoros leads with a striking 62.8% rejection rate, the highest not just among African consulates, but also the global consulate countries

  • Guinea-Bissau, Senegal, and Nigeria follow with rejection shares between 45% and 47%.

  • Despite having one of the highest total visa rejections globally, Algeria does not appear in this chart, as its rejection share is comparatively lower.

  • Countries with smaller applicant pools tend to have higher rejection rates, shedding light on access disparities and approval scrutiny in consulate processes.


In 2024, Algeria had the most Schengen visa rejections of any country. Right behind it were India and Turkey
  • Algeria recorded the highest number of Schengen visa denials in 2024, with 185,101 applications not issued, representing 35.0% of its total requests.
  • Six countries out of the top 15 global consulate countries with the highest visa denials were from Africa -Morocco, Nigeria, Egypt, Senegal, Tunisia, and Algeria.
  • Nigeria, Senegal, and Pakistan showed alarmingly high rejection rates, each with over 45% of visa applications refused.
  • Collectively, over 1.7 million Schengen visa applications were not issued worldwide in 2024.
  • European consulates located in African and Asian countries made up a significant share of the rejections.

Eritrea's net migration rate in 2024 is over 40 times lower (in absolute terms) than Nigeria's net migration rate
  • Eritrea has the highest net migration loss in Africa at -8.7 per 1,000 people.
  • Nigeria's net migration rate of -0.2 is significantly lower than any country in the top 10 list.
  • Sao Tome and Principe and Eswatini follow Eritrea with rates of -6.5 and -6.0, respectively.
  • Lesotho also experiences substantial out-migration, with a net rate of -4.5 per 1,000.
  • Three countries—Rwanda, Uganda, and CAR—have the same net migration rate of -3.1.

POPULAR TOPICS
SIGN UP TO OUR NEWSLETTER
Get periodic updates about the African startup space, access to our reports, among others.
Subscribe Here
Subscription Form

A product of Techpoint Africa. All rights reserved