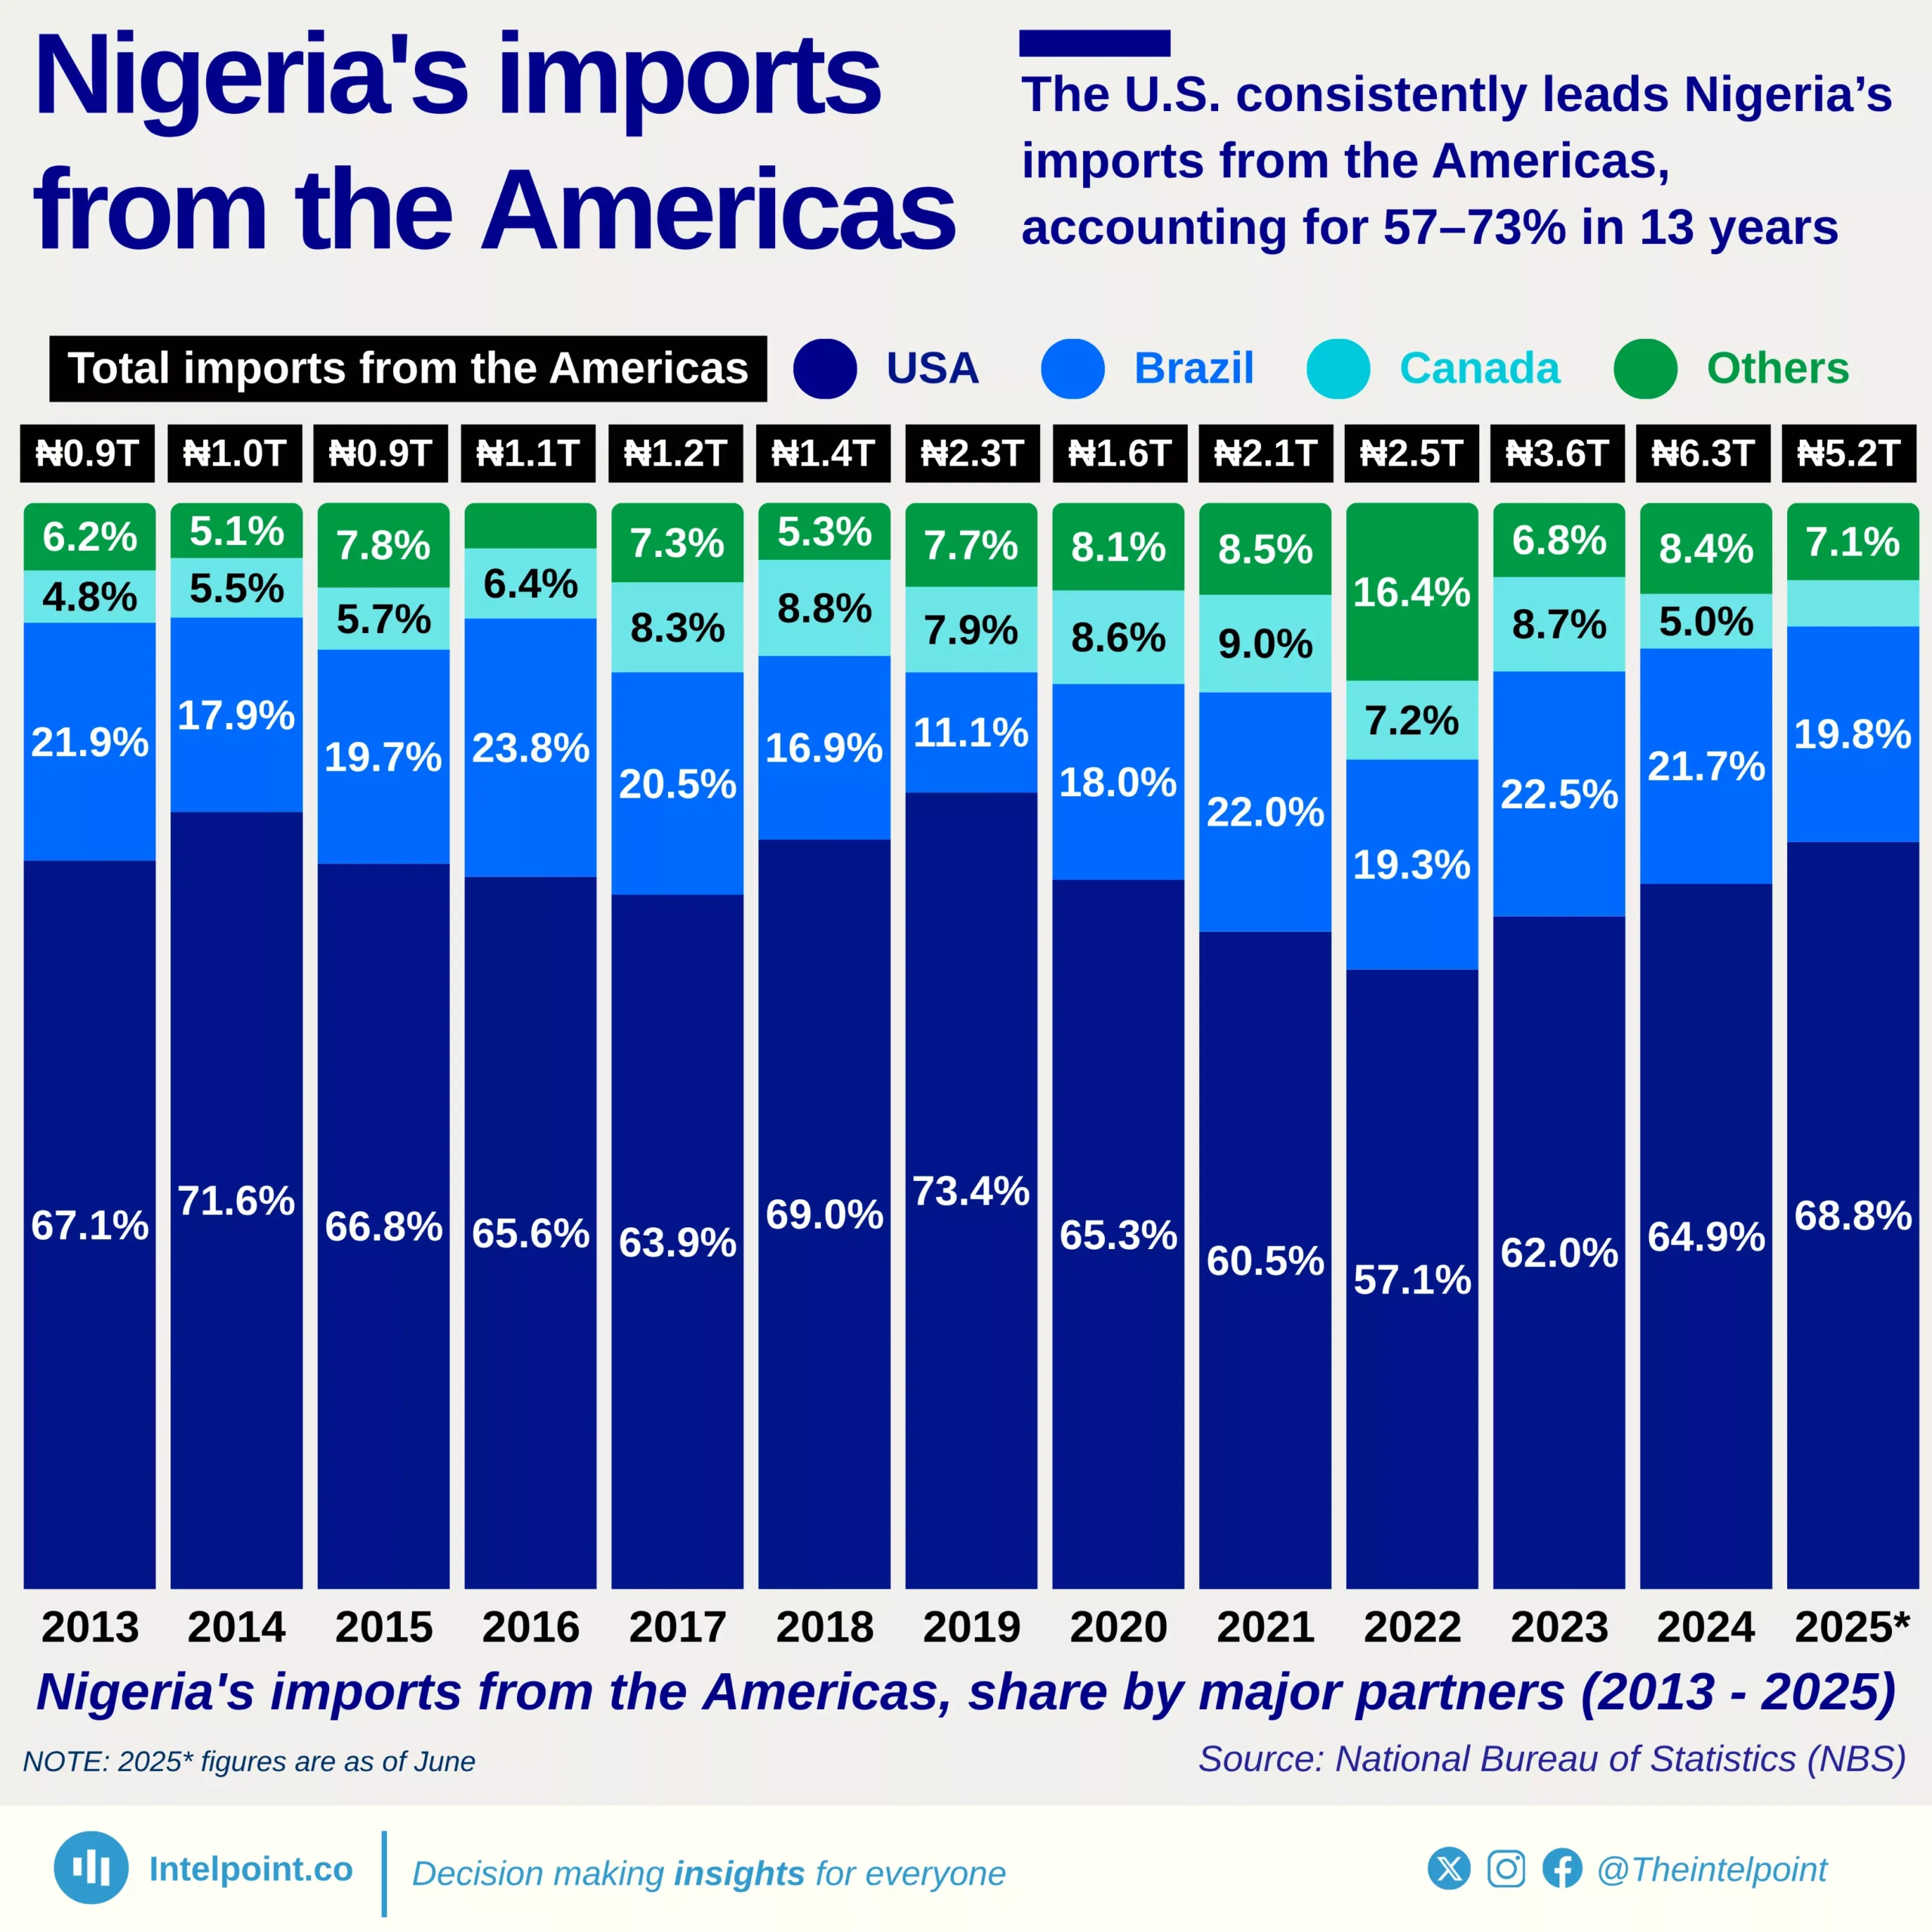
The U.S. consistently leads Nigeria’s imports from the Americas, accounting for 57–73% in 13 years

  • The U.S. consistently leads Nigeria’s imports from the Americas, accounting for 57–73% between 2013 and 2025.
  • Brazil ranks second, with shares ranging between 11% and 24%, highlighting its steady trade ties with Nigeria.
  • During the period, the combined share of the U.S. and Brazil never fell below 76%, even at its lowest point in 2022.
  • Total imports from the Americas surged from ₦0.9 trillion in 2013 to a peak of ₦6.3 trillion in 2024.
  • Canada’s import share peaked at 16.4% in 2022, showing a rare moment of diversification.

Nigeria’s import relationship with countries across the Americas has been primarily shaped by two dominant players, the United States and Brazil. Over the last decade, these two countries have consistently accounted for a combined 76%- 90% of Nigeria’s total imports from the region. Even in 2022, when their joint share reached its lowest level, they still made up 76% of imports, underlining their lasting importance in Nigeria’s transatlantic trade. Total imports from the Americas grew from ₦0.9 trillion in 2013 to ₦6.3 trillion in 2024.
Source:

National Bureau of Statistics

Period:

2013-H1 2025
HTML code to embed chart
Want a bespoke report?
Reach out
Tags
Related Insights

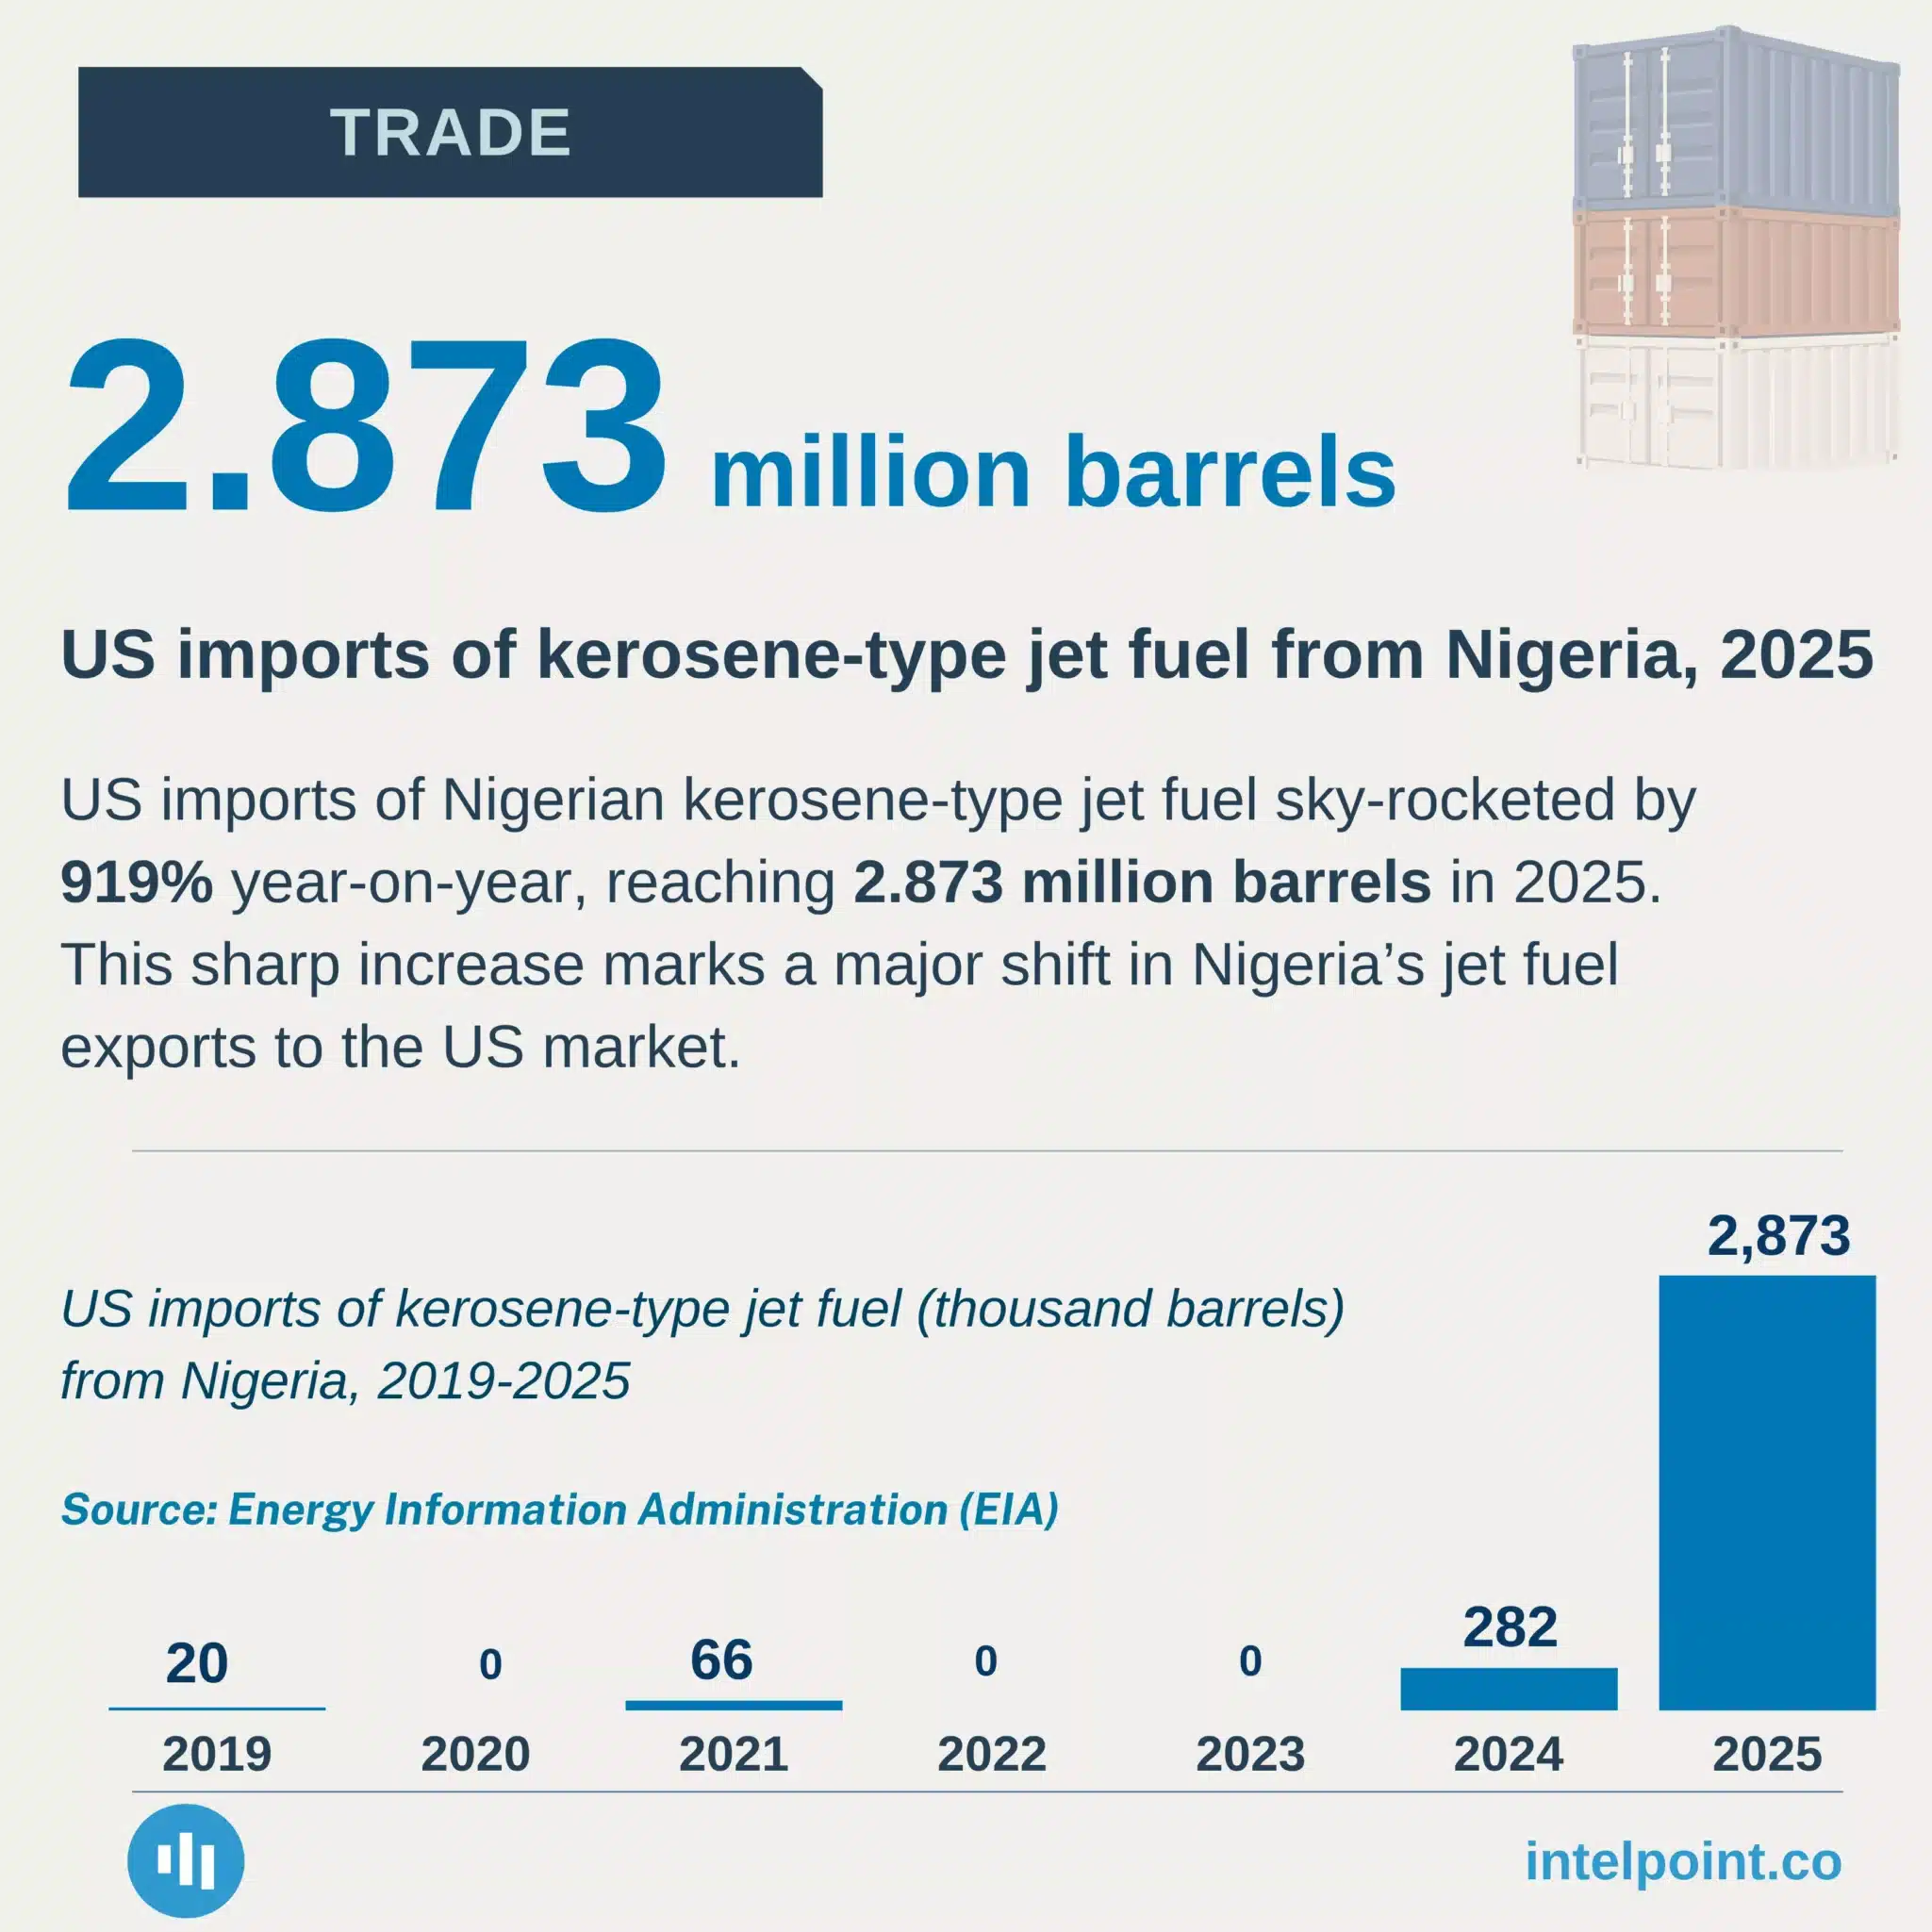
US imports of Nigerian kerosene-type jet fuel sky-rocketed by 919% year-on-year
  • Nigerian jet fuel exports to the U.S. jumped 10-fold to 2.87 million barrels in 2025.
  • Just 86,000 barrels were imported across the U.S. from Nigeria between 1993 and 2023.
  • The 2025 surge was concentrated in five months, amid East Coast refinery disruptions.
  • No Nigerian jet fuel imports were recorded through August 2026, suggesting the surge was temporary.

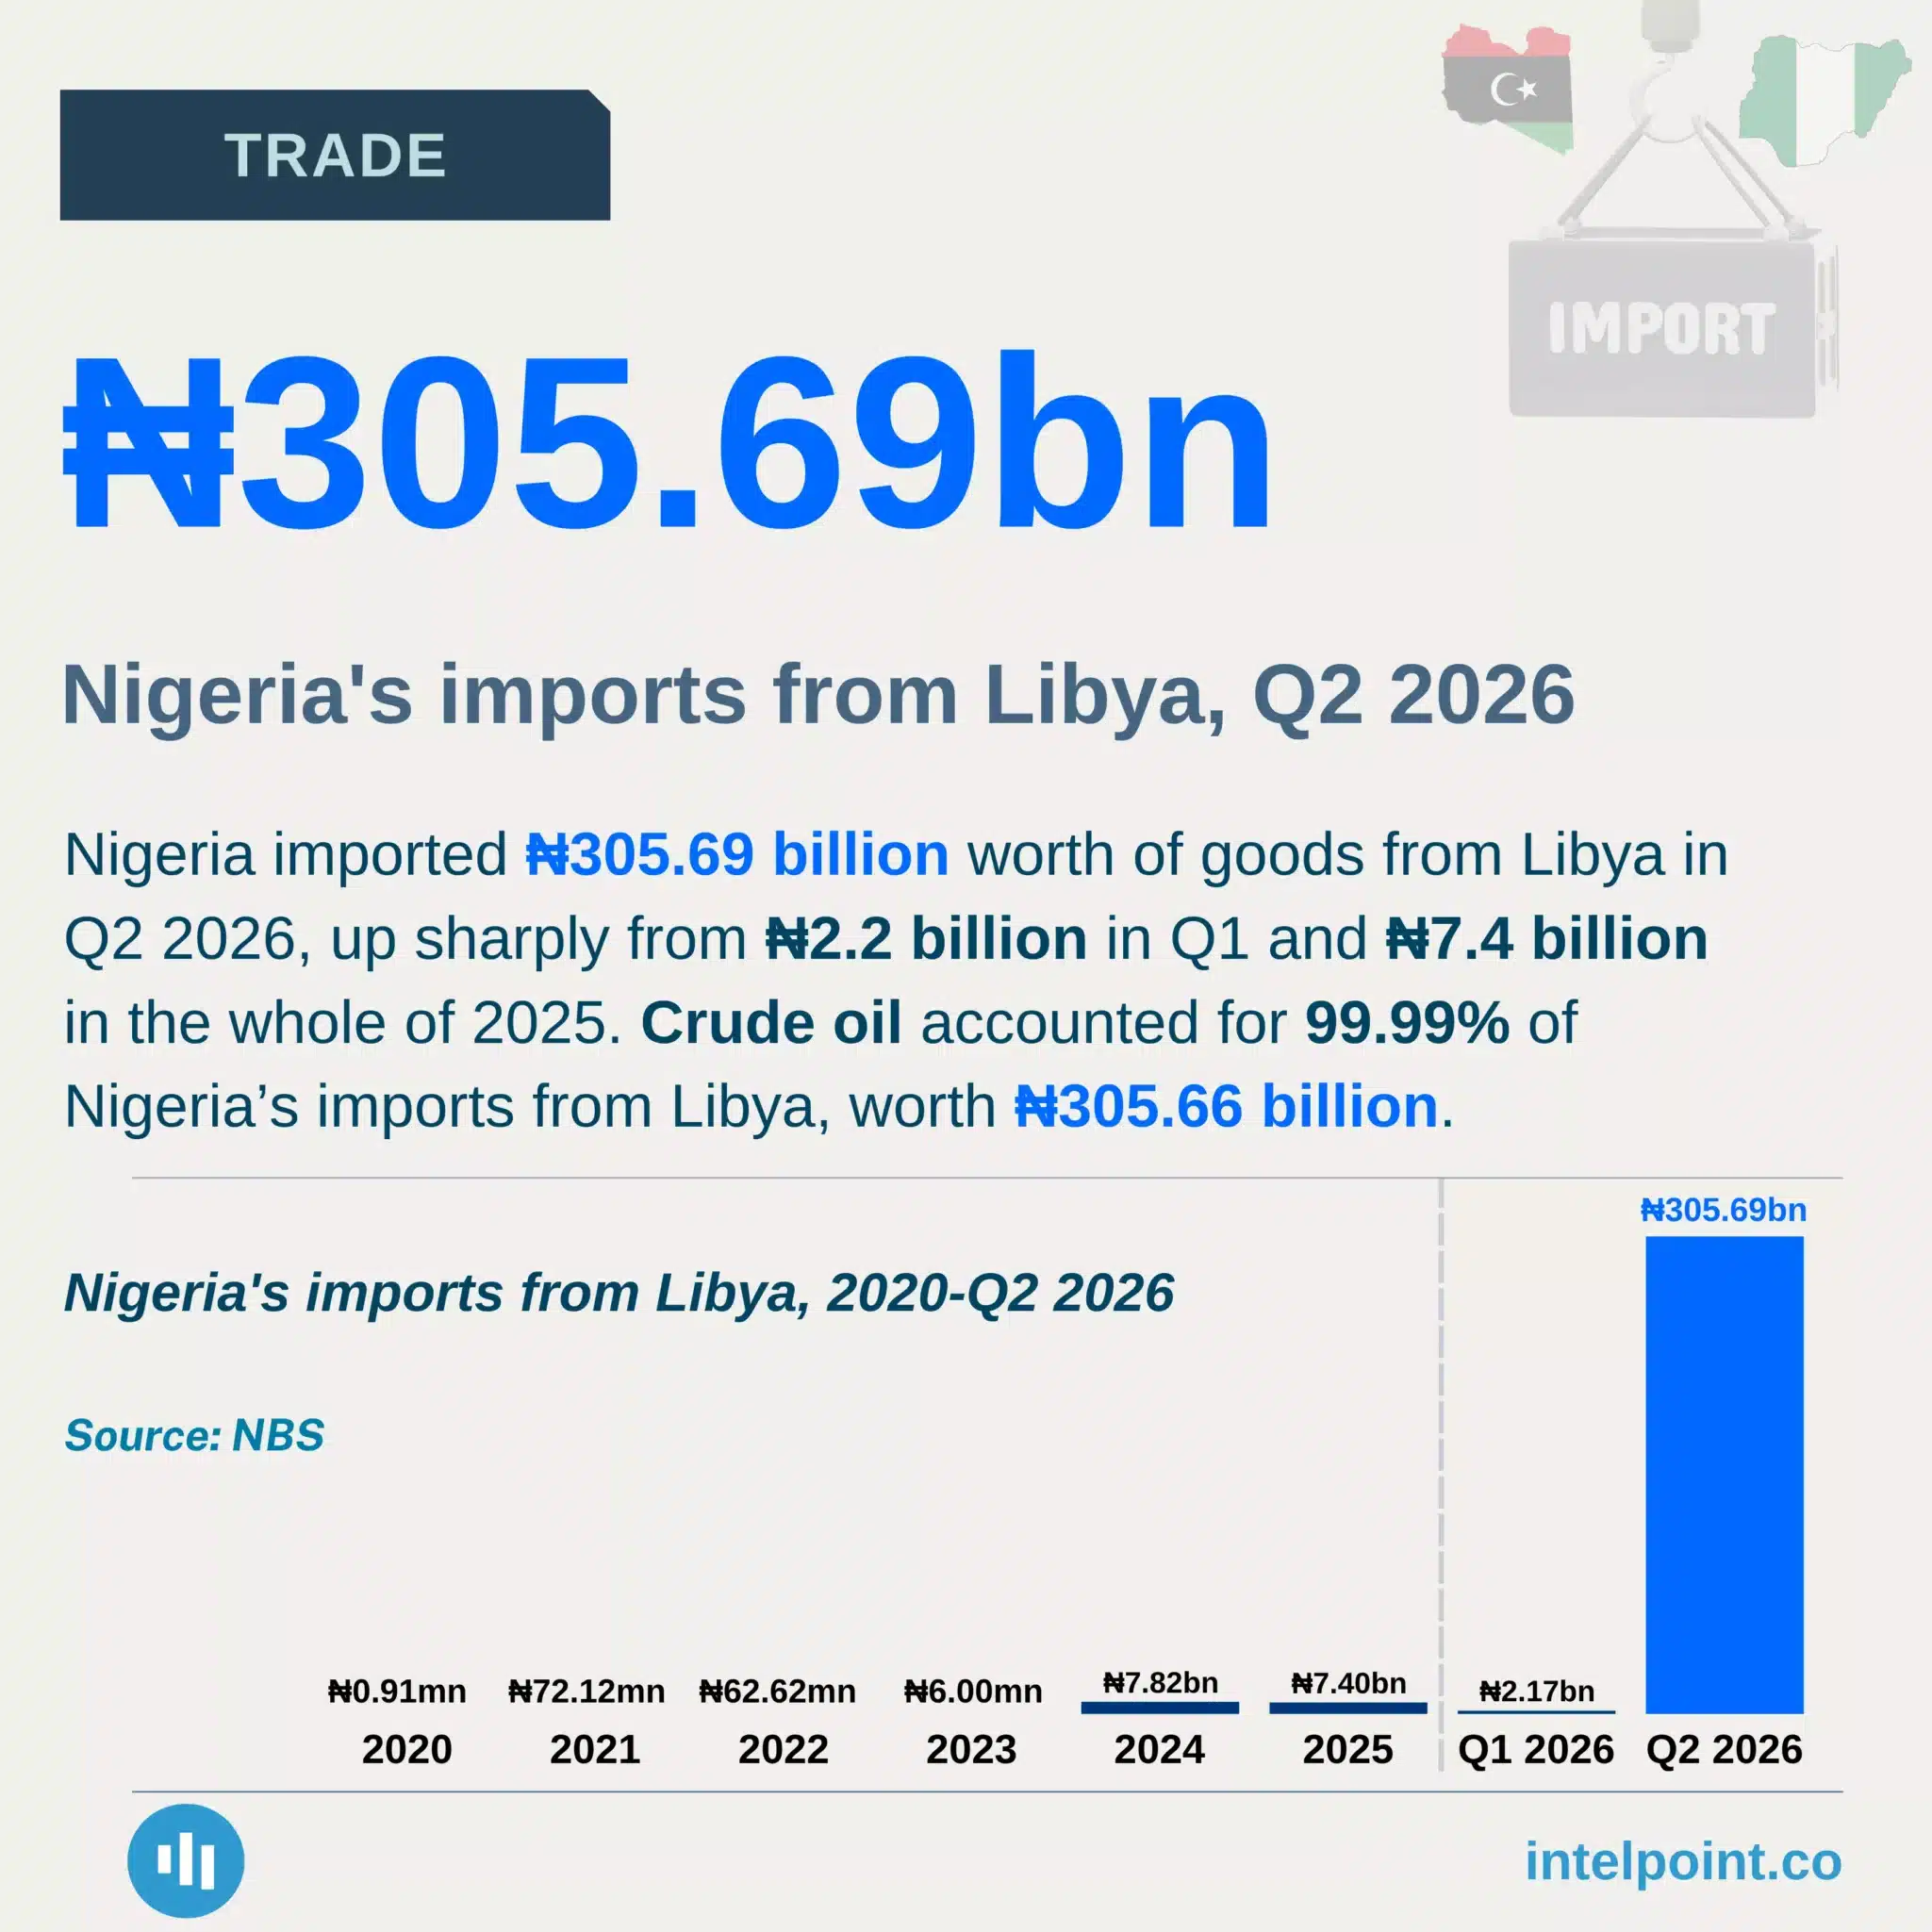
Nigeria bought ₦305.66 billion worth of crude oil from Libya in Q2 2026
  • Nigeria imported ₦305.69bn from Libya in Q2 2026, up from ₦2.17bn in Q1.
  • Crude oil accounted for 99.99% of Q2 imports, worth ₦305.66bn.
  • Libya’s Q2 exports to Nigeria surged from ₦7.4bn in 2025 to ₦305.69bn.
  • Libya became Nigeria’s ninth-largest import source, accounting for 2.12% of total imports in Q2.
  • Nigeria’s imports from Libya were previously dominated by much smaller values, with crude oil driving the sharp 2026 increase.

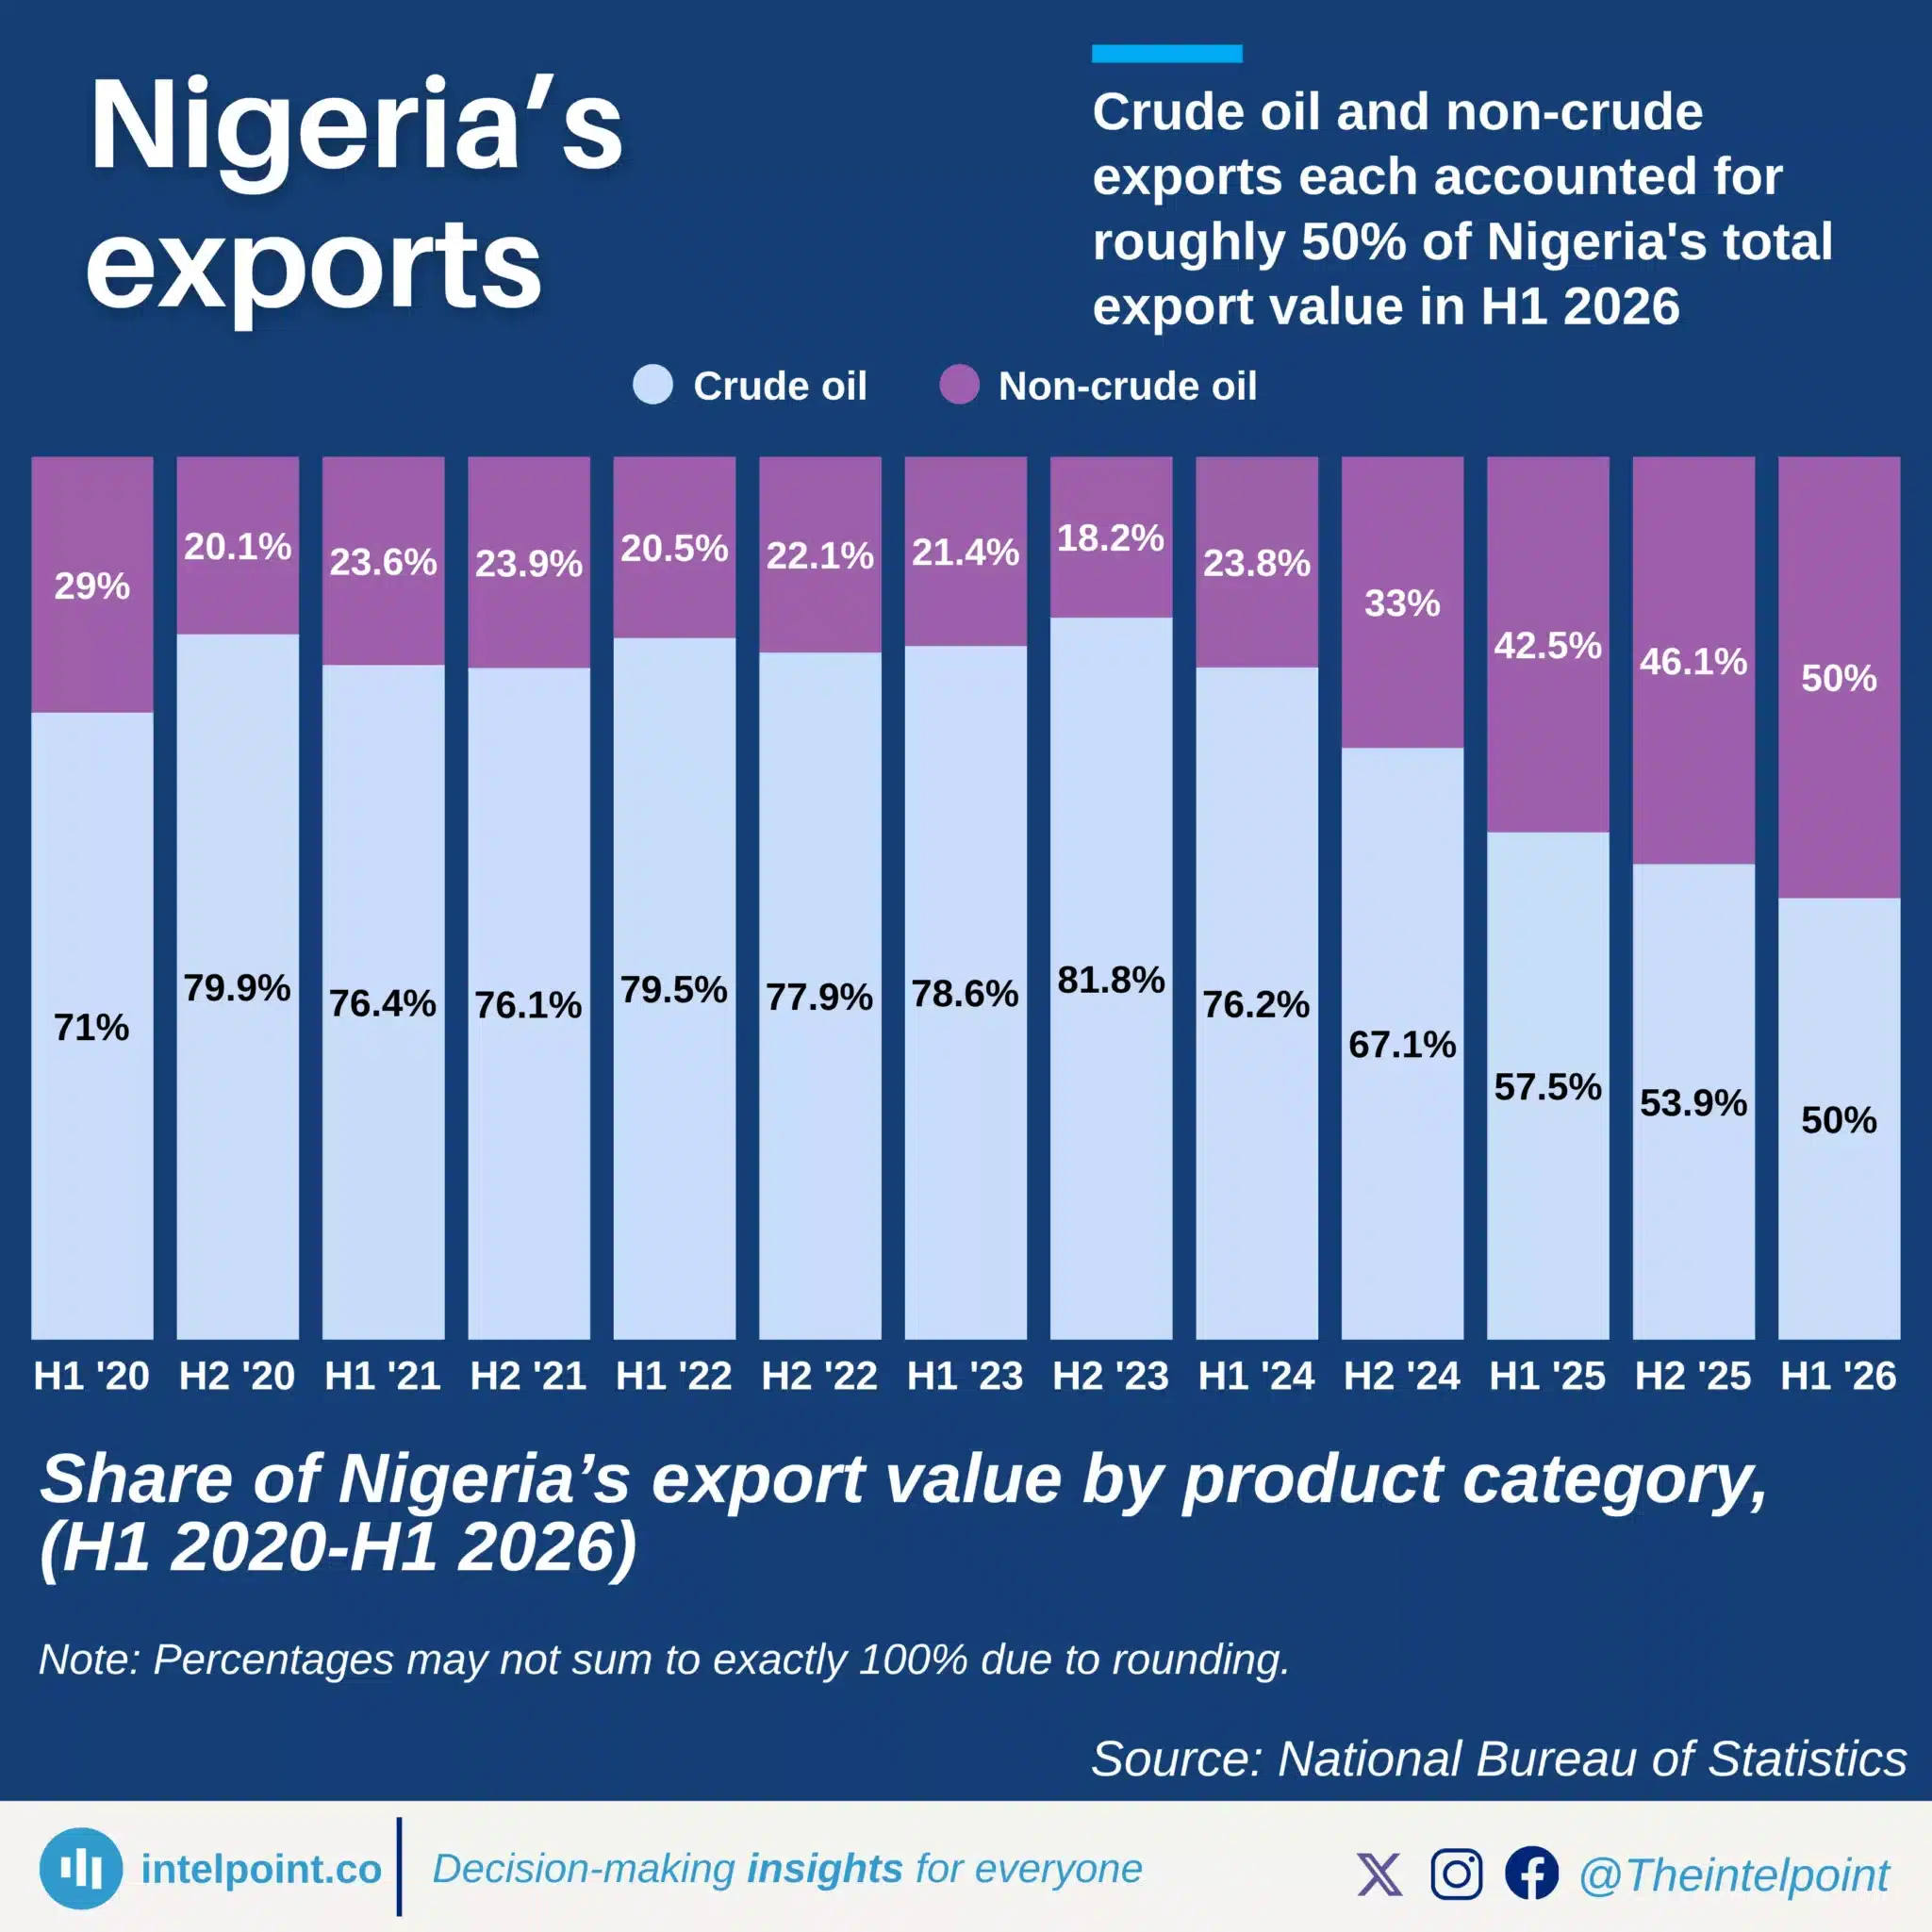
Crude oil and non-crude exports each accounted for roughly 50% of Nigeria's total export value in H1 2026
  • Nigeria’s crude and non-crude exports were nearly equal in H1 2026, at ₦24.1tn and ₦24tn, respectively.
  • Non-crude exports overtook crude in Q2 for the first time in at least six years, reaching ₦14.11tn.
  • Petroleum products and natural gas dominate non-crude exports, while non-oil exports accounted for just 13.8% of Q2 exports.
  • Nigeria’s export mix is shifting, but remains heavily dependent on hydrocarbons.

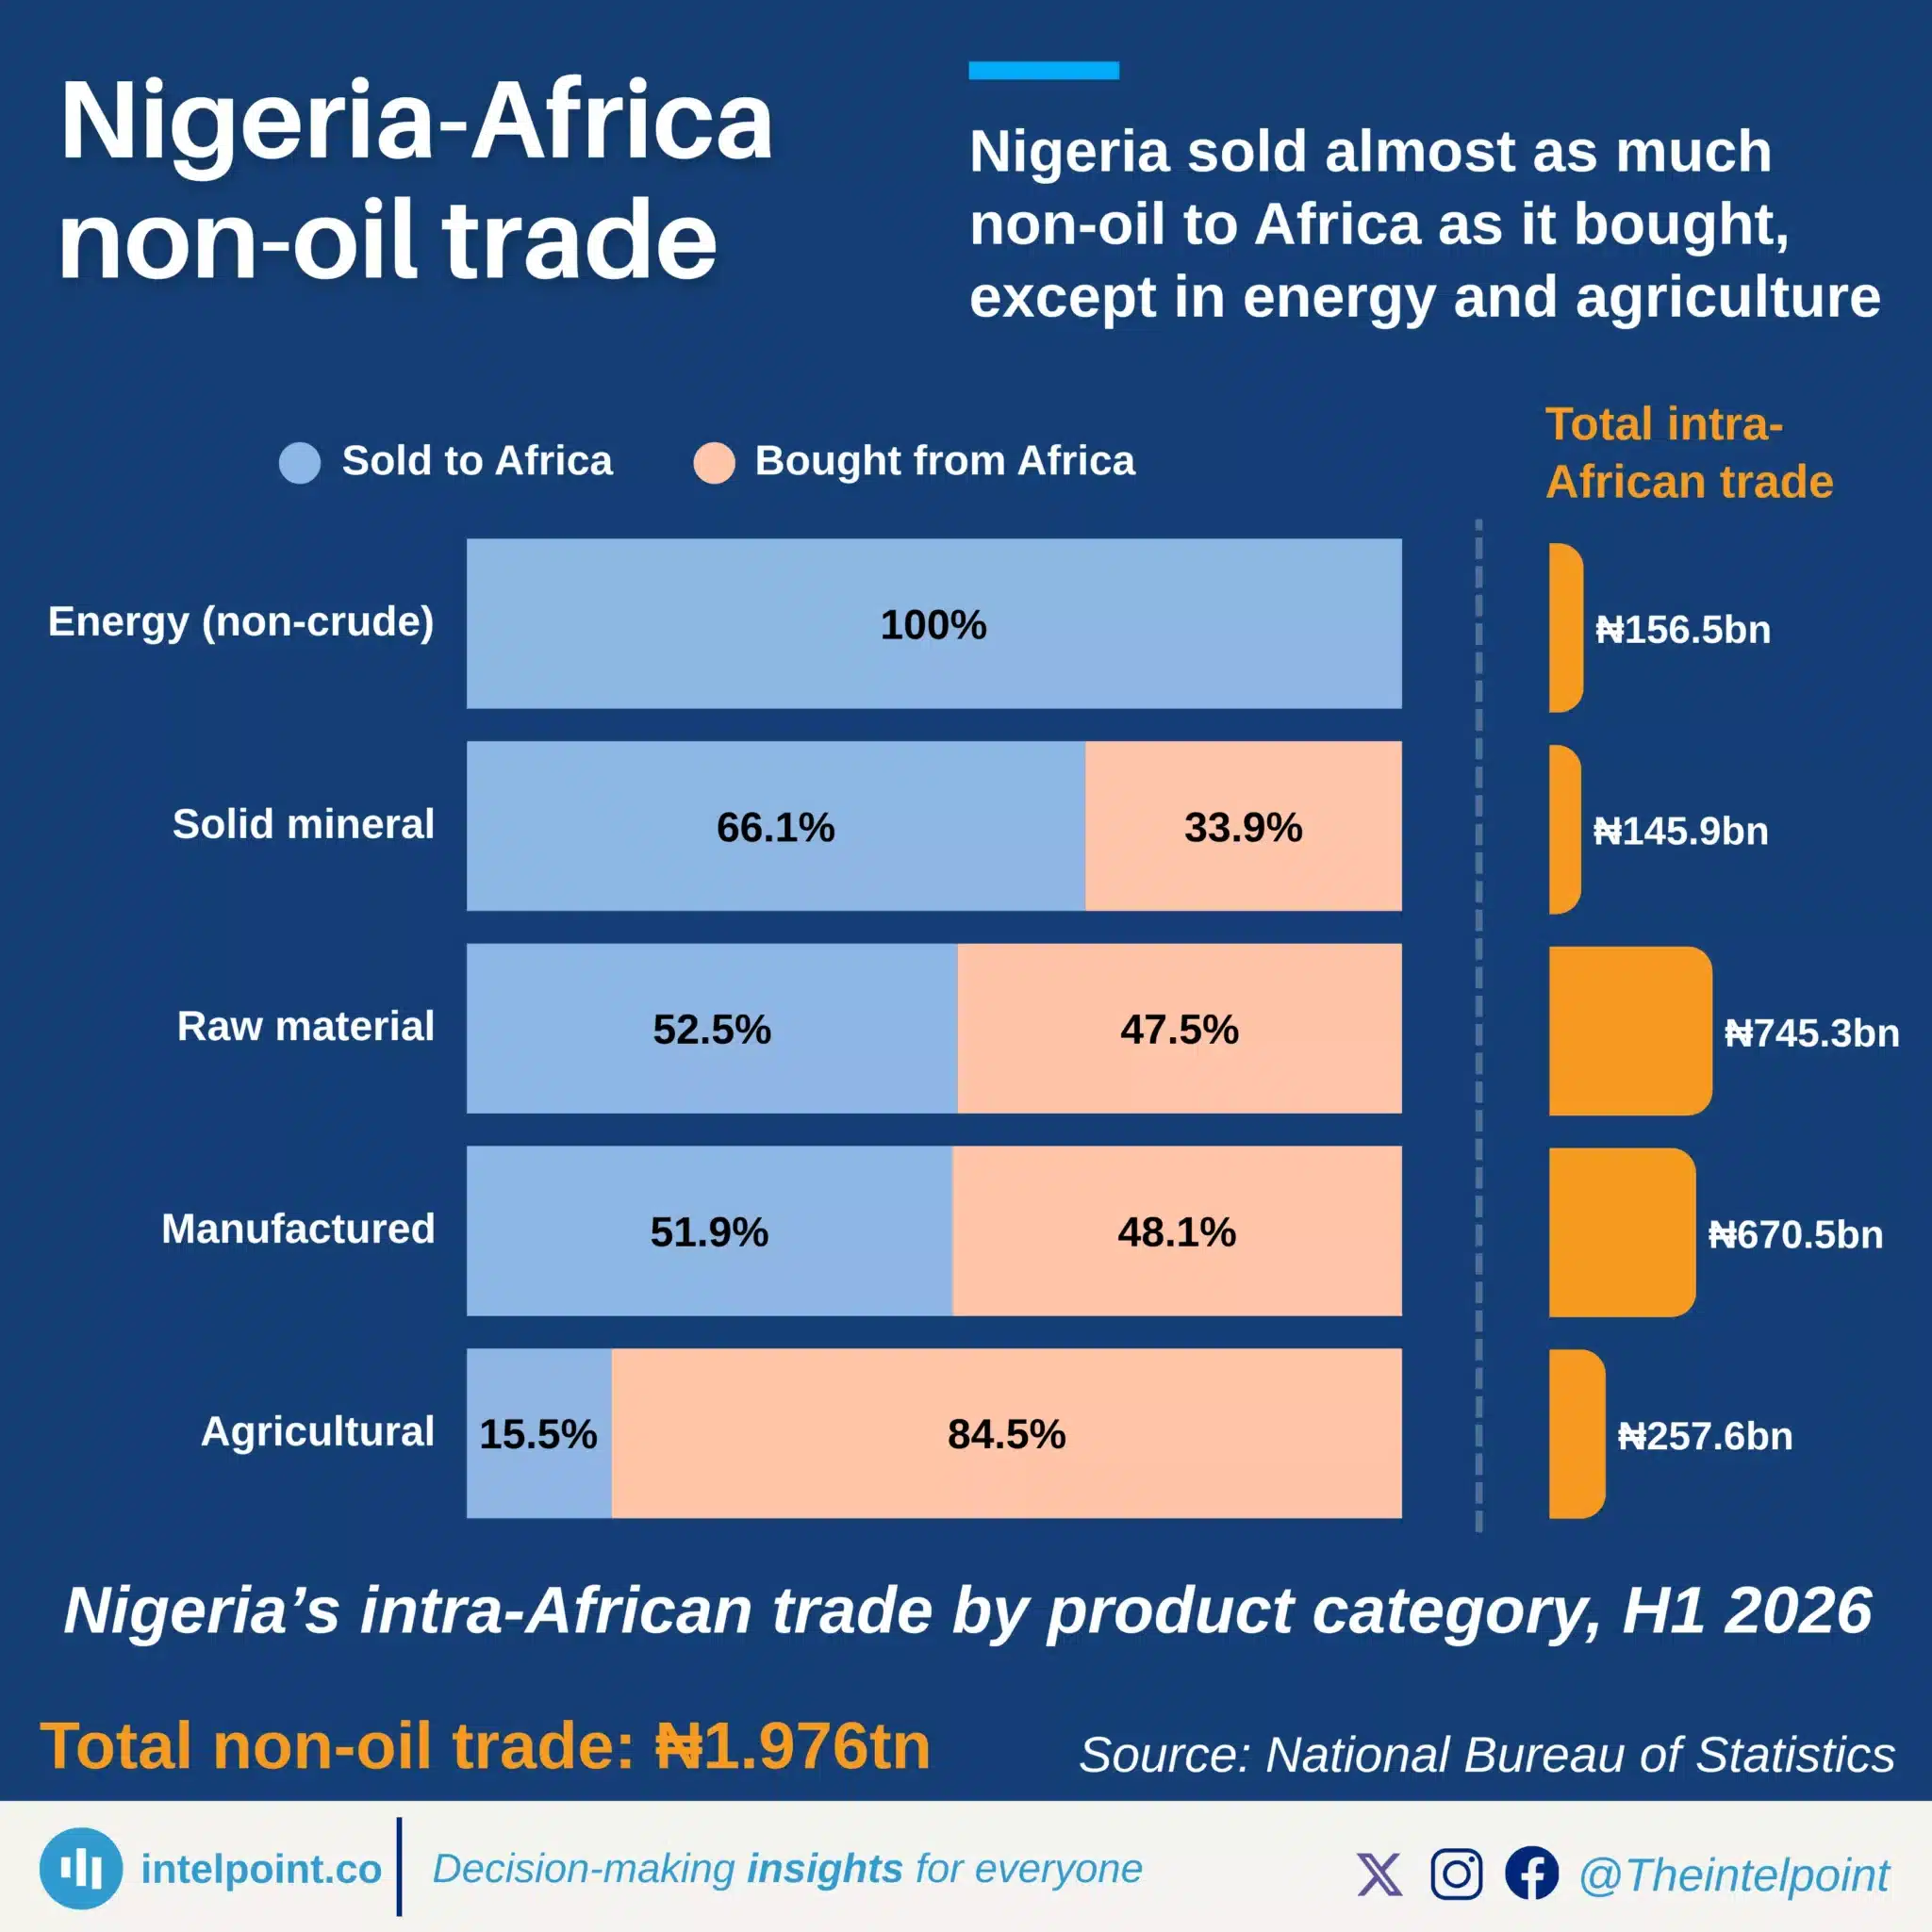
Nigeria sold almost as much non-oil to Africa as it bought, except in energy and agriculture
  • Nigeria’s non-oil trade with Africa was nearly balanced, with an ₦88bn surplus on almost ₦2tn of trade in H1 2026.
  • Energy trade was entirely export-led, with Nigeria selling ₦156.5bn and recording no imports.
  • Solid minerals also leaned towards exports, with sales making up 66.1% of category trade.
  • Agriculture ran a large deficit, as imports accounted for 84.5% of trade and exceeded exports by ₦178bn.
  • Nigeria’s agricultural trade deficit widened sharply, from ₦59bn in Q1 to ₦119bn in Q2.

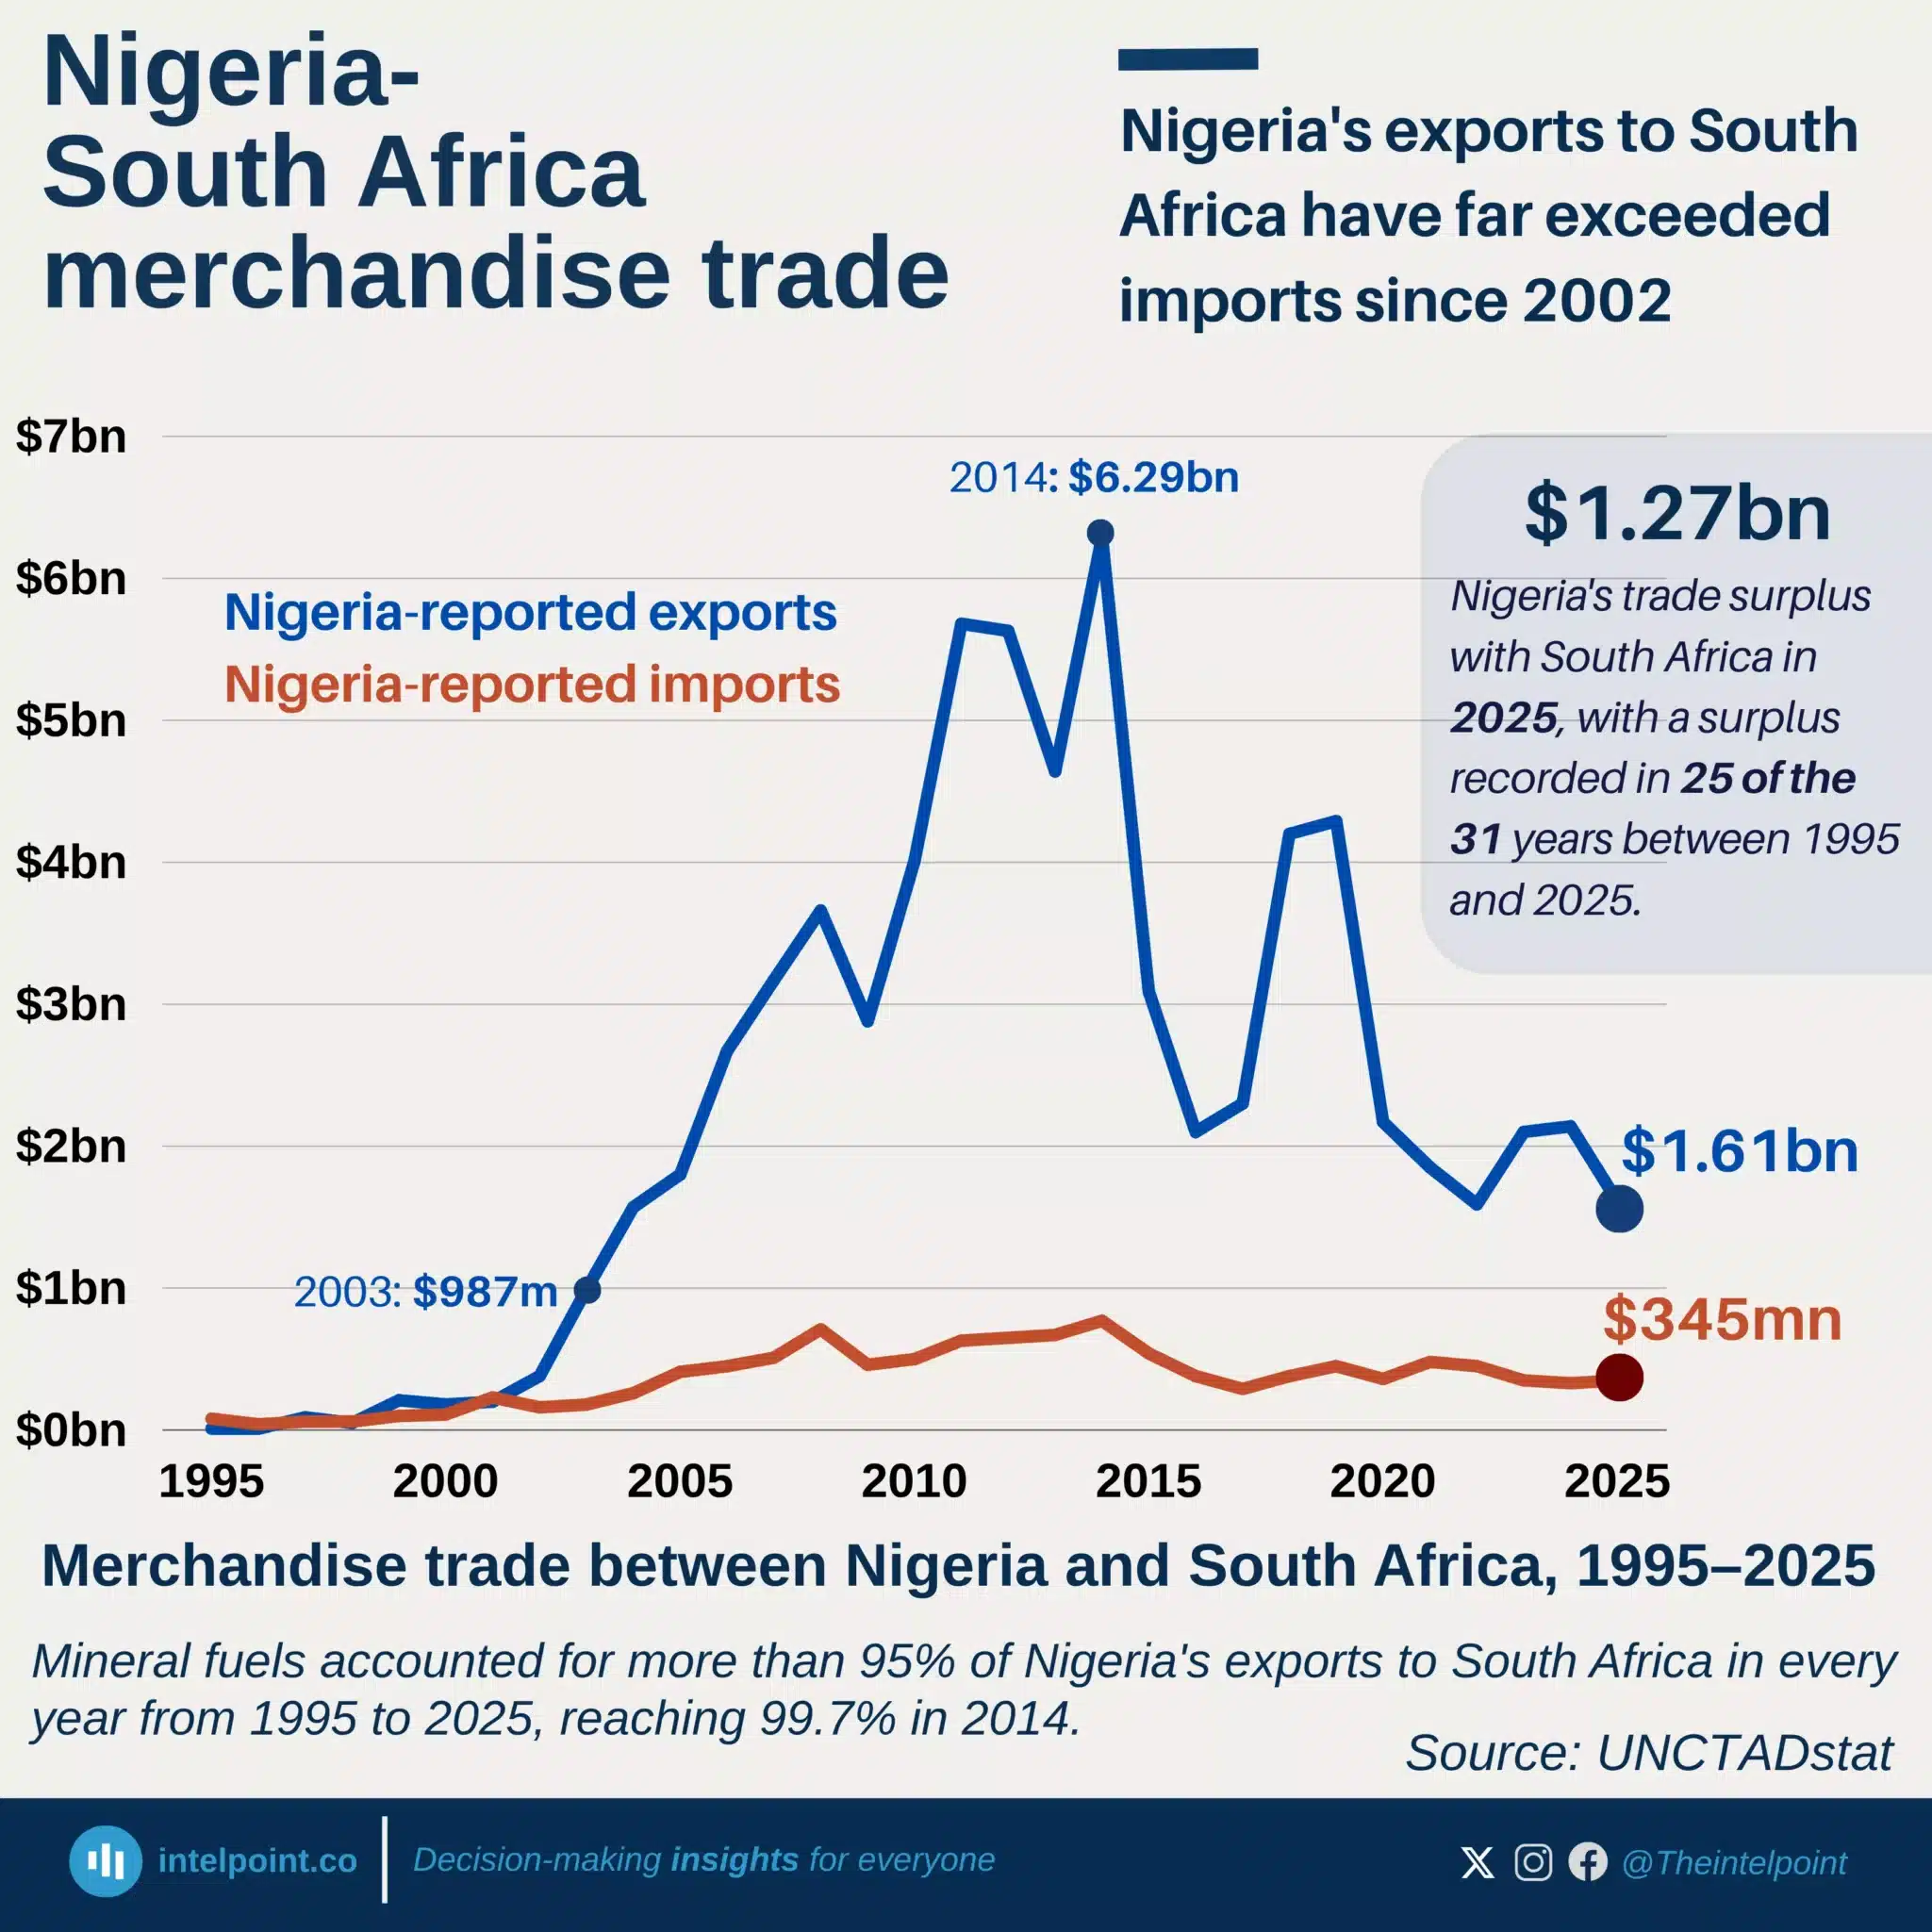
Nigeria's exports to South Africa have far exceeded imports since 2002
  • Nigeria has exported more to South Africa than it has imported every year since 2002.
  • Exports peaked at $6.29 billion in 2014, driven almost entirely by mineral fuels.
  • Imports from South Africa have remained below $1 billion annually.
  • Nigeria recorded a $1.27 billion trade surplus with South Africa in 2025.
  • Mineral fuels made up over 95% of Nigeria's exports throughout 1995-2025.

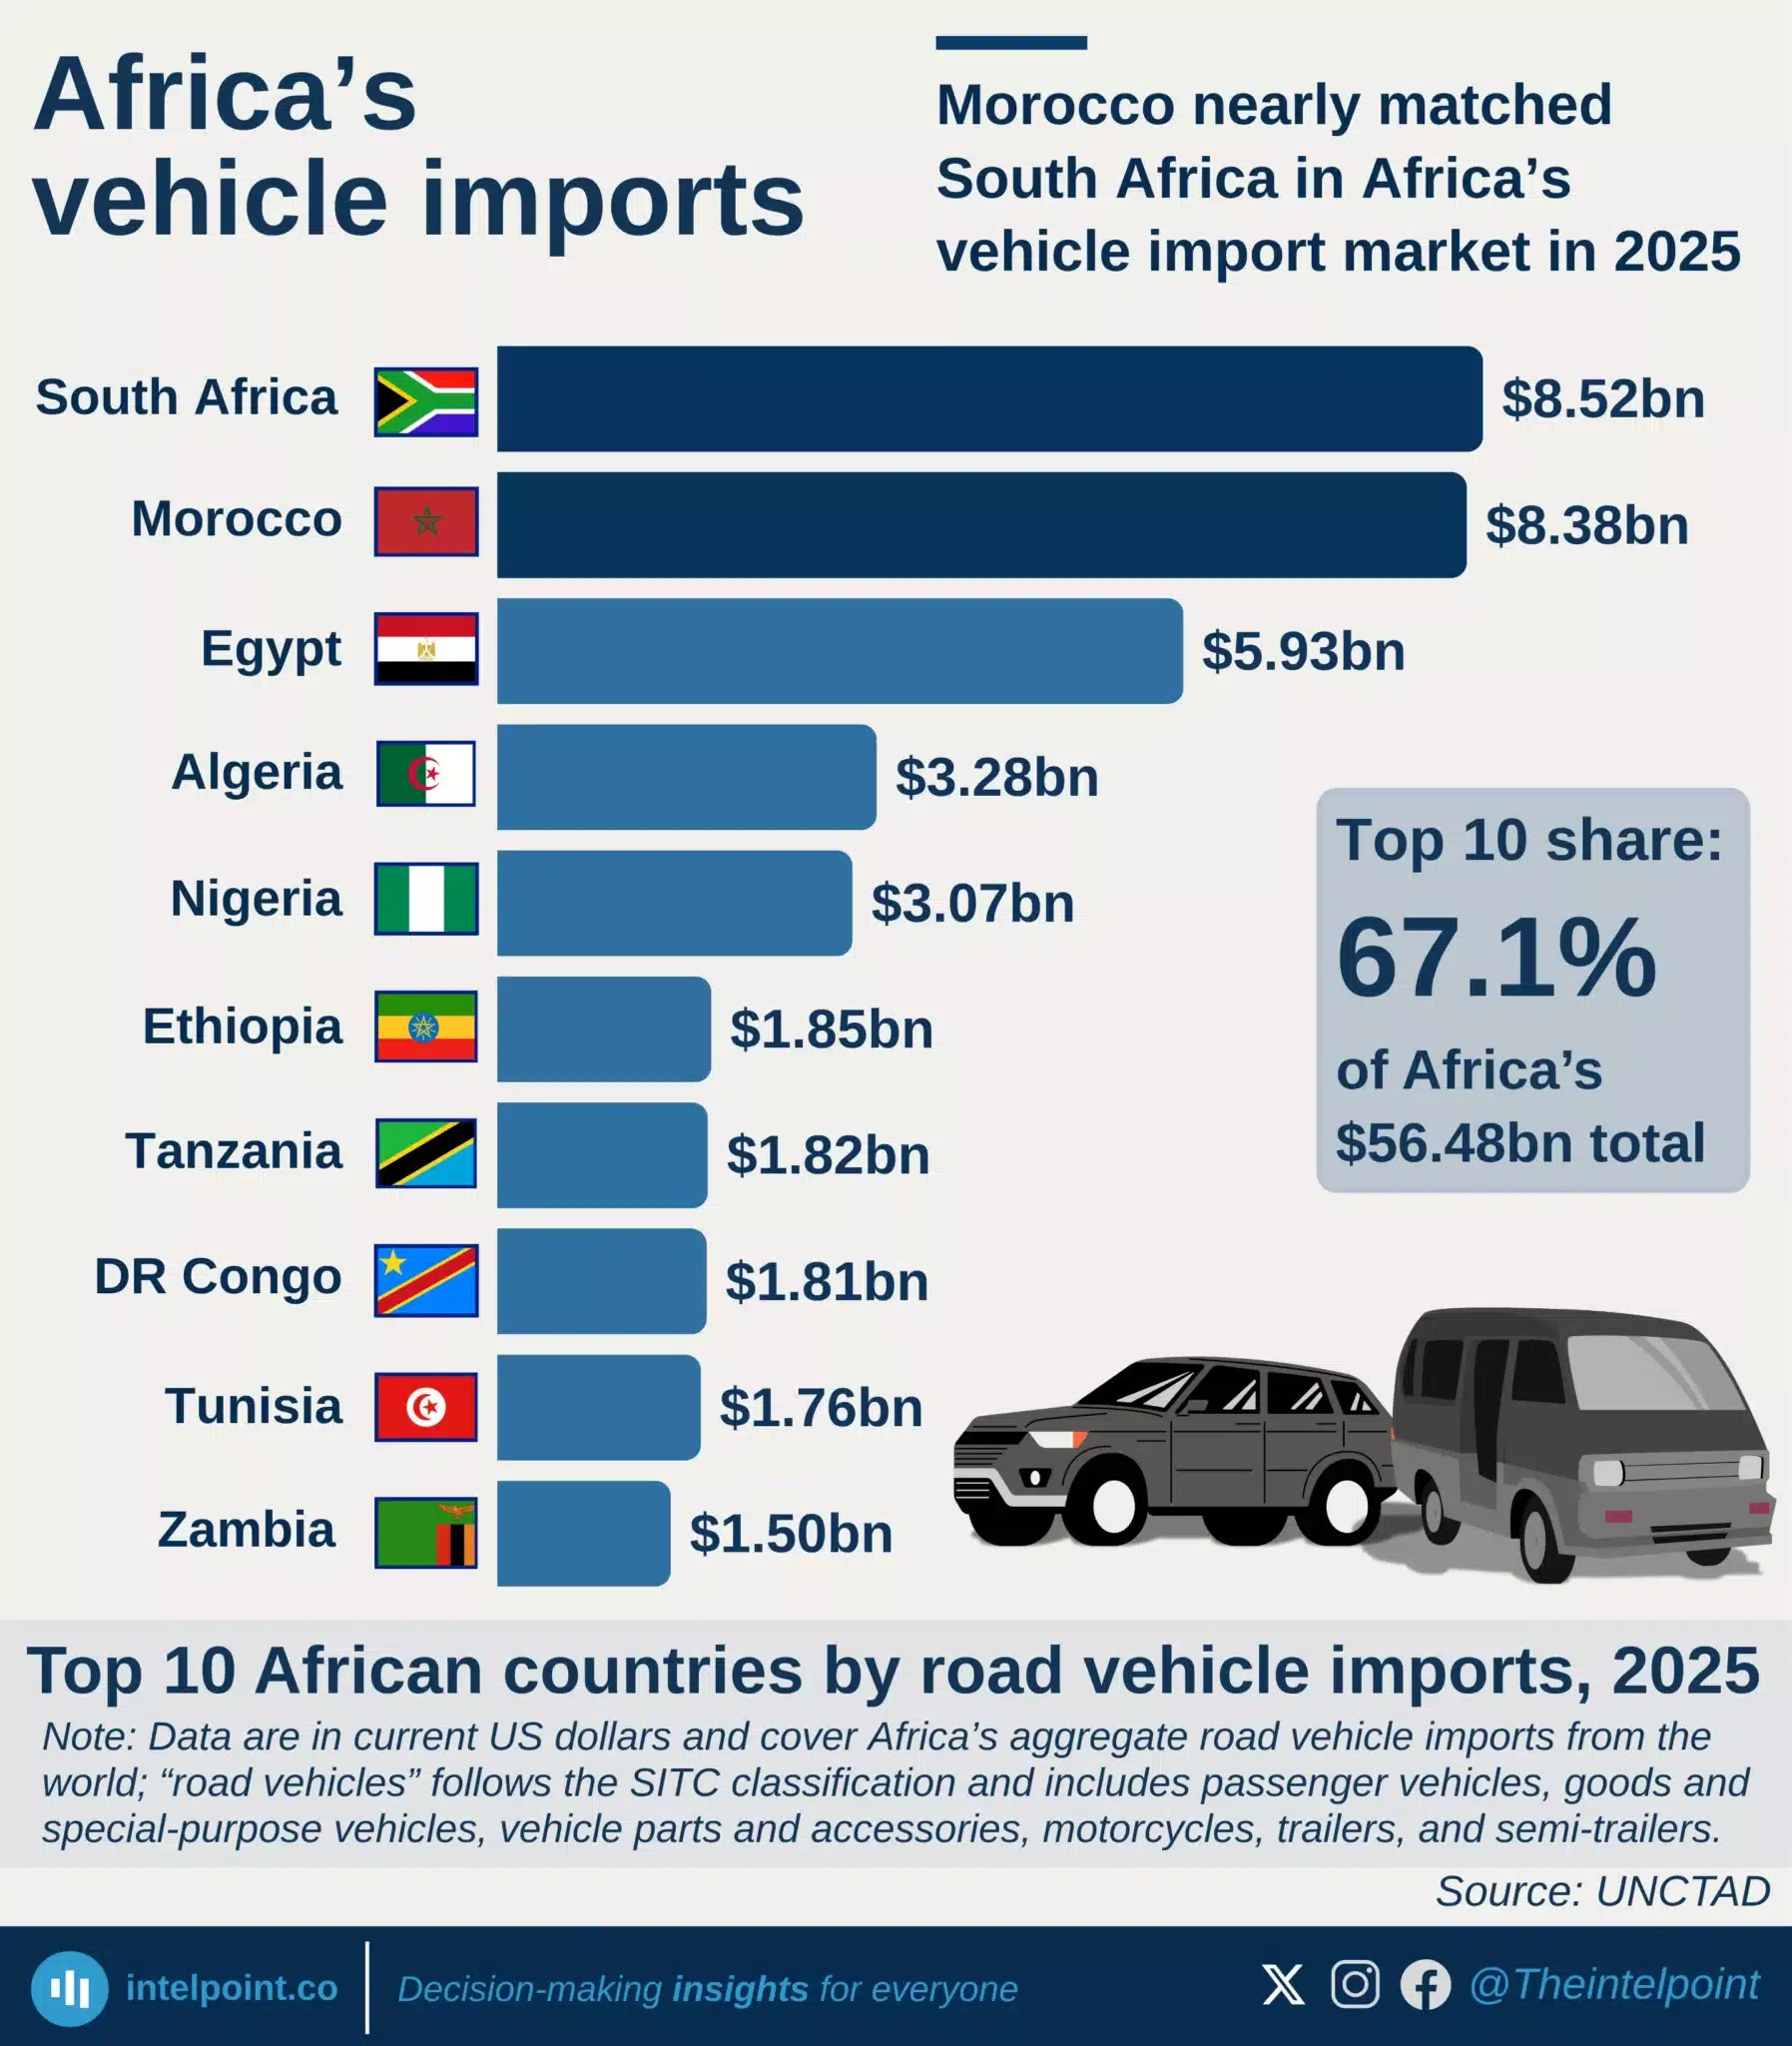
Morocco nearly matched South Africa in Africa’s vehicle import market in 2025
  • South Africa led with $8.52 billion, only $140 million ahead of Morocco.
  • Morocco’s imports have grown steadily, while South Africa’s 2025 figure was a recovery toward its 2012 peak.
  • Egypt ranked third, followed by Algeria and Nigeria.
  • The top 10 markets accounted for 67.1% of Africa’s $56.48 billion total.
  • Road vehicle imports include vehicles, parts, motorcycles, trailers, and semi-trailers.

POPULAR TOPICS
SIGN UP TO OUR NEWSLETTER
Get periodic updates about the African startup space, access to our reports, among others.
Subscribe Here
Subscription Form

A product of Techpoint Africa. All rights reserved