The importation of goods made up over 60% of Kenya's bank credit facilities in the first half of 2024

Key takeaways:

  • Over 60% of Kenya’s bank loans for foreign trade were used to fund imports, limiting resources for exports.
  • In all six months, exports received less than 40% of the credit allocation, highlighting a significant gap.
  • Import credit peaked at 66.23% in June
  • The import-export credit ratio remained relatively stable, suggesting an ongoing structural trend in trade financing.
  • To balance trade, policies could focus on enhancing export production, incentives for exporters, and easing export credit access.

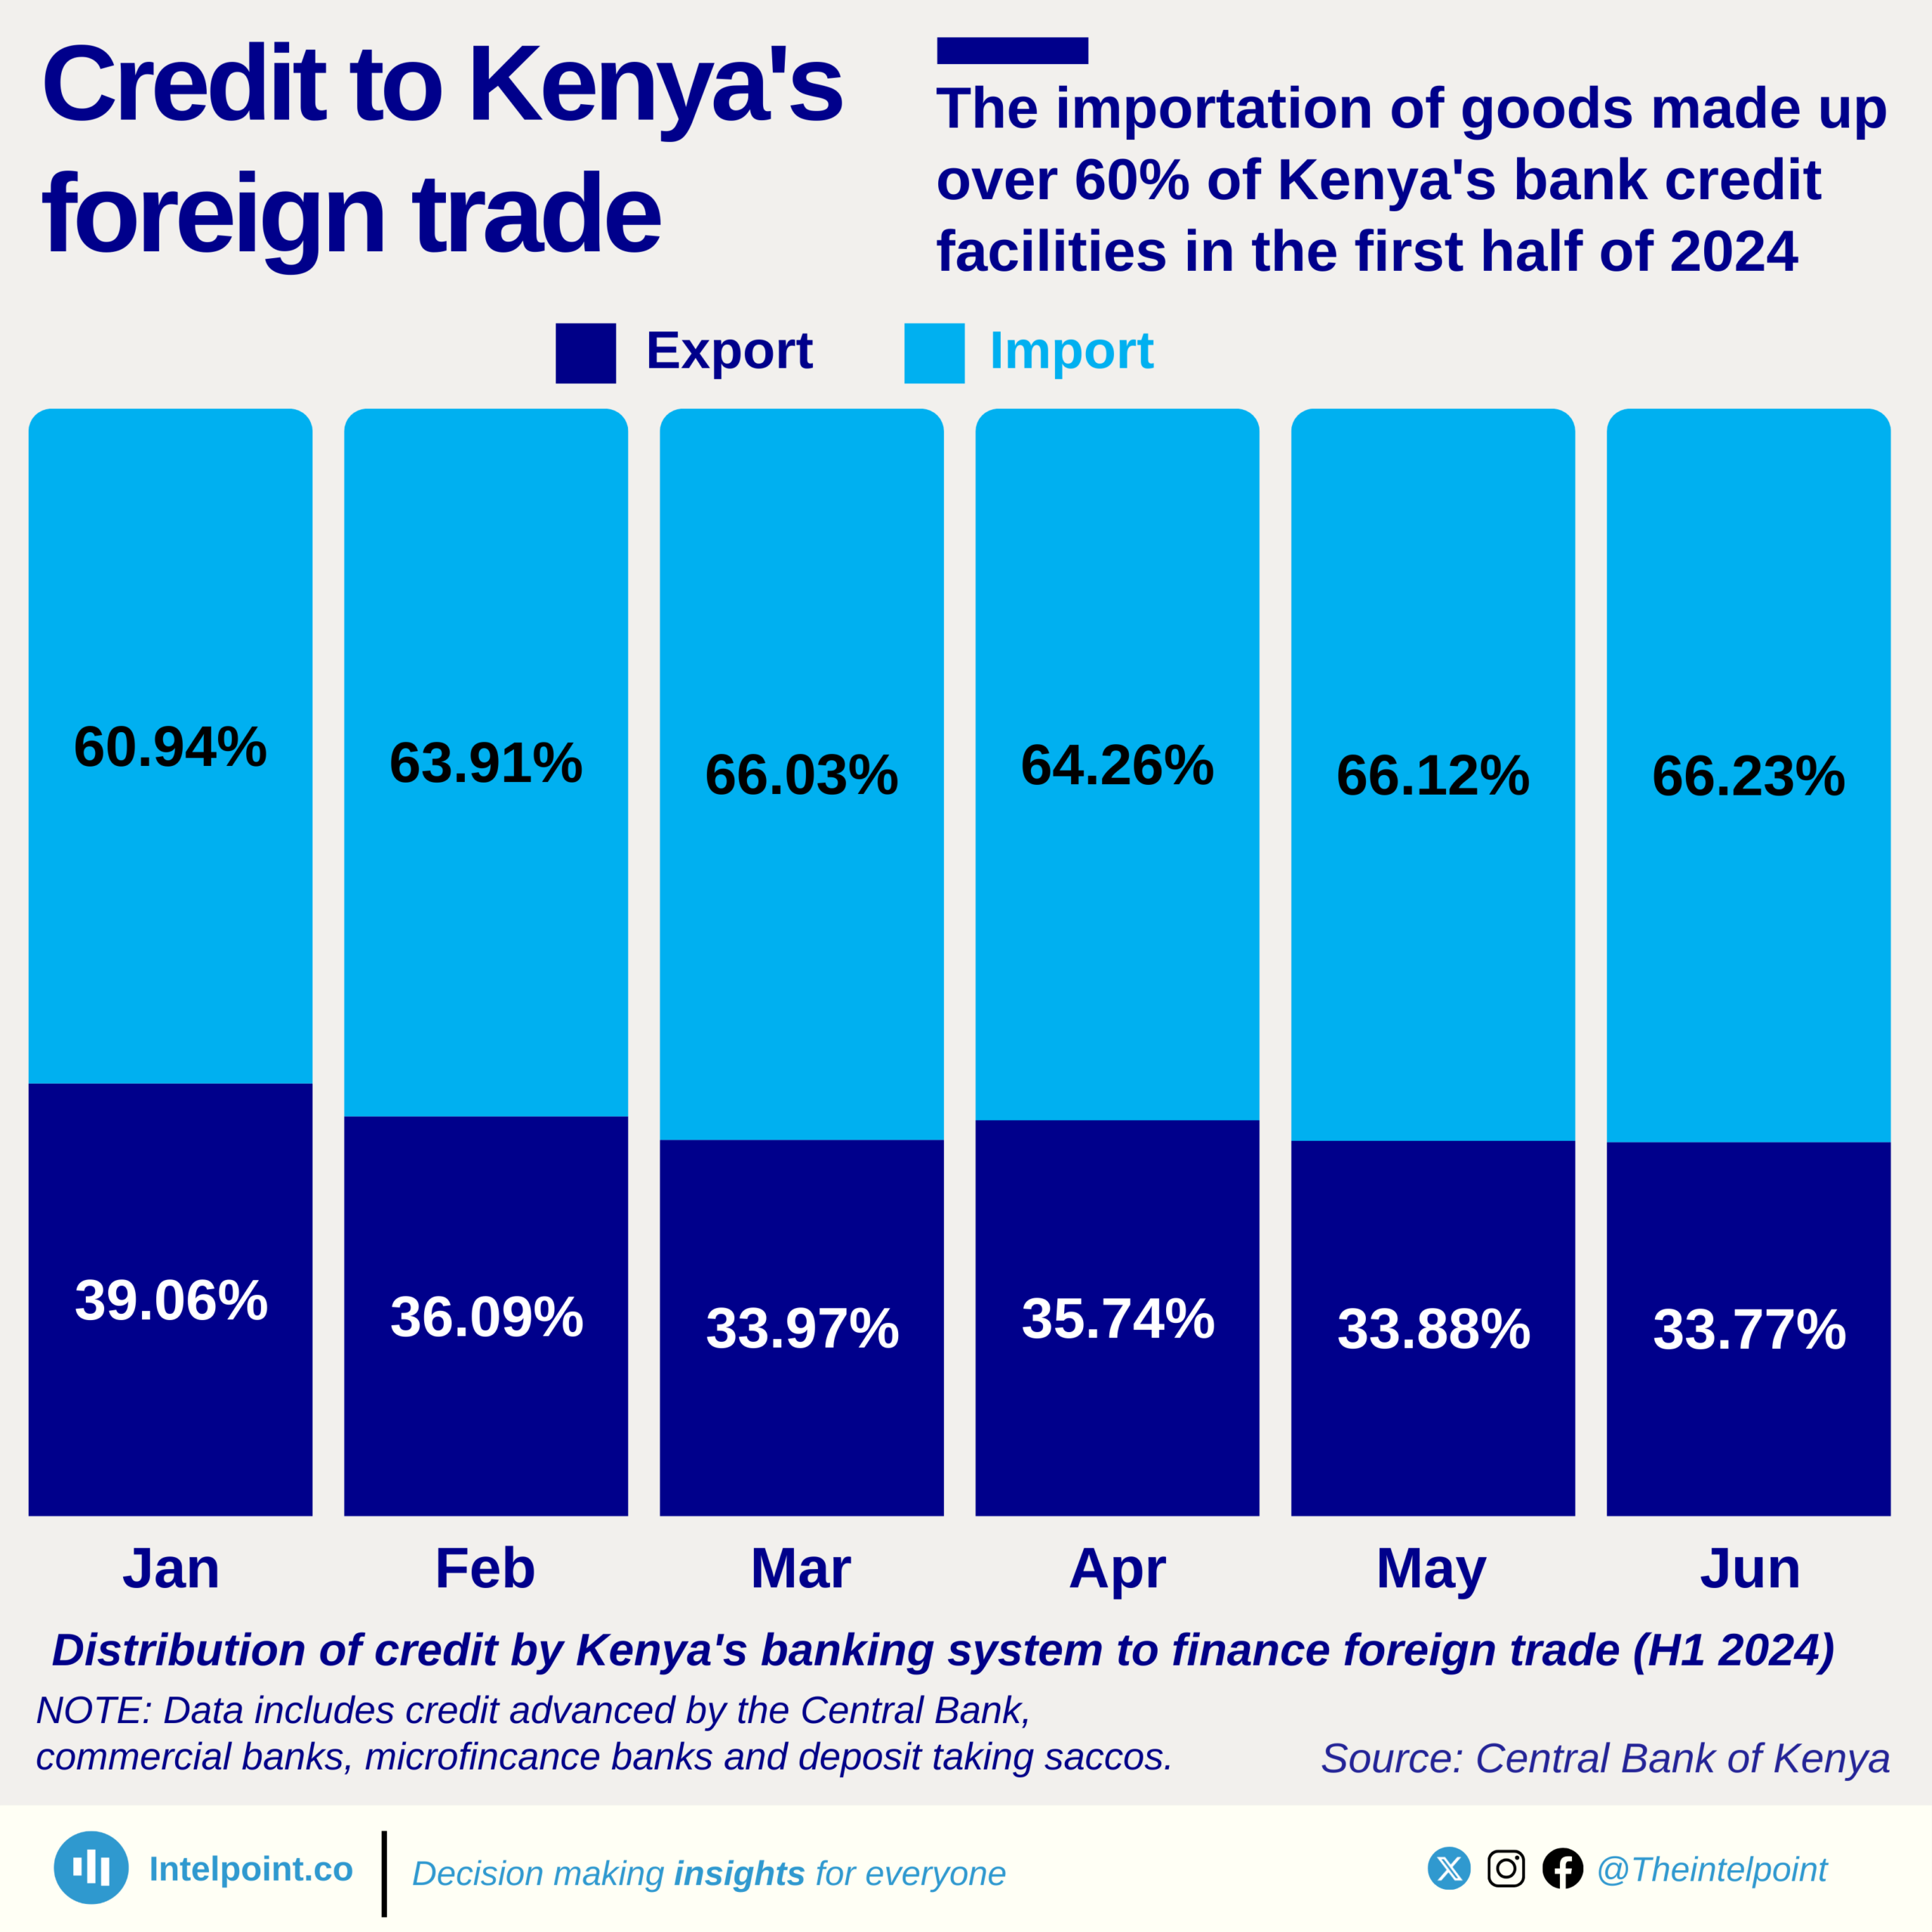
Kenya’s banking sector remains a crucial player in financing international trade, but the balance is heavily tilted towards imports. In the first half of 2024, over 60% of total bank credit allocated to foreign trade went to importing goods, leaving less than 40% for exports. This trend signals a deep reliance on foreign products, raising questions about trade imbalances and the need for export growth.

This pattern is consistent month after month, with March, May, and June peaking above 66% in import financing. Kenyan businesses benefit from import credit, but to ensure long-term economic stability, banks and policymakers might need to explore strategies that promote export financing. A shift towards a more balanced trade credit distribution could strengthen local industries, create jobs, and improve economic resilience.

Source:

Central Bank of Kenya

Period:

2024
HTML code to embed chart
Want a bespoke report?
Reach out
Tags
Related Insights

The U.S. consistently leads Nigeria’s imports from the Americas, accounting for 57–73% in 13 years
  • The U.S. consistently leads Nigeria’s imports from the Americas, accounting for 57–73% between 2013 and 2025.
  • Brazil ranks second, with shares ranging between 11% and 24%, highlighting its steady trade ties with Nigeria.
  • During the period, the combined share of the U.S. and Brazil never fell below 76%, even at its lowest point in 2022.
  • Total imports from the Americas surged from ₦0.9 trillion in 2013 to a peak of ₦6.3 trillion in 2024.
  • Canada’s import share peaked at 16.4% in 2022, showing a rare moment of diversification.

Nigeria's H1 trade: Imports from ECOWAS countries rose from 12% in H1 2021 to a peak of nearly 40% in H1 2024
  • Imports from ECOWAS countries peaked at 39.9% in H1 2024, up from just 12.0% in H1 2021.
  • The share declined to 32.4% in H1 2025, showing a reversal after the 2024 peak.
  • Total import values grew sharply, from ₦209.6B in H1 2020 to ₦1.8T in H1 2025.
  • In H1 2019, ECOWAS already had a decent share of 19.6%, showing long-standing but fluctuating trade ties.

The ECOWAS share of Nigerian exports to African countries nearly doubled, from 34.2% to 62.1%
  • ECOWAS’ share of Nigerian exports rose from 34.2% in H1 2019 to 62.1% in H1 2025.
  • The most significant share came in H1 2022, when ECOWAS accounted for 75.8% of exports.
  • Exports to other African countries dropped significantly in 2022, to just 24.2%.
  • Nigeria’s total exports to Africa grew from ₦0.9T in H1 2022 to ₦4.8T in H1 2025.
  • ECOWAS consistently maintained a majority share from H1 2022 onwards, with a share above 60%.

Nigeria’s exports remain oil-dominated, but non-oil exports are steadily rising—reaching up to 18% in early 2025
  • Oil exports continued to dominate, averaging over 88% of total exports in 2024 and remaining above 81% in the first half of 2025.
  • Non-oil exports rose gradually, from a low of 6.9% (February 2024) to a high of 18.1% (January 2025).
  • Peaks in non-oil export contributions occurred in July 2024 (16.4%) and January–April 2025 (13–18%), indicating progress toward diversification.
  • Total exports remained heavily oil-driven, though sustained double-digit non-oil shares in late 2024 and early 2025 show a slow shift.

After a decline from 13.1% in 2019, the non-oil export share grew by 5.6 percentage points, from 8.7% (2023) to 14.3% (2025)
  • Non-oil exports rose to 14.3% of total exports in 2025, up from 8.7% in 2023.
  • Oil exports still represent 85.7% of total exports in 2025.
  • The non-oil share reached 13.1% in 2019 before dipping and rebounding by 2025.
  • Nigeria’s total exports expanded from ₦9.6 trillion in 2015 to ₦43.3 trillion in H1 2025, showing strong value growth.
  • The lowest non-oil share in the decade occurred in 2016 (4%), reflecting heavy oil dependence.

China dominates Nigeria’s imports while Spain leads as top export destination in Q2 2025
  • China remains Nigeria’s largest import partner, accounting for ₦4.96T or 32.45% of total imports—more than double the U.S.'s share.
  • The United States holds second place in imports, contributing ₦2.16T (14.12%), while India, the Netherlands, and the UAE follow with smaller shares below 6%.
  • Spain tops Nigeria’s export market, receiving ₦2.47T worth of goods, representing 10.85% of total exports.
  • Europe features strongly among export partners, with Spain, France, and the Netherlands together absorbing nearly a quarter of Nigeria’s outbound trade.

POPULAR TOPICS
SIGN UP TO OUR NEWSLETTER
Get periodic updates about the African startup space, access to our reports, among others.
Subscribe Here
Subscription Form

A product of Techpoint Africa. All rights reserved