Sterling Bank has evolved through mergers, acquisitions and strategic evolution

Key takeaways

  • Sterling Bank's origins trace back to 1960 as Nigeria Acceptances Limited, later becoming the first merchant bank in 1969
  • In 2006, NAL Bank merged with four other banks, forming Sterling Bank as it is known today
  • Sterling explored several merger opportunities, including with Ecobank in 2008 and FirstRand in 2011, but these plans did not materialise
  • In 2023, Sterling transitioned into a holding company structure, spinning off its alternative finance arm as a standalone entity, AltBank
  • The bank began raising fresh capital in 2024, with shareholders approving a ₦200 billion equity capital raise and  securing a $50 million private placement as part of its recapitalisation

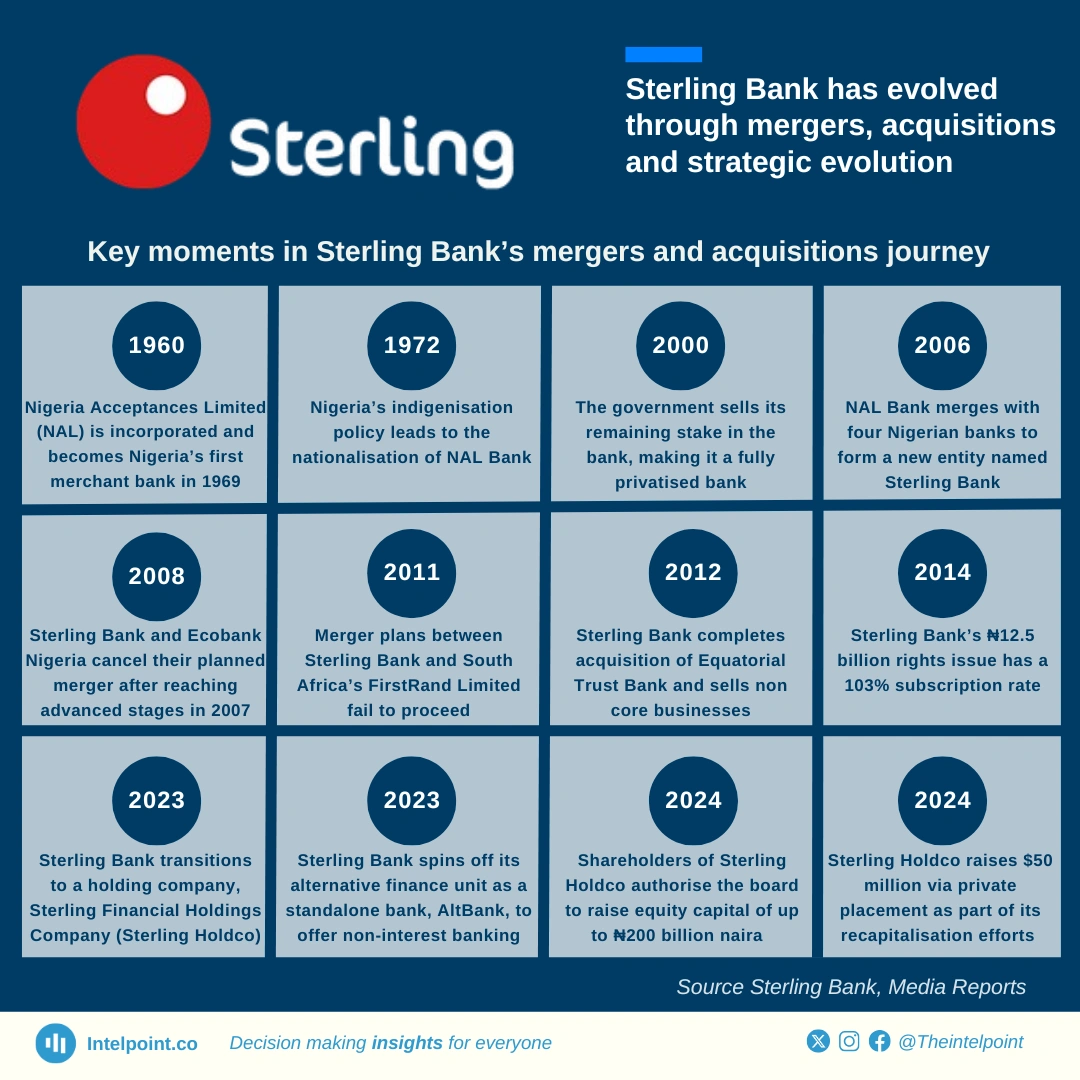
Sterling Bank’s history reflects a series of strategic shifts, including mergers, acquisitions, and restructuring. It began as Nigeria Acceptances Limited in 1960, then became a merchant bank in 1969. The nationalisation policy of 1972 placed the bank under government control until it was fully privatised in 2000. A landmark merger in 2006 saw NAL Bank combine with four other Nigerian banks to form Sterling Bank.
Over the years, Sterling pursued various mergers and acquisitions, including its successful takeover of Equatorial Trust Bank in 2012. In 2023, it transitioned into a holding company, Sterling Holdco, while spinning off AltBank as a standalone entity. Looking ahead, Sterling is strengthening its financial position with a ₦200 billion equity raise, aligning with Nigeria’s evolving banking landscape.

Source:

Sterling Bank, Media Reports

Period:

1960-2025
HTML code to embed chart
Want a bespoke report?
Reach out
Tags
Related Insights

GTCO declared ₦476b profit in H1 2025, with Nigeria contributing over 70% of African operations
  • Nigeria dominates with ₦339.6b, contributing over 70% of GTCO’s total profit after tax in Africa.
  • Ghana (₦61.9b) and Côte d’Ivoire (₦28.2b) followed as the strongest non-Nigerian subsidiaries.
  • Tanzania (₦46m) and Uganda (₦505m) contributed negligible profits compared to peers.
  • GTCO subsidiaries across Africa collectively generated around ₦476b profit after tax in the first half of 2025.

Total microfinance deposits in Kenya only grew 1.66% CAGR over 10 years, ending at KSh 43.0B
  • Microfinance deposits in Kenya grew at only 1.66% CAGR between 2014 and 2024.
  • The peak occurred in 2021 at KSh 50.2B, after which deposits began a steady decline.
  • 2015 (+13.2%) and 2020 (+12.3%) posted the strongest year-on-year growth rates.
  • The sector saw consecutive contractions from 2022 (-7.3%), 2023 (-5.7%), to 2024 (-2.0%).
  • Despite small rebounds in 2018 (+7.3%) and 2019 (+12.3%), the long-term trend is weak.

Microfinance banks in Kenya have consistently posted losses since 2016, reaching KSh -3.5B in 2024
  • Microfinance banks in Kenya recorded their last profit in 2015 (KSh 0.6B) before sliding into losses.
  • The sector’s losses deepened from KSh -0.4B in 2016 to KSh -3.5B in 2024.
  • The steepest single-year decline occurred in 2020, when losses increased by 560.8% to KSh -2.2B.
  • Even in recovery years like 2019 (KSh -0.3B) and 2021 (KSh -0.7B), the sector remained in losses.
  • Over the 10 years, profitability fell at a -212.1% CAGR, reflecting a structural collapse.
  • Since 2016, there has been no single year of profit, highlighting sustained weakness.
  • The worsening losses mirror other sector struggles, such as stagnant deposits, weak asset growth, and rising NPLs.

Kenya’s microfinance banks’ total assets over the years have ranged from KSh 57.0B to KSh 76.4B (2014–2024), standing at KSh 57.9B in 2024
  • Kenya’s microfinance assets grew by just 1.62% between 2014 and 2024.
  • The sector peaked in 2019 at KSh 76.4B, before entering a steady decline.
  • 2023 (-8.8%) and 2024 (-9.8%) posted the steepest year-on-year declines.
  • The sector recorded only two notable growth spikes: 2015 (+21.9%) and 2019 (+7.9%).
  • Overall, the trend from 2020 onward shows persistent contraction in asset value.

After years of growth, Kenyan banks’ asset value declined by 1.6% to KSh 7.6T in 2024
  • Kenyan banks’ total assets grew by 56.6% between 2019 and 2024.
  • In 2024, assets declined slightly by 1.6%, the first drop in five years.
  • The sector recorded consistent growth from 2019 to 2023 before dipping in 2024.
  • The highest growth came in 2023, when assets surged 17.6% to KSh 7.7T.
  • Assets rose from KSh 4.8T in 2019 to KSh 7.6T in 2024.
  • Despite the 2024 dip, banks added nearly KSh 3 trillion in assets over the five years.

Kenyan banks' PBT grew 62.8% over five years, from KSh 159.9B to KSh 260.3B
  • Kenyan banks’ Profit-Before-Tax (PBT) grew by 62.8% between 2019 and 2024.
  • Total PBT rose from KSh 159.9B in 2019 to KSh 260.3B in 2024.
  • The lowest point was in 2020, when profits dropped to KSh 112.8B, a 29.5% decline.
  • Banks recorded their strongest recovery in 2021 with a 73.2% increase in PBT.

POPULAR TOPICS
SIGN UP TO OUR NEWSLETTER
Get periodic updates about the African startup space, access to our reports, among others.
Subscribe Here
Subscription Form

A product of Techpoint Africa. All rights reserved