Soybeans led the US' agricultural exports with $24.58 billion in 2024, accounting for 14% of the total export value

Key Takeaways:

  • Soybeans topped the US' agricultural exports in 2024, followed by corn and beef.
  • The top 10 agricultural commodities made up 56.6% of the total value of the US' agricultural exports.
  • Plant-based exports (soybeans, corn, tree nuts, soybean meal, wheat) contributed over 34% of the total agricultural export value.
  • The combined value of the top 10 exports exceeded $99.73 billion.
  • Animal proteins (beef, pork, and poultry) together represented 13.9% of total US agricultural exports.

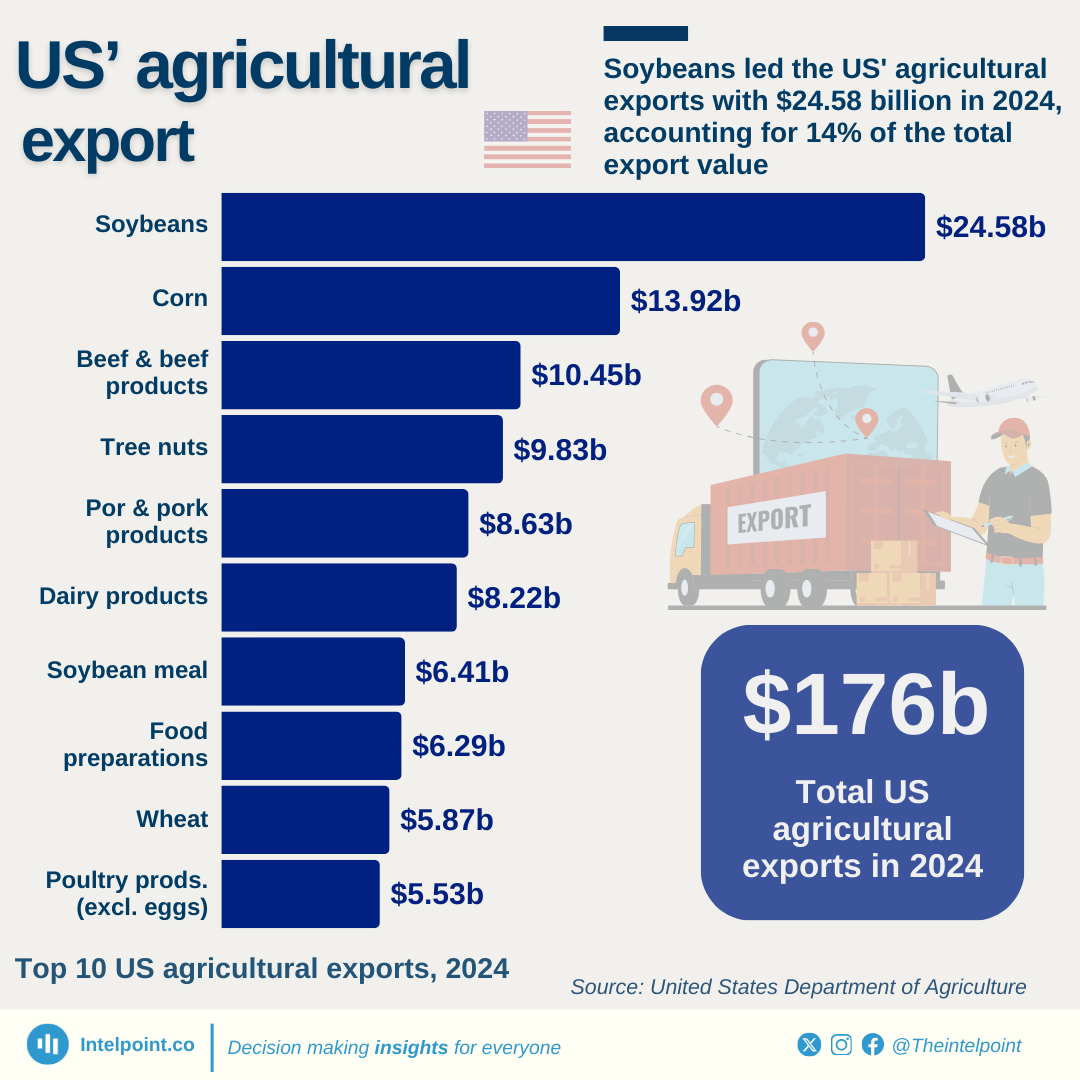
In 2024, soybeans was recorded as the United States’ top agricultural export, valued at $24.58 billion and representing 14% of total agricultural exports. Corn followed with $13.92 billion, representing 7.9% of total agricultural exports.

Tree nuts also made a significant contribution, nearing $10 billion in export value. Animal protein exports, including beef, pork, and poultry, collectively accounted for nearly 14% of the US' agricultural exports.

Source:

United States Department of Agriculture

Period:

2024
HTML code to embed chart
Want a bespoke report?
Reach out
Tags
Related Insights

Netherlands dominated with 18.6% of South African citrus exports in 2023, outpacing other countries
  • The Netherlands led with 18.6% of South Africa’s citrus exports in 2023.
  • The U.S. accounted for 5.8% of South Africa’s citrus exports, a small share compared to Europe and UAE.
  • South African citrus exports to the U.S. in 2023 was valued at $141 million.
  • Other markets, like the UK and UAE, played a larger role in South Africa’s citrus trade.
  • Market diversity may reduce the impact of the trending U.S. tariff on South Africa’s overall citrus export.

Djibouti's inflation peaked at 5.18% in 2022, its highest in a decade
  • Djibouti’s inflation reached a peak in 2022, with 5.18%, the highest in the past decade.
  • The lowest inflation rate occurred in 2015, with a negative value of -0.85%.
  • From 2014 to 2023, Djibouti experienced fluctuating inflation, with increases in 2016, 2019, and 2022.
  • Between 2022 and 2023, inflation decreased from 5.18% to 1.50%.
  • The year 2018 saw the lowest inflation among positive rates, with a modest 0.15%.
  • The overall trend shows periodic inflation spikes, particularly in 2016, 2019, and 2022, while other years maintained relatively stable or lower inflation.

88% of Nigeria's 2024 exports came from crude oil and co., 5.73% from agriculture
Key Takeaways:
  • Petroleum products (crude oil and other oil products) dominated Nigeria's export landscape in 2024, accounting for 88.26% of total export value.
  • Agricultural exports contributed 5.73% to export value, despite Nigeria's significant agricultural potential.
  • The manufacturing sector made up just 2.95% of the total export value.
  • Nigeria’s total export value reached ₦77.44 trillion in 2024 from ₦35.96 trillion in 2023.
  • Non-oil sectors collectively made up less than 12% of export value.

Crude oil leads Nigeria’s global exports with 68.87% share, while refined petroleum products (motor spirit, gas oil) top its imports at over 27%
Key Takeaways:
  • Crude oil remains Nigeria’s largest export, while refined petroleum products lead imports.
  • Natural gas ranks as the second-largest export, contributing 9.71% of the total export value.
  • The top five imported products account for 32.28% of Nigeria’s global imports.
  • The top ten exports represent over 95% of Nigeria’s total export value.

In Q4 2024, more than 98% of exports and 90% of imports were transported through maritime
Key Takeaways:
  • Maritime transport dominated Nigeria’s international trade in Q4 2024, accounting for 98.79% of total exports and 90.15% of total imports.
  • Air transport contributed significantly to imports (9.03%) but played a minimal role in exports (0.64%).
  • Road and other transport modes made negligible contributions to both imports and exports.
  • Total trade across all transport modes reached ₦36.6 trillion, resulting in a positive trade balance.

Over 80% of Nigeria’s imports in 2024 came from manufacturing and oil products
Key takeaways:
  • Manufactured goods accounted for 44.2% of Nigeria’s total imports.
  • Petroleum products (excluding crude oil) made up 38% of the import value.
  • Raw materials represented 11% of the total import value.
  • Agricultural imports contributed 6.2% to the overall import value.
  • The total import value stood at ₦60.59 trillion in 2024, from ₦30.86 trillion in 2023.
  • The energy resources sector made a negligible amount in import value, while no record was made for the crude oil sector.

POPULAR TOPICS
SIGN UP TO OUR NEWSLETTER
Get periodic updates about the African startup space, access to our reports, among others.
Subscribe Here
Subscription Form

A product of Techpoint Africa. All rights reserved