South west leads with Lagos recording 114 female candidates, while the North East trails with just 7 in Yobe

Key Takeaways

  • Lagos had the highest female representation in Nigeria’s 2023 elections, with 114 female candidates, more than any other state.
  • Yobe recorded the lowest, with just 7 female candidates, highlighting a wide disparity in representation across regions.
  • The South East and South South zones recorded some of the strongest numbers overall, with Imo (86) and Rivers (85) nearly matching Lagos.
  • The South West led overall in female candidate numbers, while the North East trailed, with its highest (Gombe – 42) still lower than other zones’ peaks.

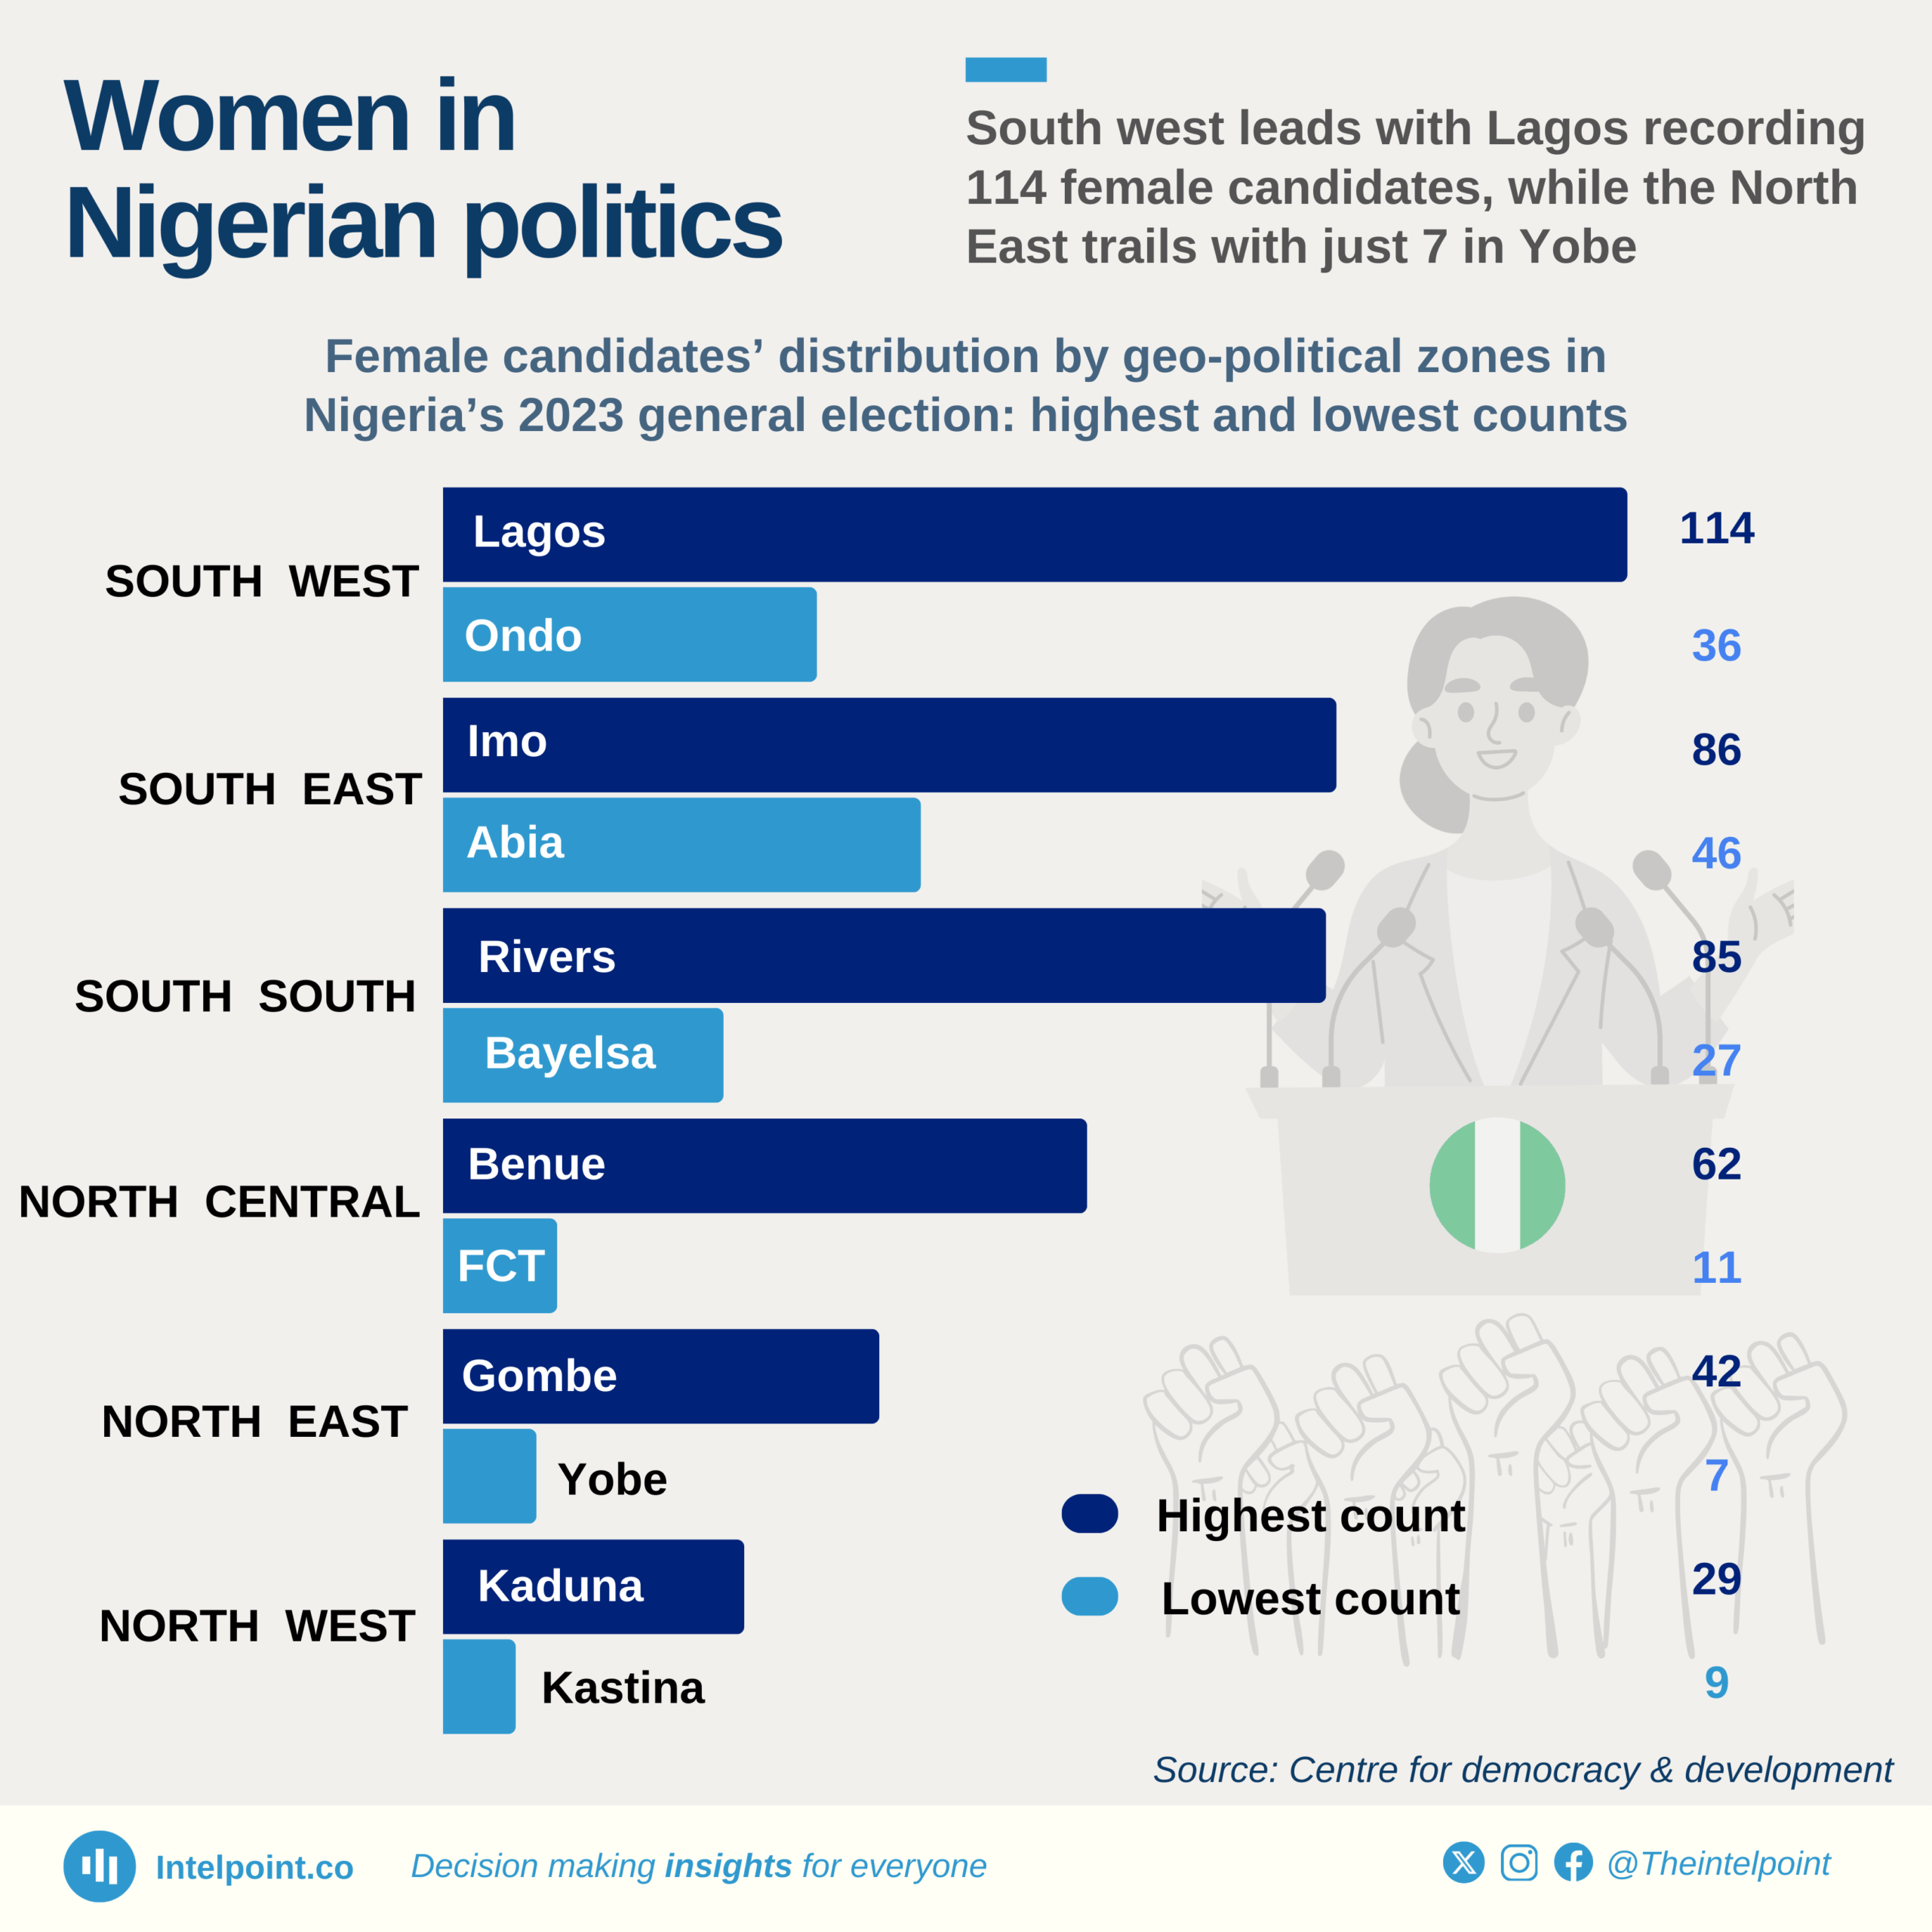
This visual explores the distribution of female candidates in Nigeria’s 2023 general elections, comparing the highest and lowest represented states across each of the six geo-political zones.

Leading the chart is Lagos State in the South West, which recorded 114 female candidates, the highest in the country. This underscores the South West’s strong showing in female political participation. In contrast, Yobe State in the North East had only 7 female candidates, the lowest nationwide, pointing to a significant regional disparity.

Across all zones, the difference between the highest and lowest represented states is notable. For instance, in the South East, Imo led with 86 candidates, while Abia had just 46. Similarly, in the South South, Rivers saw 85 female candidates, far more than Bayelsa’s 27.

The North Central zone showed moderate numbers, with Benue (62) leading and the FCT (11) on the lower end. Overall, this distribution highlights how female political participation varies sharply not only across the country but even within regions.

Source:

Center for democracy and development

Period:

2023
HTML code to embed chart
Want a bespoke report?
Reach out
Tags
Related Insights

Borno records lowest domestic debt in North-East Nigeria at ₦22.3 billion in Q2 2025
  • The six North-Eastern states collectively owe around ₦450 billion in domestic debt as of Q2 2025.
  • Borno State maintains the lowest debt in the region at ₦22.3 billion, showing signs of controlled borrowing amid post-conflict rebuilding.
  • Bauchi State has the highest domestic debt burden of ₦143.6 billion, accounting for about 31% of the region’s total.
  • The top three states, Bauchi, Taraba and Gombe, collectively account for more than two-thirds of the zone’s total subnational debt stock.

In just six months, Nigeria spent over $2.3 billion servicing external debts
  • Nigeria paid $816.3 million to the International Monetary Fund, accounting for over 35% of total external debt service payments.
  • Eurobond payments followed closely, with $687.8 million paid, reflecting Nigeria’s heavy reliance on commercial debt instruments.
  • Multilateral lenders like IDA and AfDB collectively received about $463 million, signalling continued exposure to concessional financing.
  • China’s share shrinking: Payments to Chinese lenders (EXIM + CDB) totalled $235.6 million, less than 11% of total outflows, suggesting reduced Chinese debt servicing in H1 2025.

Over 60% of Nigeria’s ₦1.7 trillion domestic debt service in Q2 2025 was spent on Federal Government Bonds
  • FGN bonds dominated: ₦1.07 trillion went to Federal Government Bonds, accounting for about 63% of total domestic debt servicing.
  • Treasury bills followed: Payments on NTBs reached ₦537.9 billion, making up roughly 31% of the total.
  • Sukuk and promissory notes together cost ₦90.8 billion, reflecting Nigeria’s mix of infrastructure and settlement instruments.
  • Green and savings bonds remained minimal, together below ₦5 billion, showing limited traction for retail and sustainability-focused debt.

93% of Nigeria's public debt is owed by the Federal Government
  • The Federal Government’s share of total public debt rose from 79.5% in 2019 to 92.6% in 2025.
  • States’ share has more than halved, from 20.5% to 7.4% in six years.
  • Total public debt grew from $83.9 billion to $99.7 billion, peaking at $113.4 billion in 2023.
  • Nigeria’s debt burden is increasingly concentrated at the centre, amplifying federal repayment risks and reducing fiscal independence for states.

Over 60% of Nigerians use crypto for savings and long-term investing
  • Wealth-building dominates motivation: 45.4% cite “active wealth building” as their primary motive, and an additional 21.8% cite “long-term financial security”.
  • Payments and utility are minor drivers: Only 3.3% report “daily utility” and 2.2% “digital commerce” as their chief motive for using crypto.
  • Hedging and cross-border flows matter: 8.7% use crypto for currency hedging, and 4.1% for cross-border payments, showing a dual role of investment plus international value flows.
  • Nigerian retail users treat crypto like a conventional financial instrument rather than only as a means of payment or speculation.

Over 65% of surveyed Nigerian crypto users transact below ₦50,000; less than 3% move above ₦1 million
  • Nearly two-thirds (67%) of all crypto transactions in Nigeria are below ₦50,000, reflecting widespread use among everyday retail users.
  • The ₦15,000–₦25,000 band (28.2%) is the single largest group, showing consistent, small-scale engagement rather than high-value speculation.
  • Around 25% of users transact between ₦50,000 and ₦250,000, suggesting a growing middle class of more confident, mid-level investors.
  • Less than 3% of users transact above ₦1 million, confirming that Nigeria’s crypto market remains primarily retail-driven, not institutional or high-net-worth.

POPULAR TOPICS
SIGN UP TO OUR NEWSLETTER
Get periodic updates about the African startup space, access to our reports, among others.
Subscribe Here
Subscription Form

A product of Techpoint Africa. All rights reserved