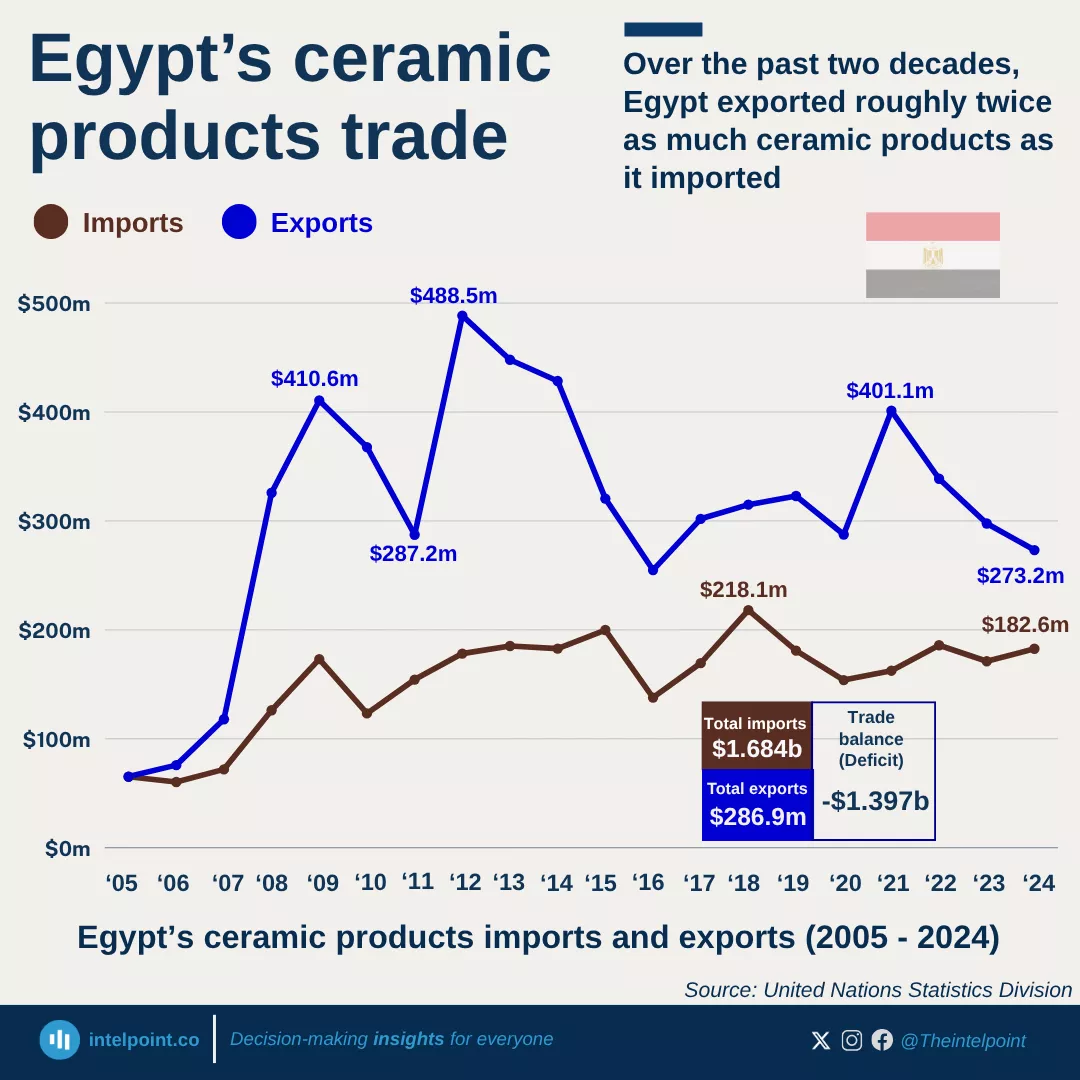
Over the past two decades, Egypt exported roughly twice as much ceramic products as it imported

Key takeaways:

  • Over the past two decades, Egypt exported roughly twice as much ceramic products as it imported, positioning itself as a key player in regional and global ceramic products trade.
  • In 2012, exports peaked at $488.51 million, more than double imports at $178.23 million, setting a clear demonstration of strong industrial and commodity output.
  • In 2008, exports soared to $325.86 million, more than doubling imports at $126.21 million.
  • Between 2017 and 2021, the export sector showed stable performance, averaging $327 million annually.
  • The year 2021 was a standout, with exports reaching $401.12 million, reflecting a strong rebound that reaffirmed Egypt’s export capacity post-pandemic.

Over the years, Egypt has consistently recorded higher exports than imports of ceramic products, maintaining a strong and sustained trade surplus.

In 2005, exports and imports were nearly equal at $65.35 million and $65.19 million, respectively. From 2006, exports gained a clear lead, reaching $75.84 million while imports fell to $60.36 million. By 2007, exports rose to $117.98 million, then surged to $325.86 million in 2008 and $410.60 million in 2009, more than double import levels each year.

Exports peaked in 2012 at $488.51 million against $178.23 million in imports. Even during slower years such as 2015 and 2016, exports stayed ahead at $320.53 million and $254.91 million, compared with $199.87 million and $137.86 million in imports. Between 2017 and 2021, exports averaged $327 million annually, rising to $401.12 million in 2021.

Exports remained above imports in recent years: $338.72 million compared with below $190 million in 2022 and 2023, and $273.27 million compared with $182.64 million in 2024.

Overall, Egypt exported roughly twice as much as it imported over two decades, sustaining a consistent trade surplus across changing conditions.
Source:

United Nations Statistics Division

Period:

2005 - 2024
HTML code to embed chart
Want a bespoke report?
Reach out
Tags
Related Insights

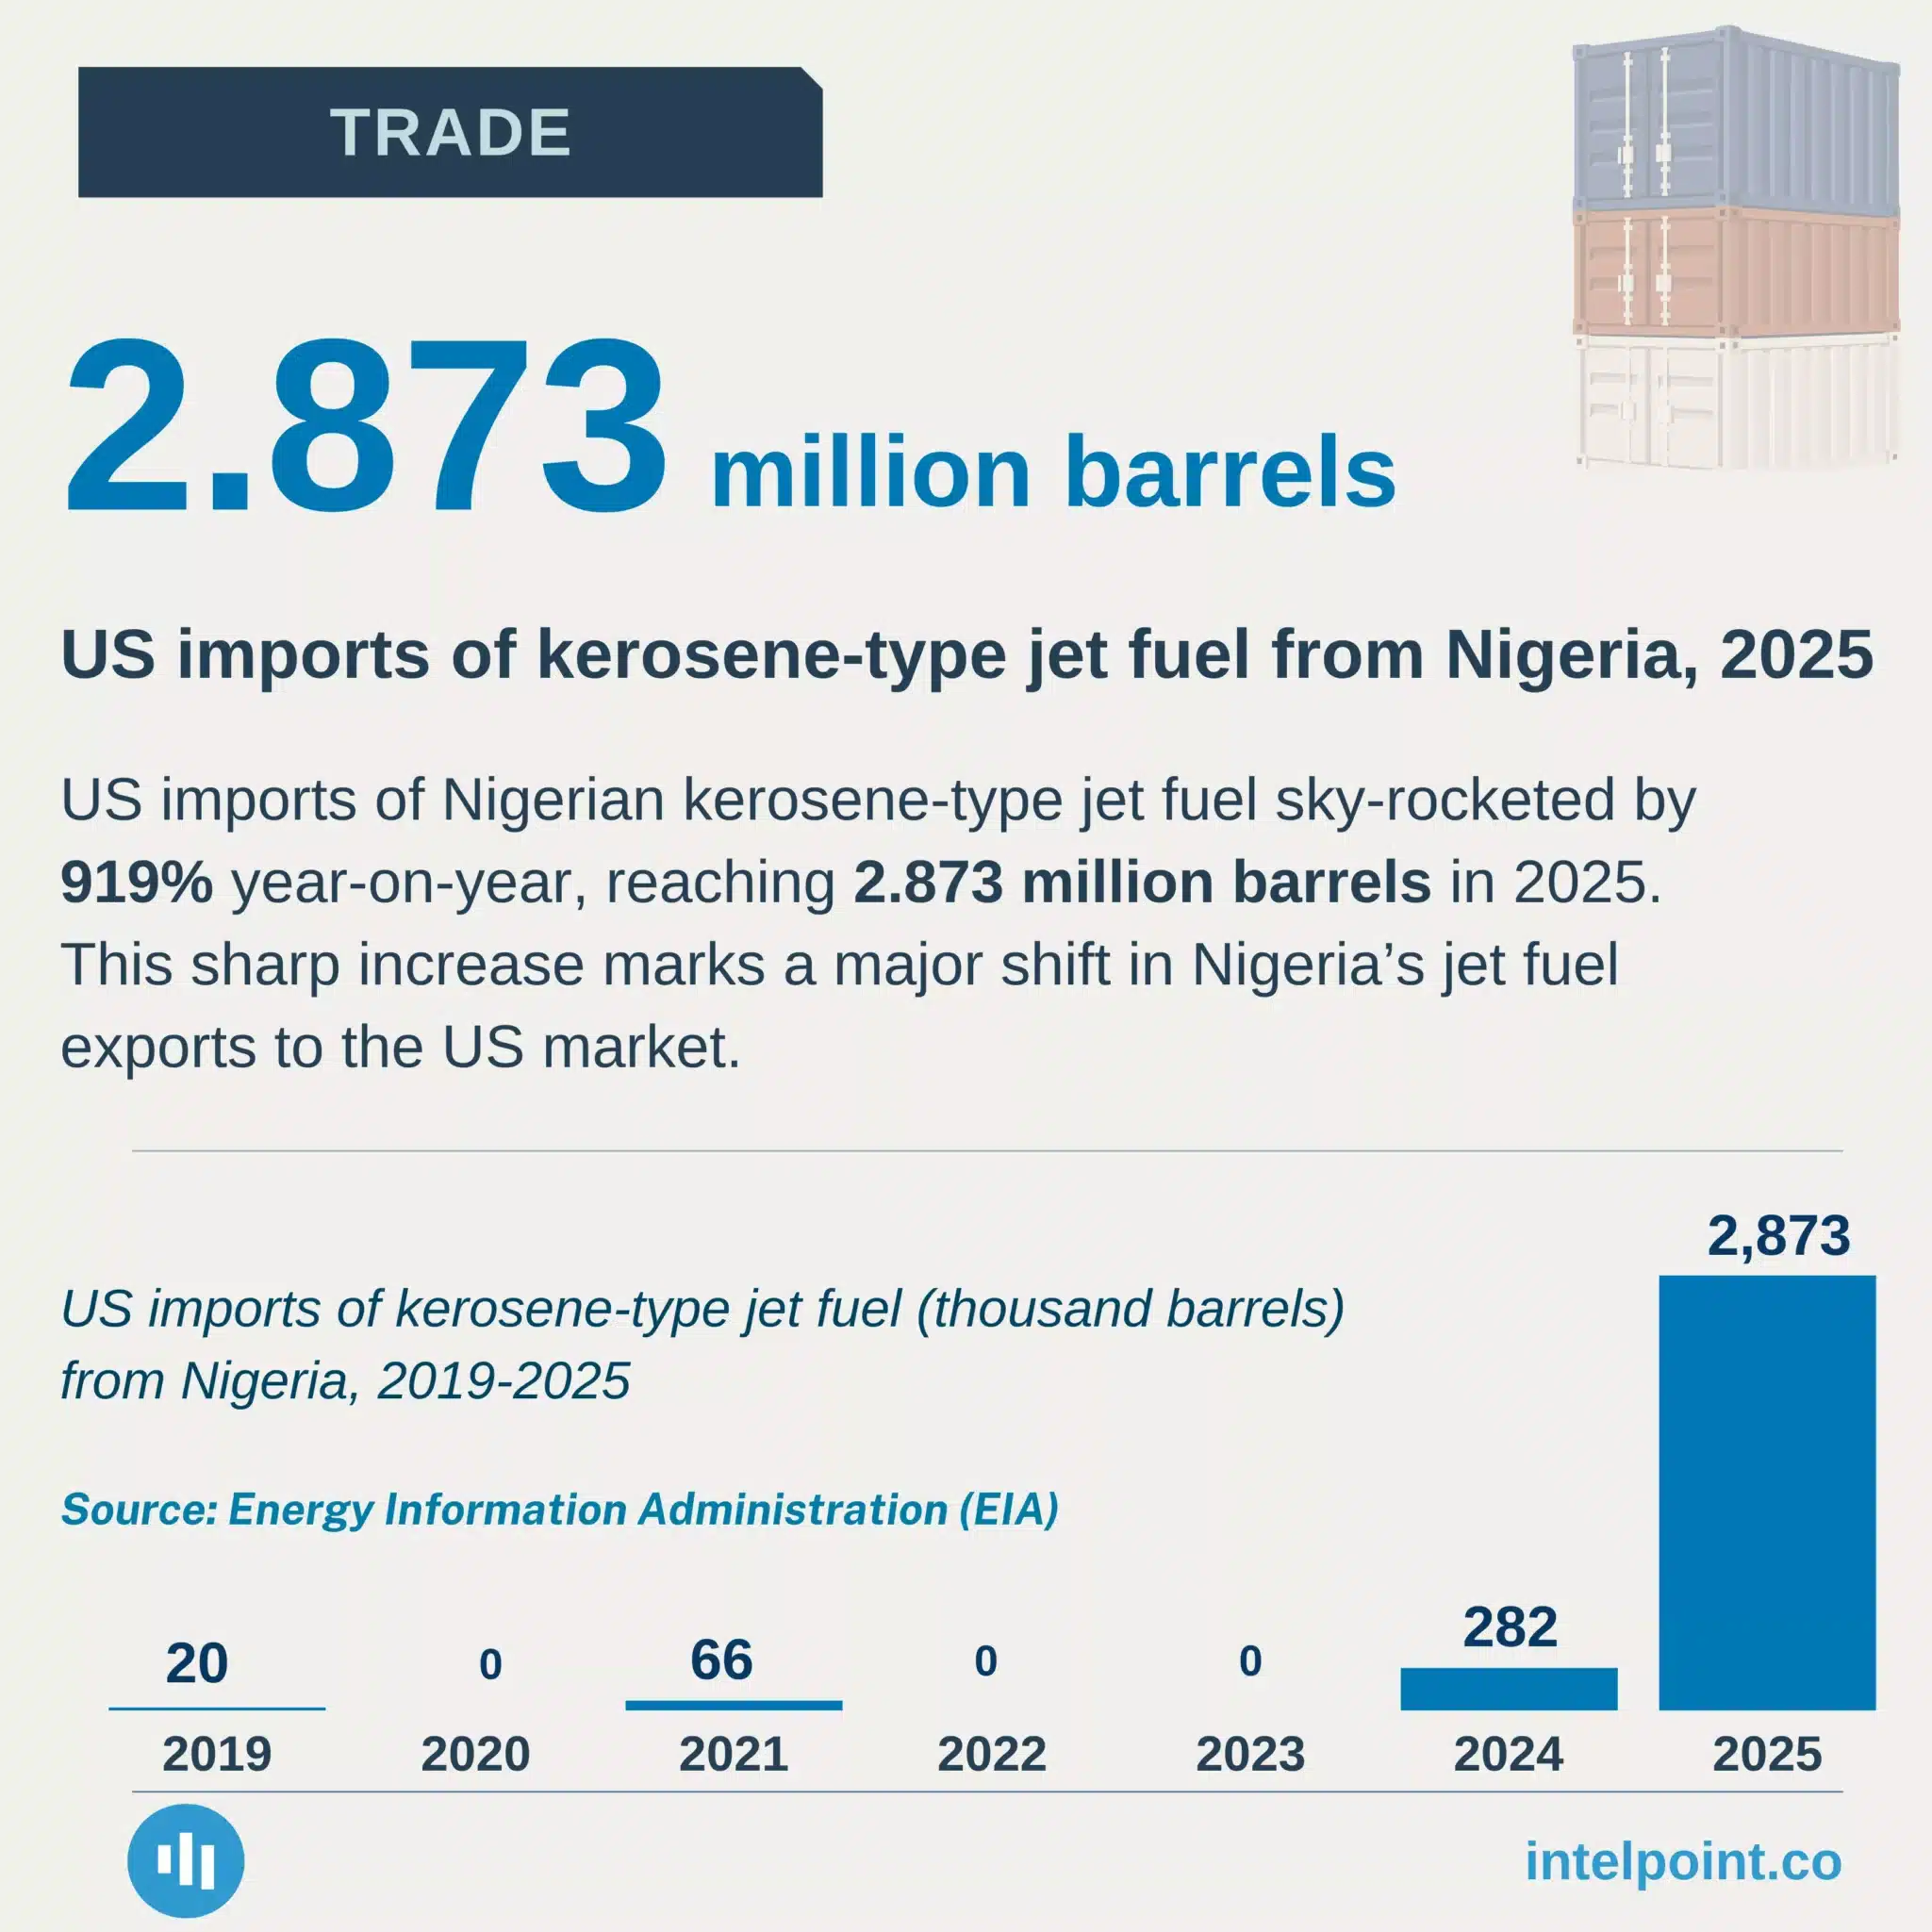
US imports of Nigerian kerosene-type jet fuel sky-rocketed by 919% year-on-year
  • Nigerian jet fuel exports to the U.S. jumped 10-fold to 2.87 million barrels in 2025.
  • Just 86,000 barrels were imported across the U.S. from Nigeria between 1993 and 2023.
  • The 2025 surge was concentrated in five months, amid East Coast refinery disruptions.
  • No Nigerian jet fuel imports were recorded through August 2026, suggesting the surge was temporary.

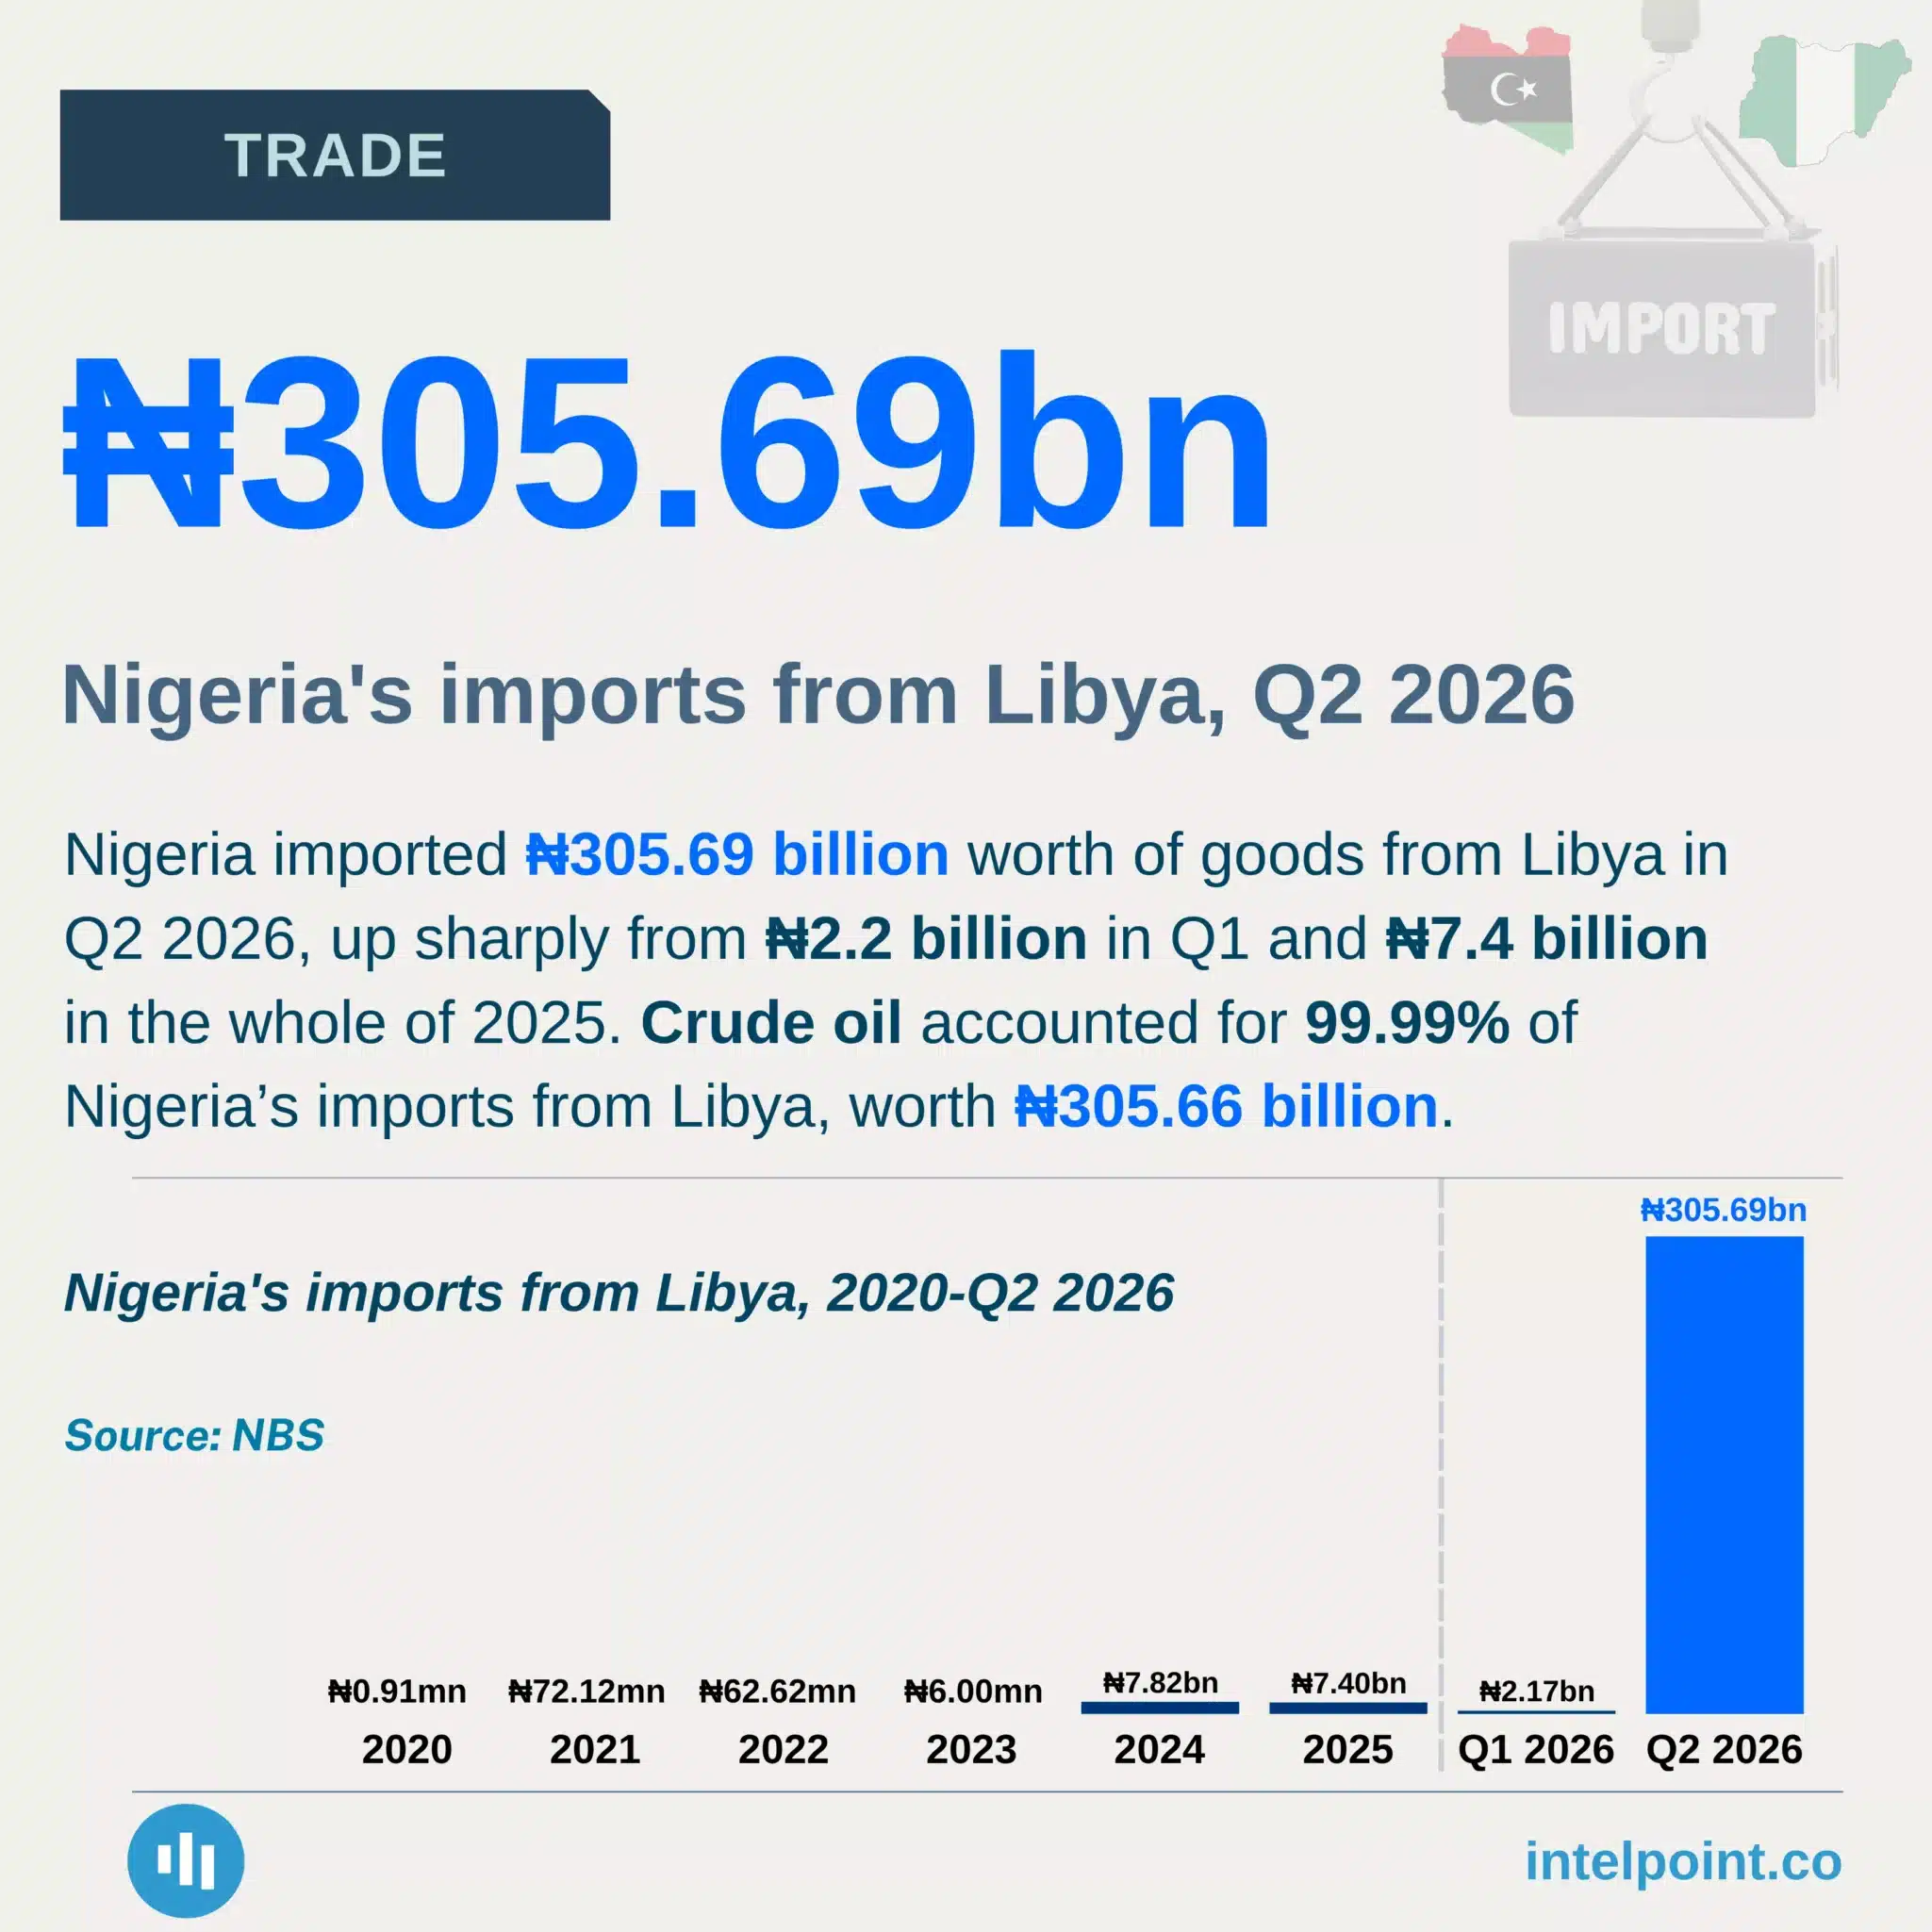
Nigeria bought ₦305.66 billion worth of crude oil from Libya in Q2 2026
  • Nigeria imported ₦305.69bn from Libya in Q2 2026, up from ₦2.17bn in Q1.
  • Crude oil accounted for 99.99% of Q2 imports, worth ₦305.66bn.
  • Libya’s Q2 exports to Nigeria surged from ₦7.4bn in 2025 to ₦305.69bn.
  • Libya became Nigeria’s ninth-largest import source, accounting for 2.12% of total imports in Q2.
  • Nigeria’s imports from Libya were previously dominated by much smaller values, with crude oil driving the sharp 2026 increase.

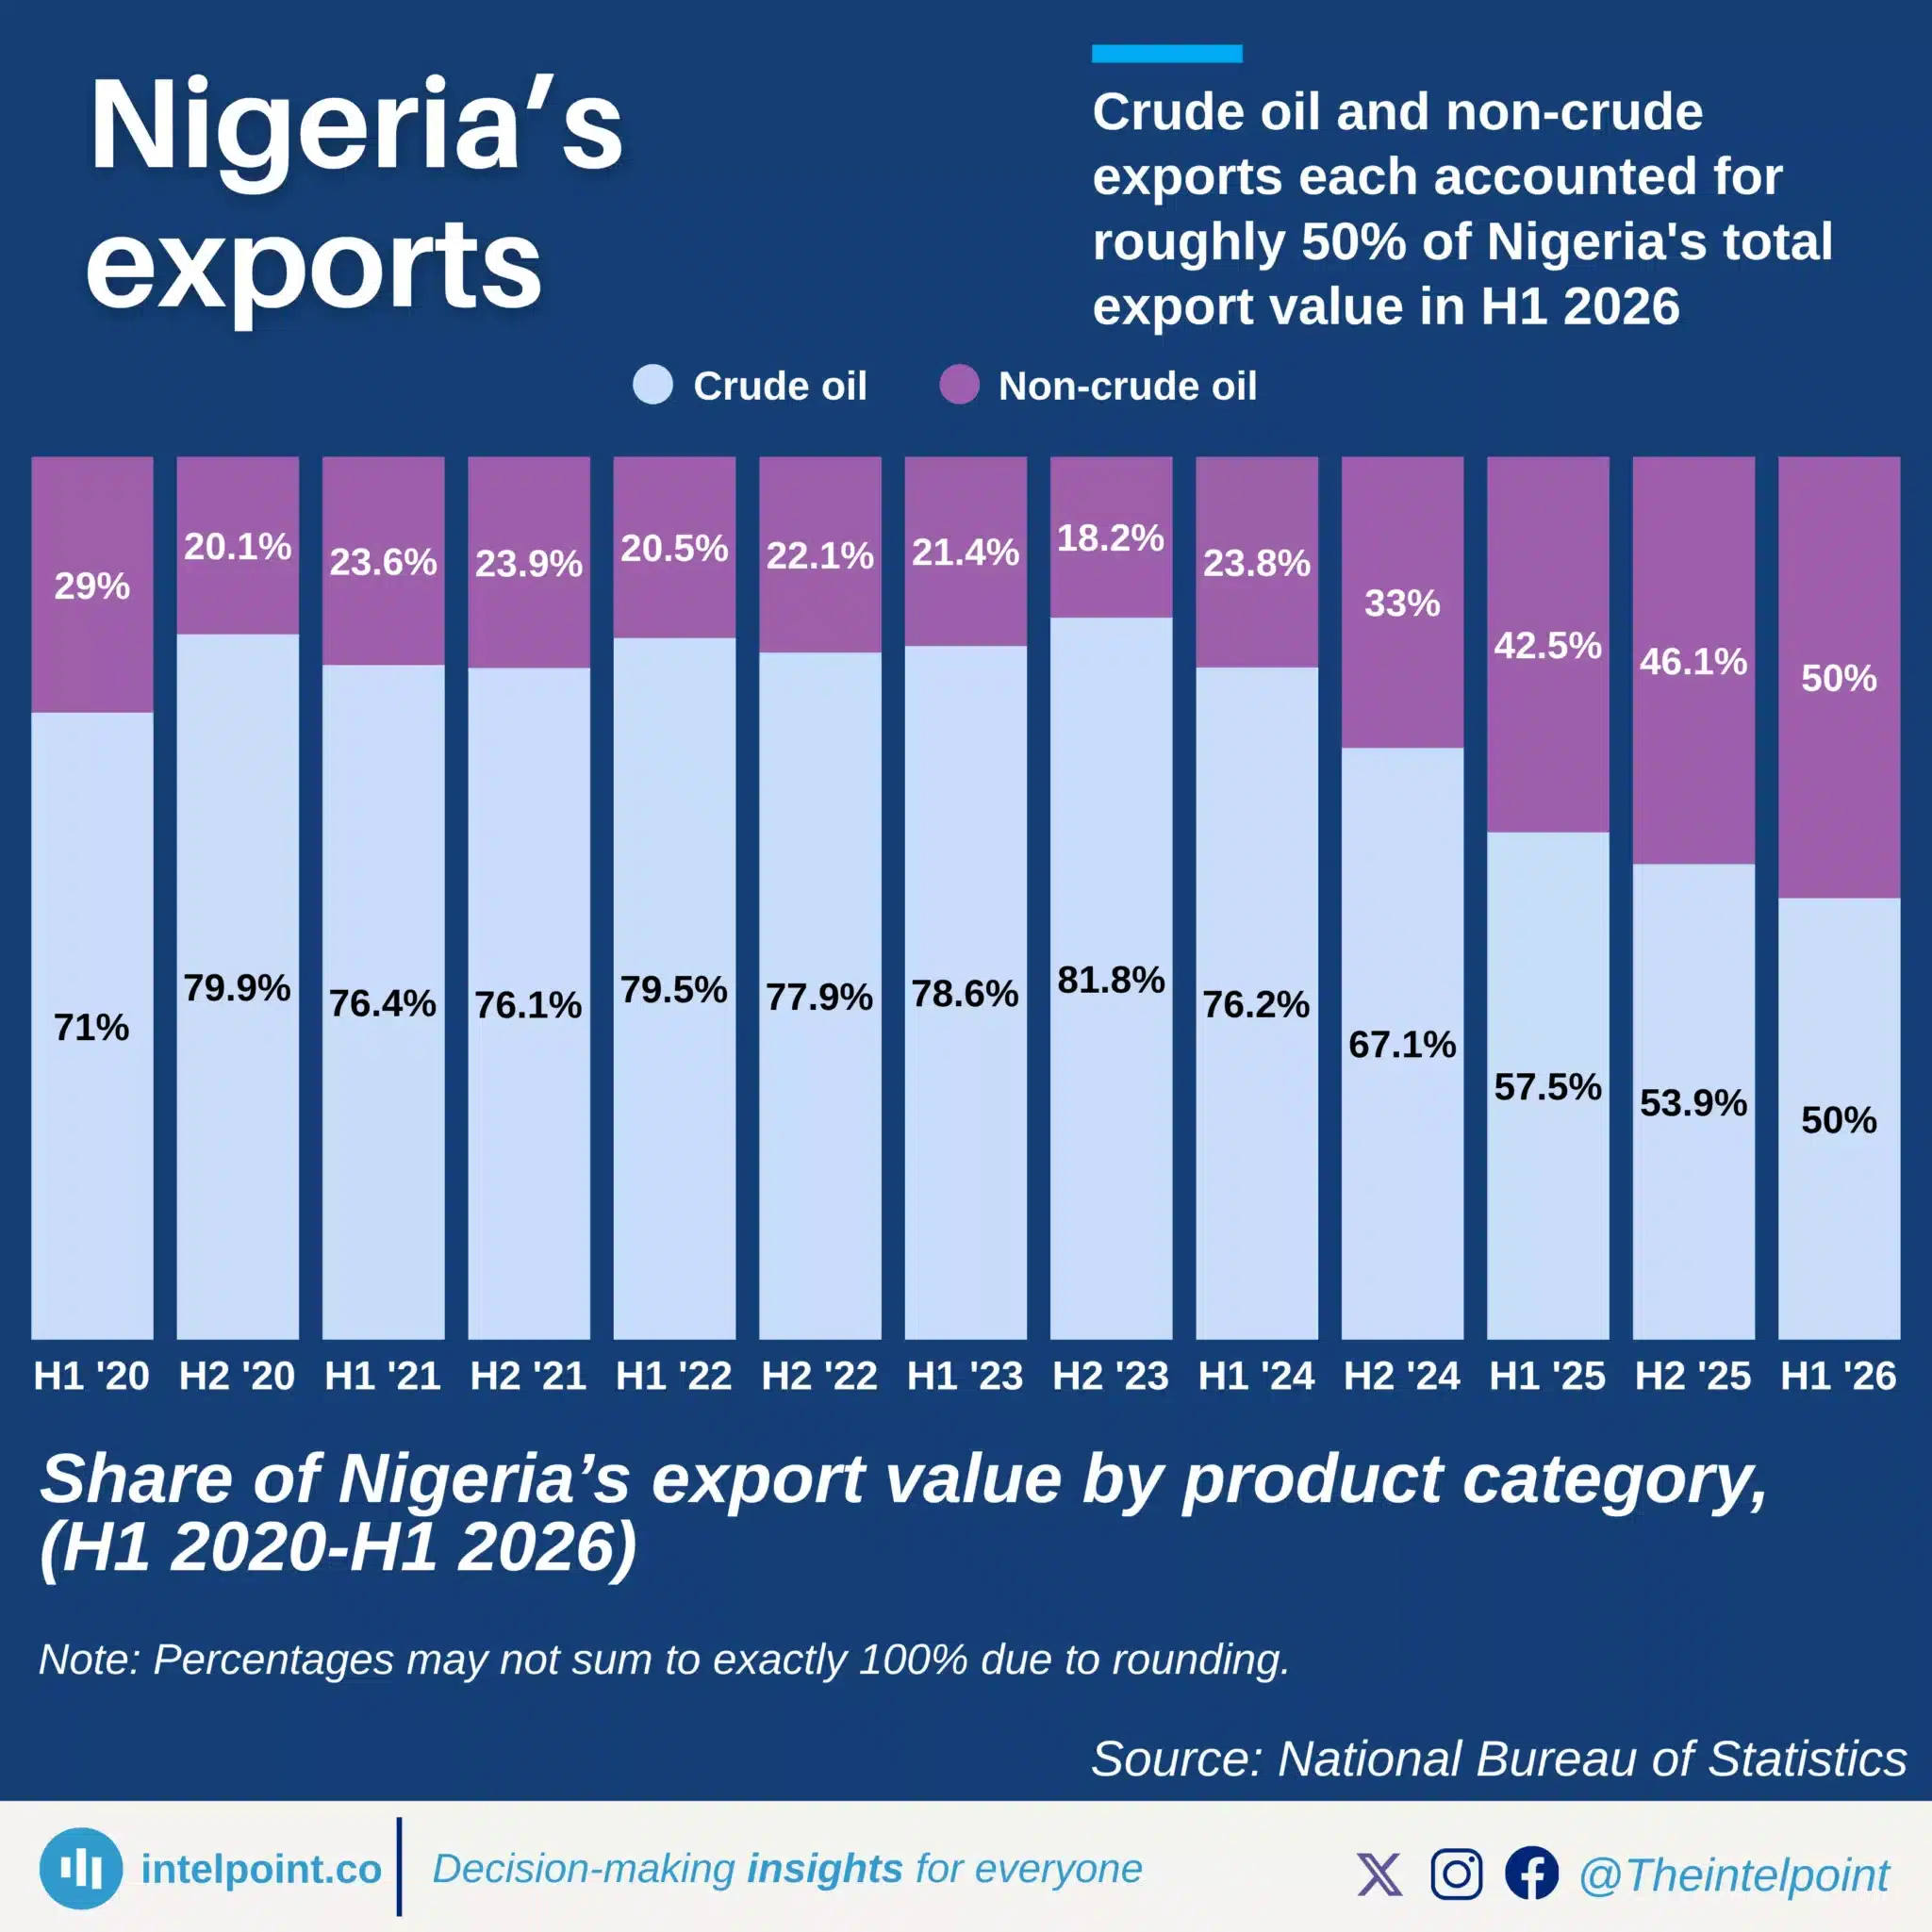
Crude oil and non-crude exports each accounted for roughly 50% of Nigeria's total export value in H1 2026
  • Nigeria’s crude and non-crude exports were nearly equal in H1 2026, at ₦24.1tn and ₦24tn, respectively.
  • Non-crude exports overtook crude in Q2 for the first time in at least six years, reaching ₦14.11tn.
  • Petroleum products and natural gas dominate non-crude exports, while non-oil exports accounted for just 13.8% of Q2 exports.
  • Nigeria’s export mix is shifting, but remains heavily dependent on hydrocarbons.

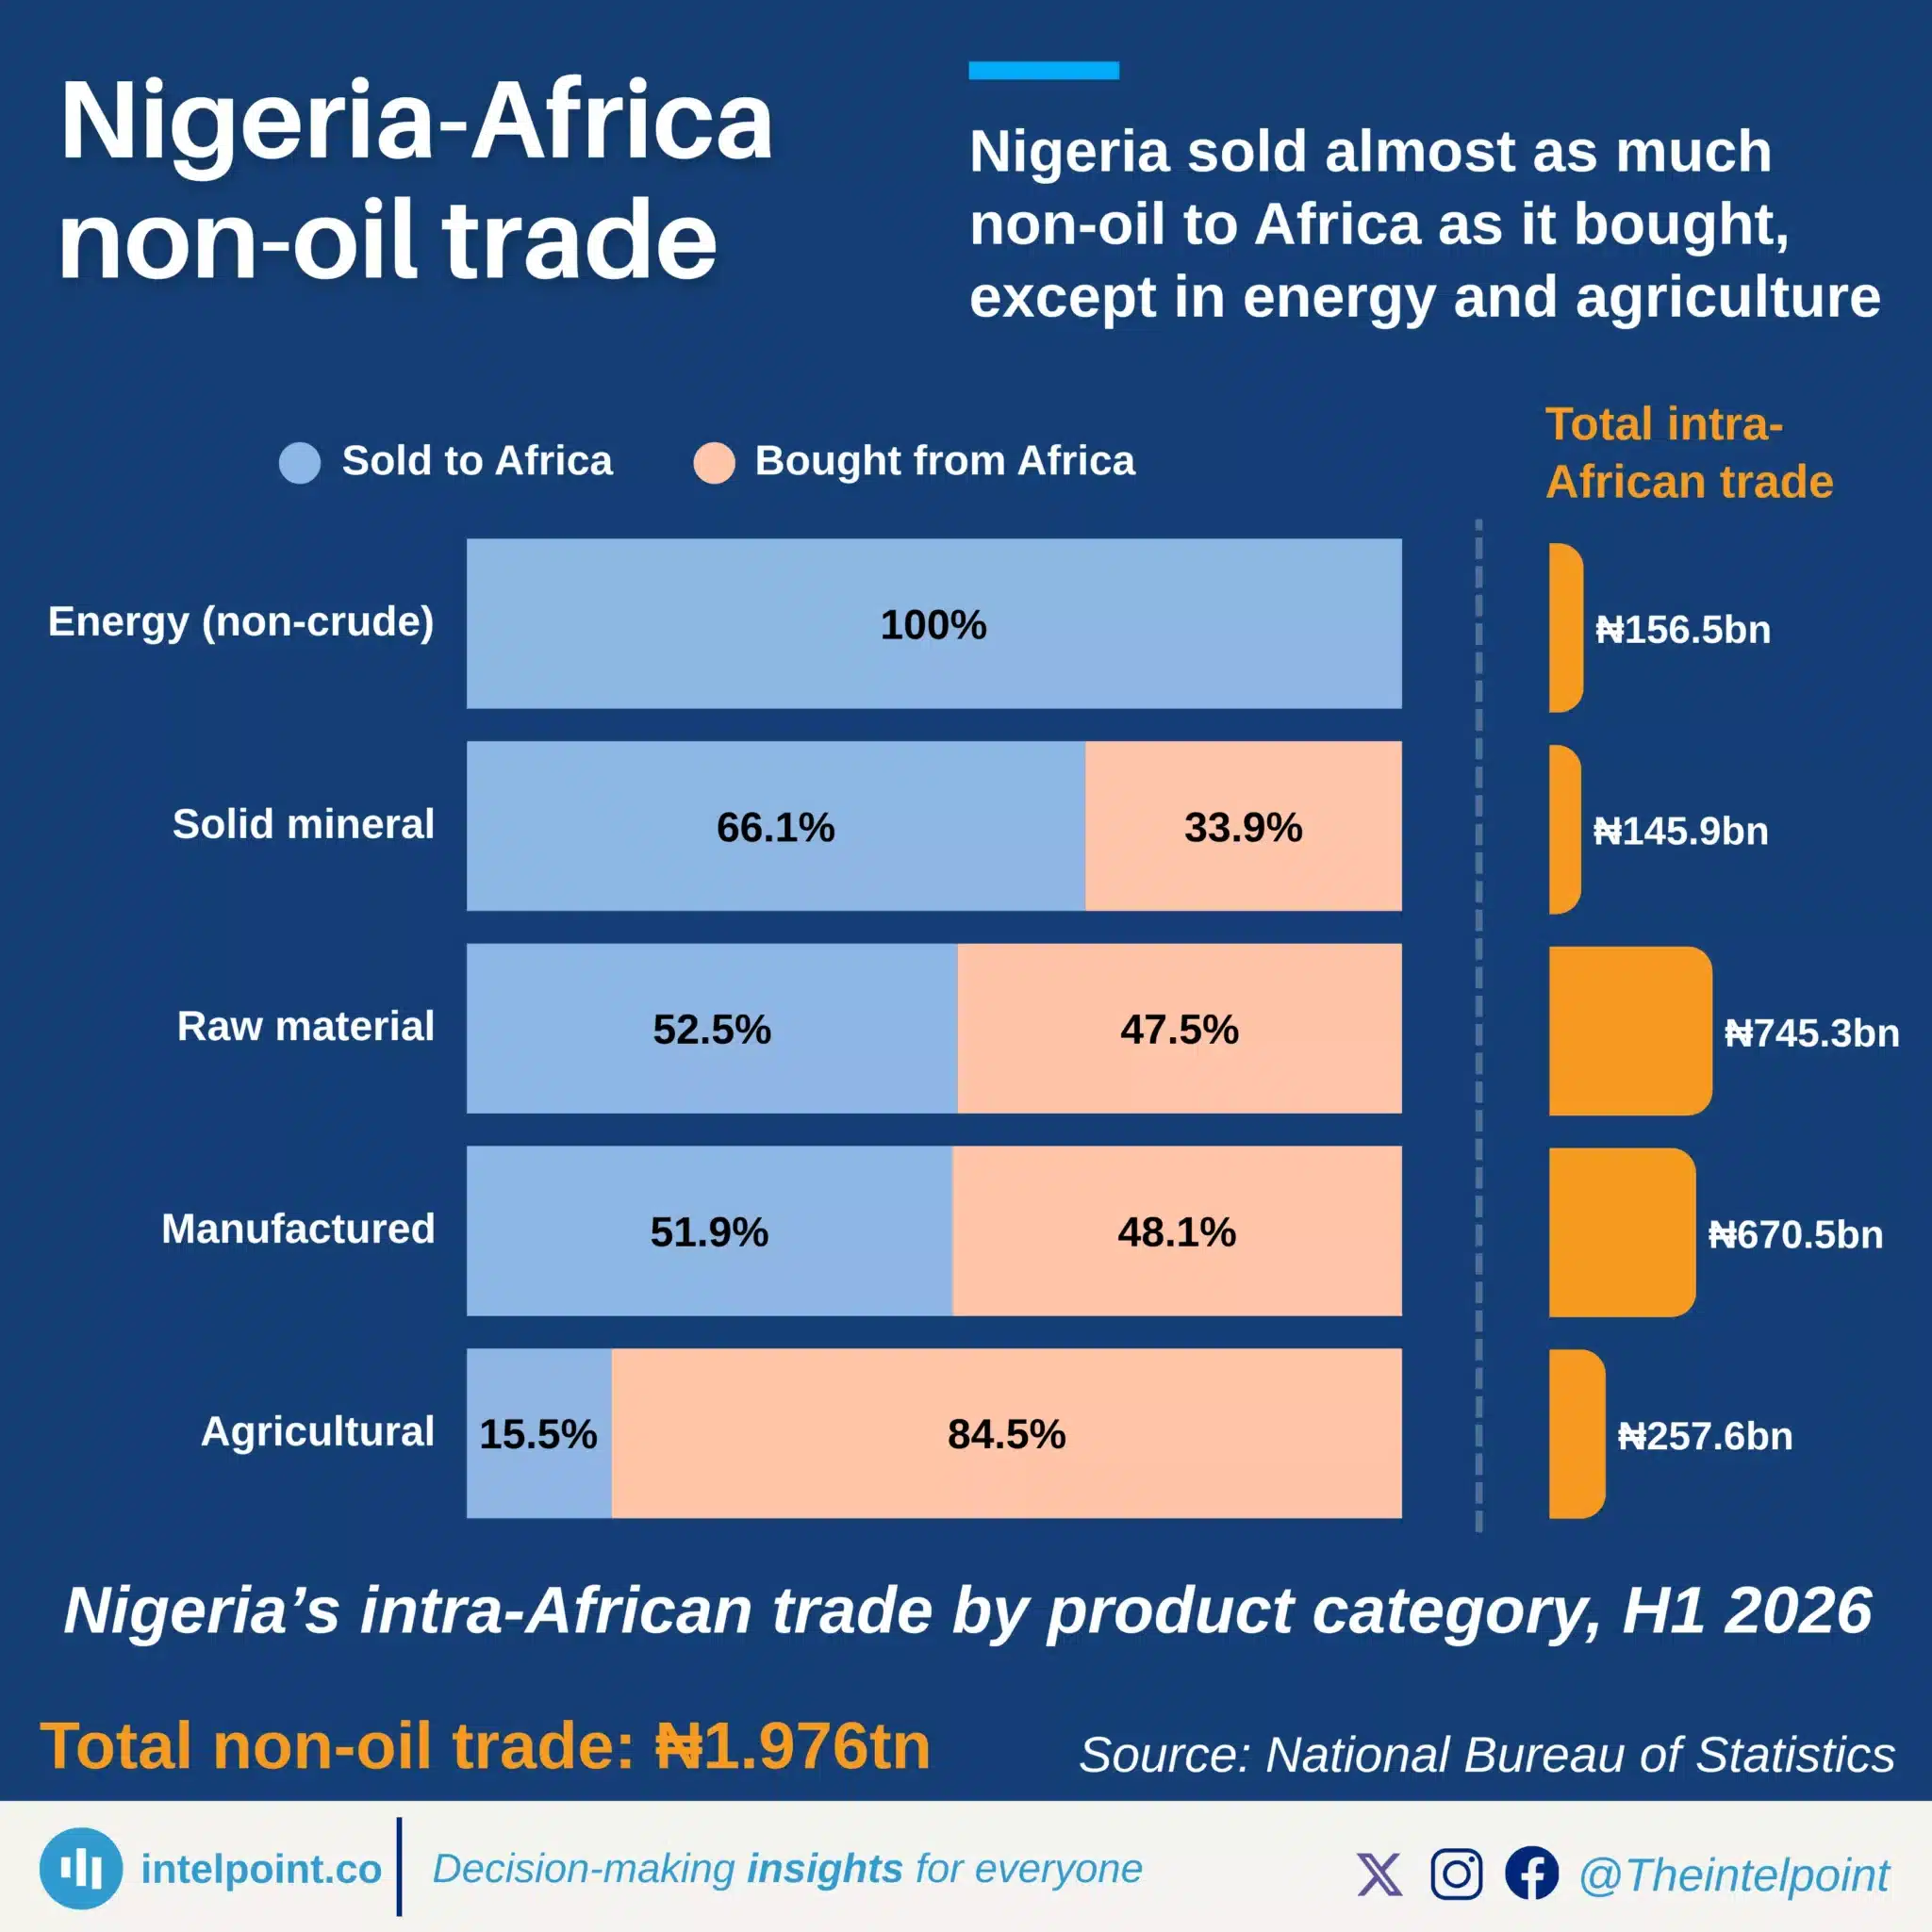
Nigeria sold almost as much non-oil to Africa as it bought, except in energy and agriculture
  • Nigeria’s non-oil trade with Africa was nearly balanced, with an ₦88bn surplus on almost ₦2tn of trade in H1 2026.
  • Energy trade was entirely export-led, with Nigeria selling ₦156.5bn and recording no imports.
  • Solid minerals also leaned towards exports, with sales making up 66.1% of category trade.
  • Agriculture ran a large deficit, as imports accounted for 84.5% of trade and exceeded exports by ₦178bn.
  • Nigeria’s agricultural trade deficit widened sharply, from ₦59bn in Q1 to ₦119bn in Q2.

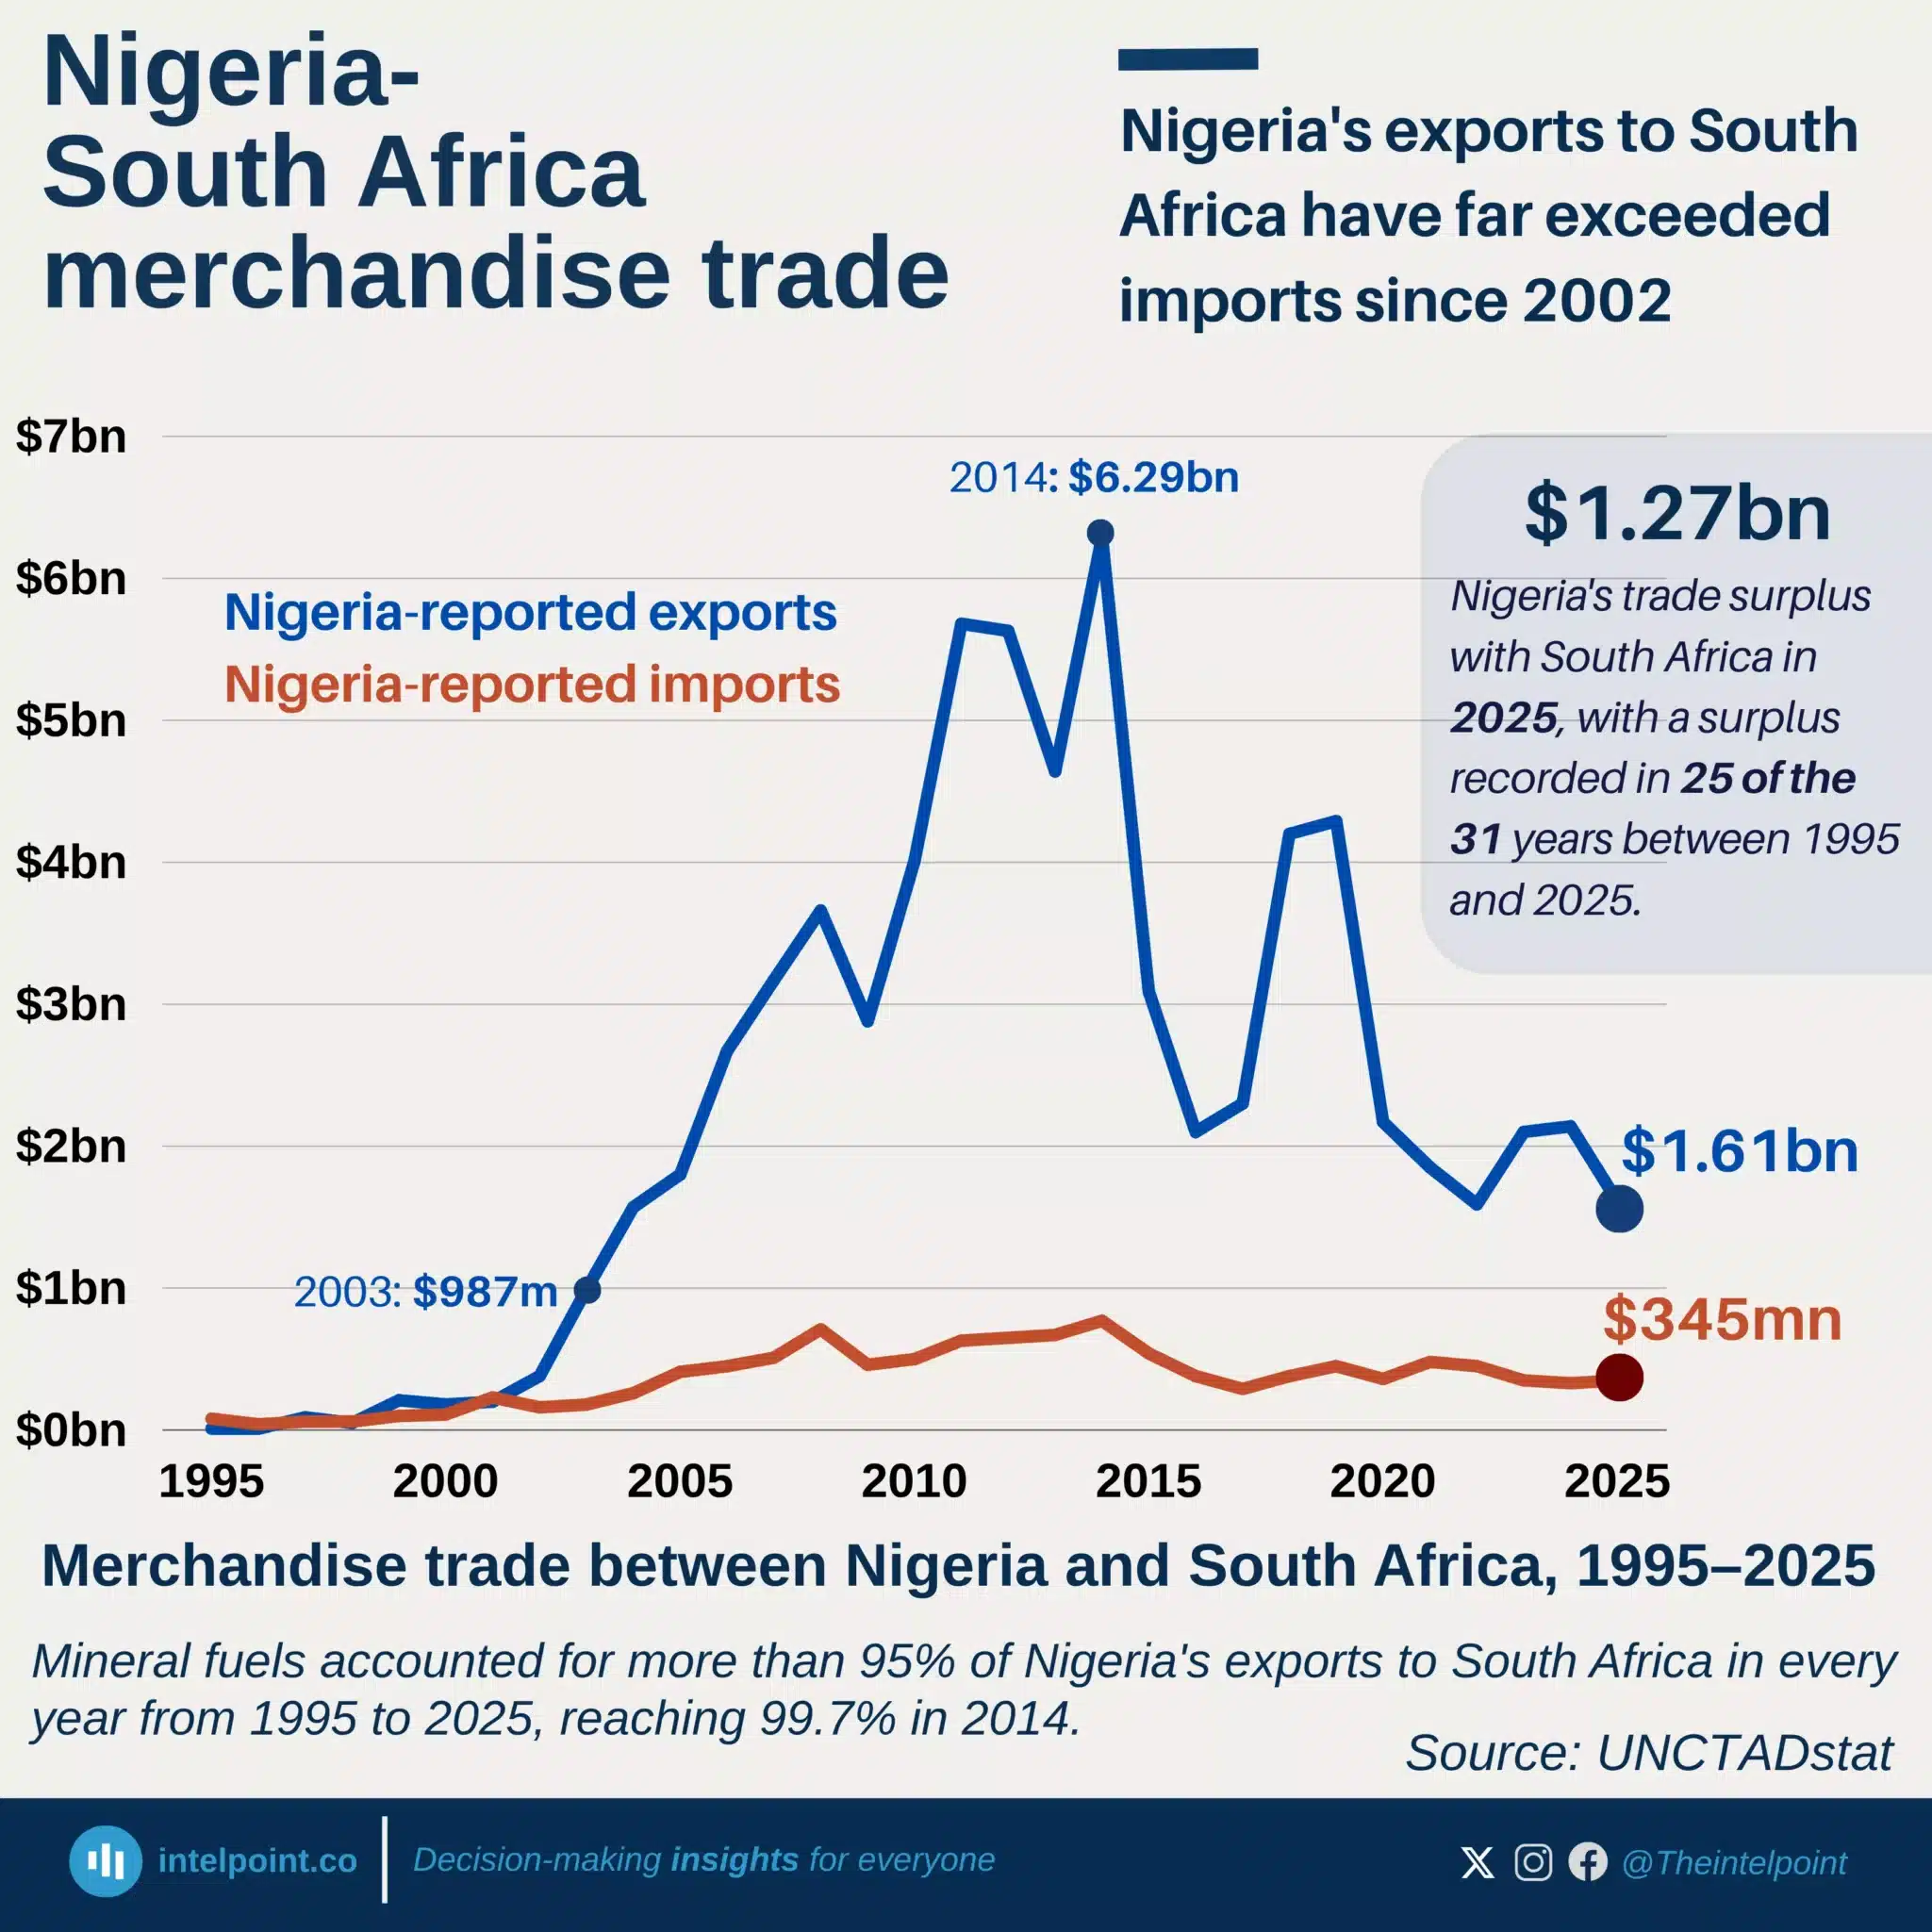
Nigeria's exports to South Africa have far exceeded imports since 2002
  • Nigeria has exported more to South Africa than it has imported every year since 2002.
  • Exports peaked at $6.29 billion in 2014, driven almost entirely by mineral fuels.
  • Imports from South Africa have remained below $1 billion annually.
  • Nigeria recorded a $1.27 billion trade surplus with South Africa in 2025.
  • Mineral fuels made up over 95% of Nigeria's exports throughout 1995-2025.

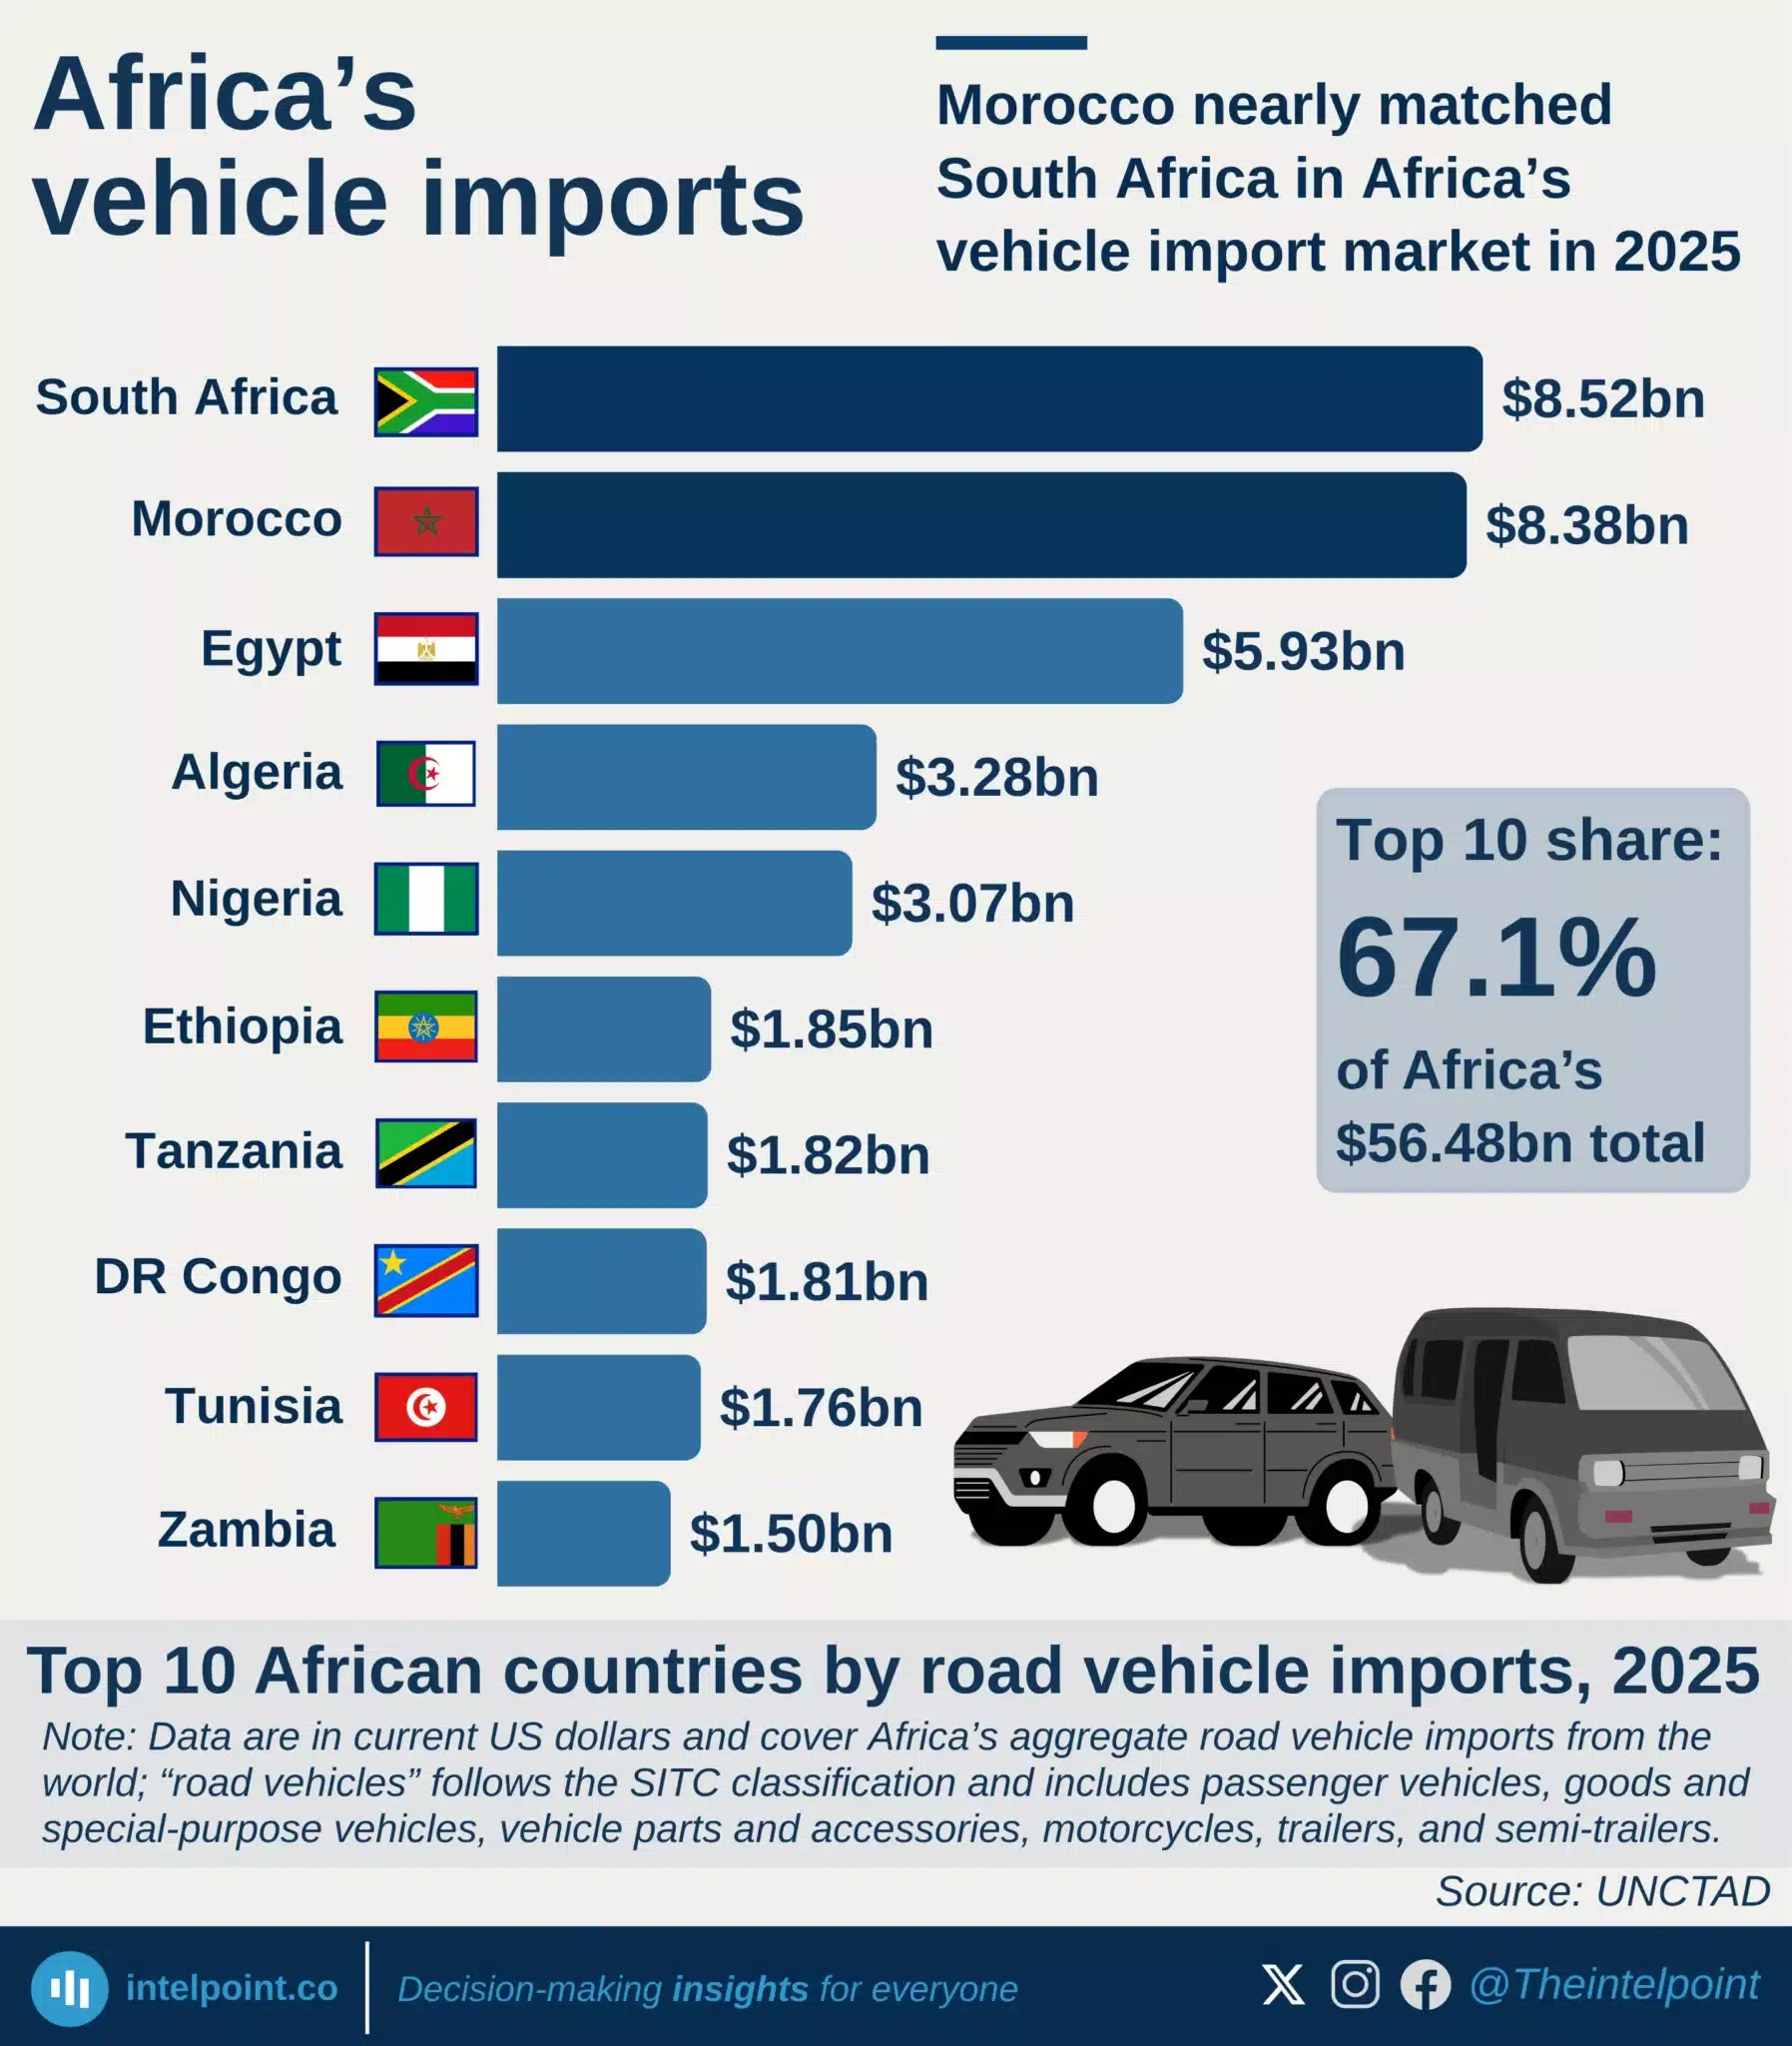
Morocco nearly matched South Africa in Africa’s vehicle import market in 2025
  • South Africa led with $8.52 billion, only $140 million ahead of Morocco.
  • Morocco’s imports have grown steadily, while South Africa’s 2025 figure was a recovery toward its 2012 peak.
  • Egypt ranked third, followed by Algeria and Nigeria.
  • The top 10 markets accounted for 67.1% of Africa’s $56.48 billion total.
  • Road vehicle imports include vehicles, parts, motorcycles, trailers, and semi-trailers.

POPULAR TOPICS
SIGN UP TO OUR NEWSLETTER
Get periodic updates about the African startup space, access to our reports, among others.
Subscribe Here
Subscription Form

A product of Techpoint Africa. All rights reserved