Over ₦825 trillion web payment transactions were made in the first six months of 2024

Key takeaways:

  • Web payment amassed a total transaction value of ₦825.5 trillion, showcasing its dominance in both frequency and financial significance.
  • With a Constant Annual Growth Rate of 150.4% (in volume) and 208.9% (in value), Web Pay has been leading the Nigerian Payment System in both transaction volume and value since 2020.
  • Mobile payments contribute 15.8% of transaction volume and 10.9% of transaction value, indicating growing adoption among tech-savvy users.
  • NEFT transactions represent 21.5% of the total transaction value, reflecting their importance for transferring large sums.
  • The dominance of web payments reflects Nigeria's ongoing transition to a cashless economy and widespread digital adoption.

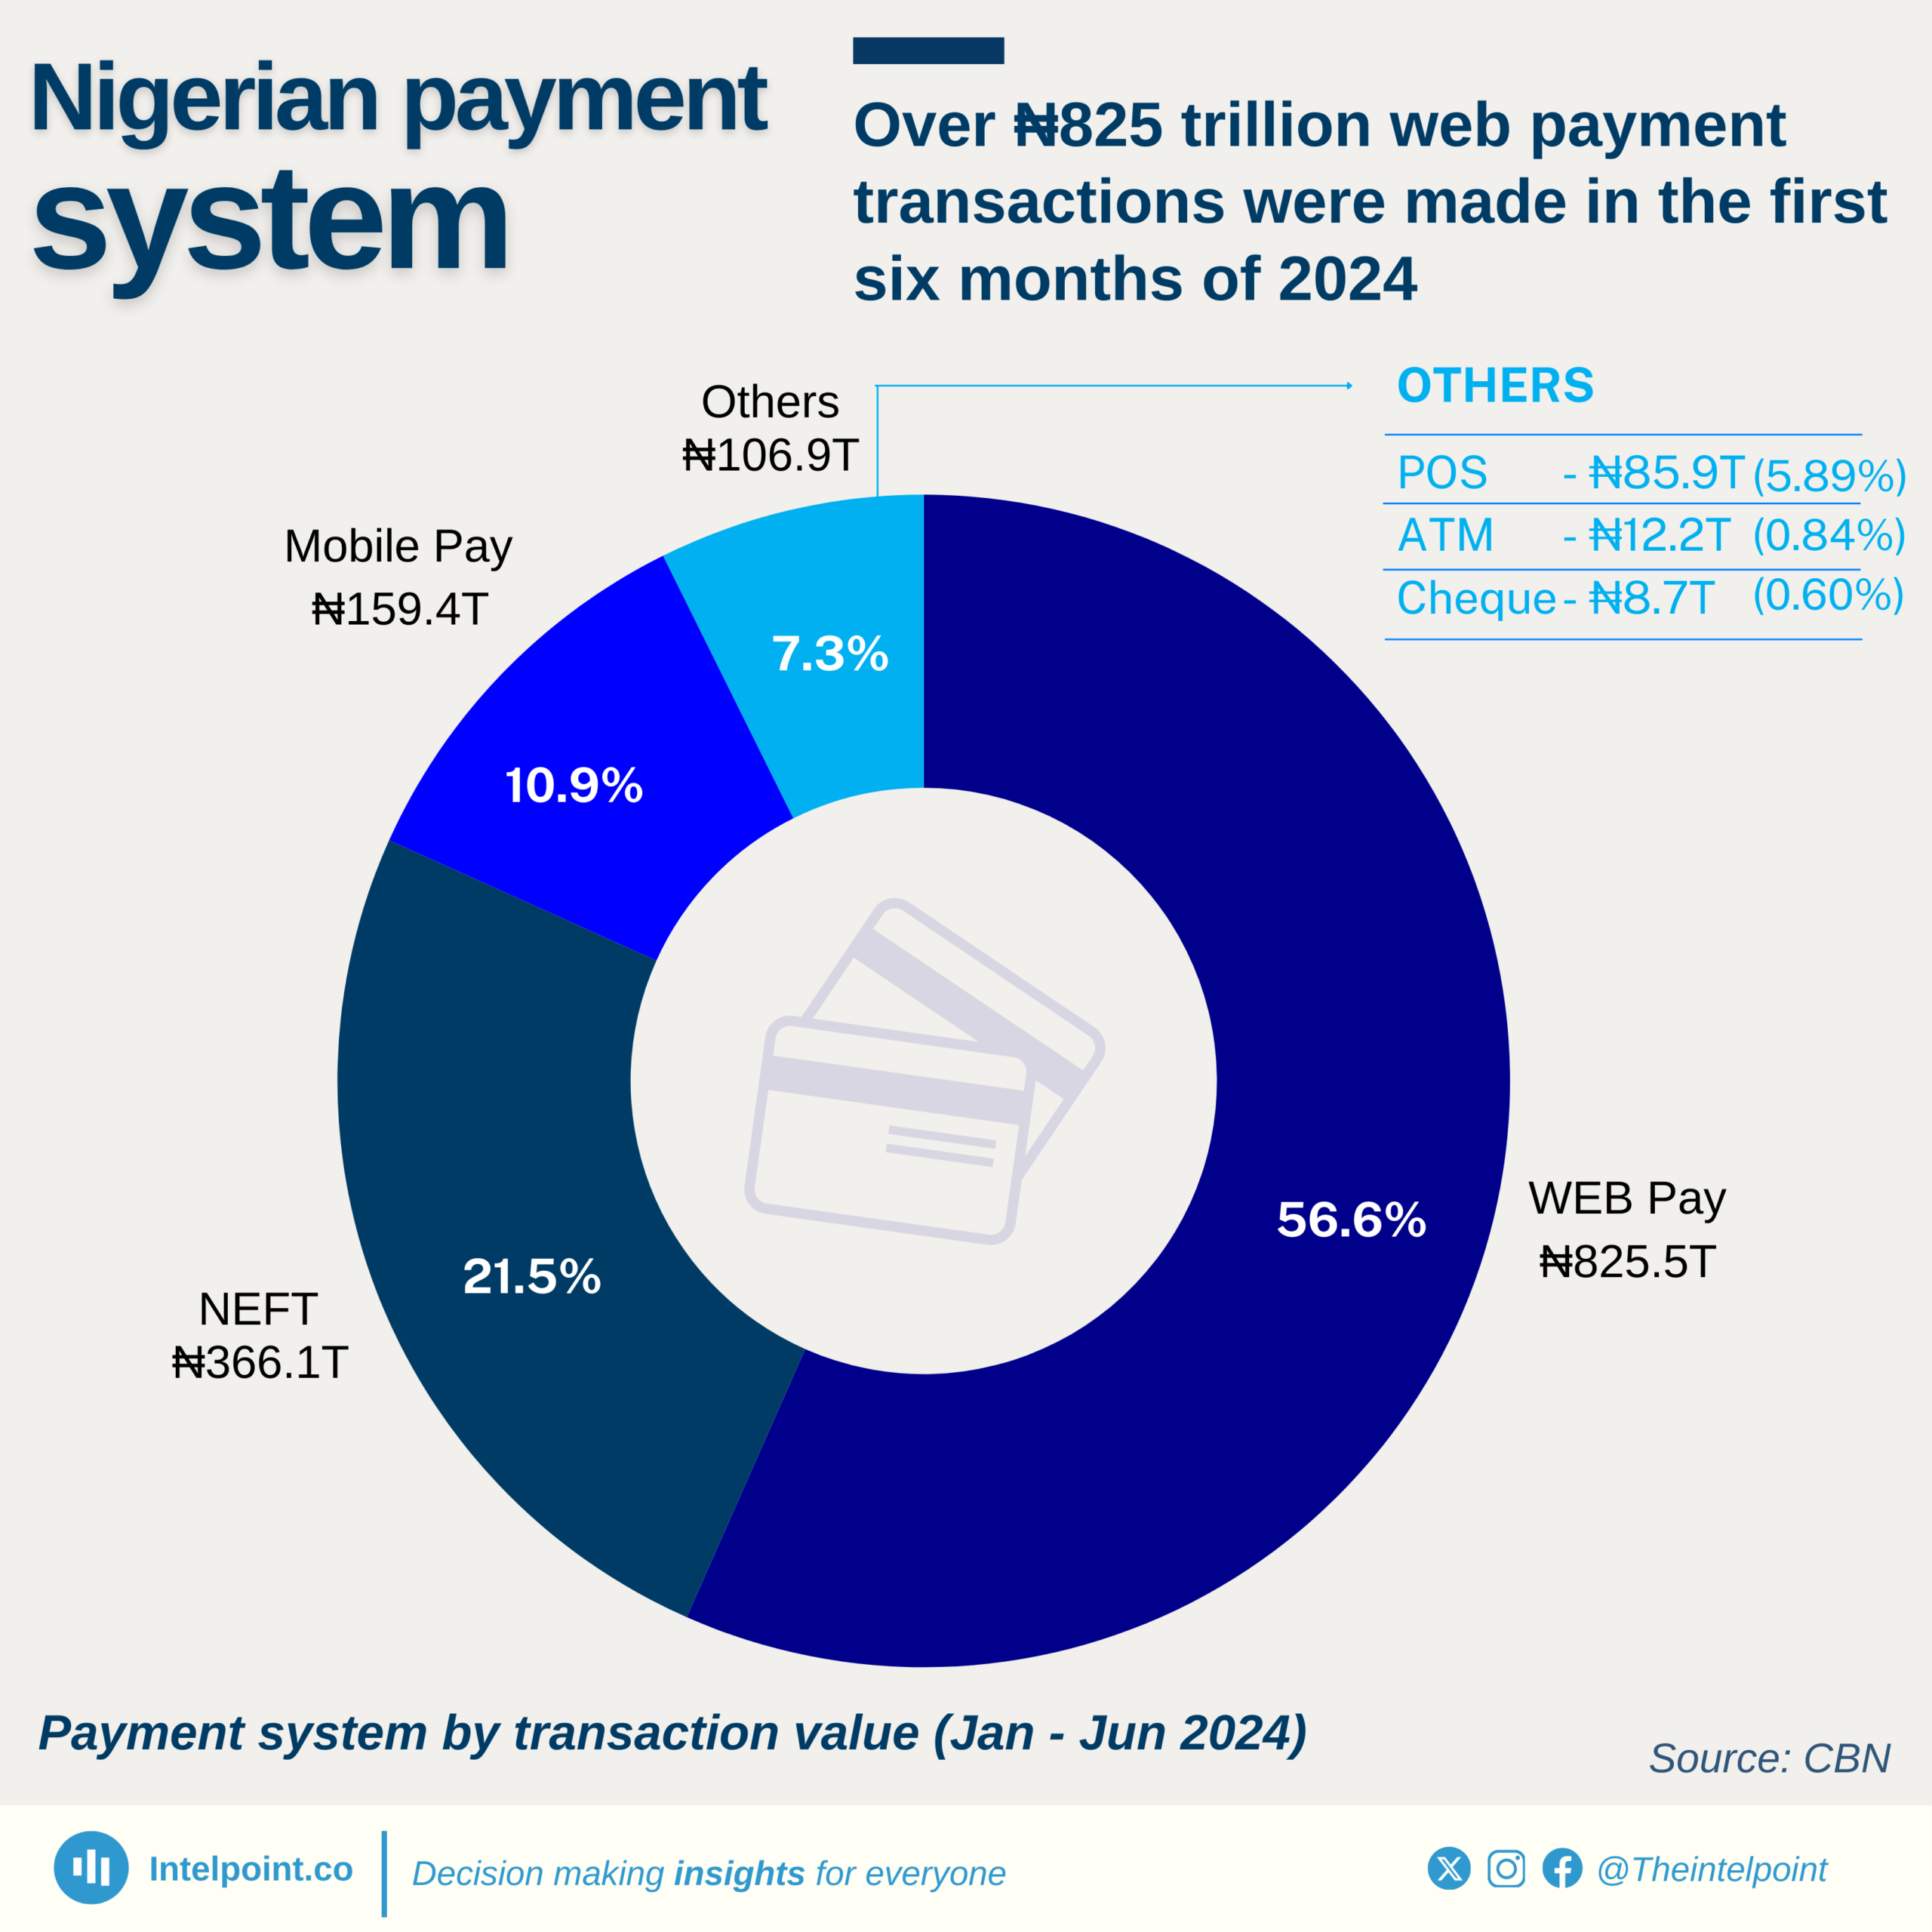
The first half of 2024 highlights the dominance of web payment systems in Nigeria, accounting for 52.7% of all transactions by volume and 56.6% by value. With about 11.64 billion transactions and ₦825.5 trillion in value, web payments lead the payment system landscape, solidifying its role as the go-to choice for seamless and efficient transactions. This shows Nigeria’s growing reliance on digital platforms for economic activity, paving the way for a cashless society.
Point-of-sale (POS) terminals and mobile payments also demonstrate strong adoption, contributing 29% and 15.8% of transaction volume, respectively. However, when analysed by value, NEFT (National Electronic Funds Transfer) ranks second, holding 21.5% of the total transaction value, indicating its preferability for high-value transactions.

Source:

CBN

Period:

2024
HTML code to embed chart
Want a bespoke report?
Reach out
Tags
Related Insights

Morocco leads Africa in digital trade surpluses, with $26 billion 20-year cumulative gain
  • Morocco achieved the highest cumulative surplus in Africa’s digital trade at $26.4 billion between 2005 and 2024.
  • Mauritius and Tunisia followed distantly with surpluses of $8.7 billion and $4.4 billion, respectively.
  • Nigeria and Angola recorded the deepest deficits, each exceeding $90 billion cumulatively.
  • Africa’s overall digital trade balance remained negative, averaging a -$618 million deficit in 2024.
  • Smaller economies like Kenya and Togo managed modest but consistent surpluses over the years.

In 2024, Asia and Europe together accounted for 63% of the world's copper export value
  • Asia leads global copper exports with 31.6% of total export value.
  • Europe follows closely at 31.4%, making the two regions nearly equal in contribution.
  • Combined, Asia and Europe control 63% of the global copper export market.
  • Africa ranks third globally, contributing 15.3% to copper exports.
  • Oceania plays the smallest role, with just 2% of the total export value.

Just 10 countries in Africa control 98% of the continent’s copper export value
  • The DR Congo is Africa’s copper giant, exporting $19.8 billion in 2024 (56.7% of the total).
  • Zambia follows with $7.6 billion, representing 21.7% of exports.
  • Together, the DR Congo and Zambia control almost 80% of Africa’s copper trade.
  • Tanzania is the third-largest exporter with $2.2 billion (6.3%).
  • Despite 52 African countries exporting copper, 42 of them collectively make up only 2% of the total value.

South Africa’s digital service imports still outweighed exports as of 2024, even after 300% growth since 2005
  • South Africa’s digital service imports consistently overshadowed export earnings, despite exports growing by over 300% since 2005.
  • South Africa exported $76.418 billion in digital services between 2005 and 2024.
  • Imports during the same period reached $113.67 billion.
  • The result was a trade deficit of $37.252 billion in over 20 years.
  • Exports rose from just $1.71 billion in 2005 to $7.05 billion in 2024.

Ghana recorded $53.00B in digital services imports against $49.1B in exports in 20 years
  • Ghana exported $49.11 billion in digital services between 2005 and 2024.
  • Digital services imports recorded during the same period was $53.00 billion.
  • Ghana recorded a $3.9 billion trade deficit across the two decades.
  • Exports grew from just $78 million in 2005 to $5.18 billion in 2024.

Since 2005, Egypt’s digital service imports have consistently exceeded exports, creating a $56b deficit
  • Egypt spends twice as much on digital services imports than it earns from exports, with $8.31b on imports and $4.03b from exports recorded in 2024.
  • Egypt exported $46.007 billion in digital services between 2005 and 2024.
  • Imports during the same period reached $101.98 billion.
  • The result was a trade deficit of $55.973 billion in over 20 years.
  • Export earnings rose from just $1.91 billion in 2005 to $4.03 billion in 2024.

POPULAR TOPICS
SIGN UP TO OUR NEWSLETTER
Get periodic updates about the African startup space, access to our reports, among others.
Subscribe Here
Subscription Form

A product of Techpoint Africa. All rights reserved