Only 8 African countries get less than 60% of their export earnings from raw goods, with Tunisia leading at 21.5%

  • Of the 54 African countries, 46 earn more than 60% of export revenues from raw goods.
  • Algeria, Morocco, Eswatini, Lesotho, Djibouti, Mauritius, Comoros, and Egypt stand out with less than 60%.
  • Algeria and Morocco are the least dependent, pointing to stronger industrial and trade sectors.
  • Lower dependence means greater economic stability, while high reliance exposes countries to volatile global commodity markets.

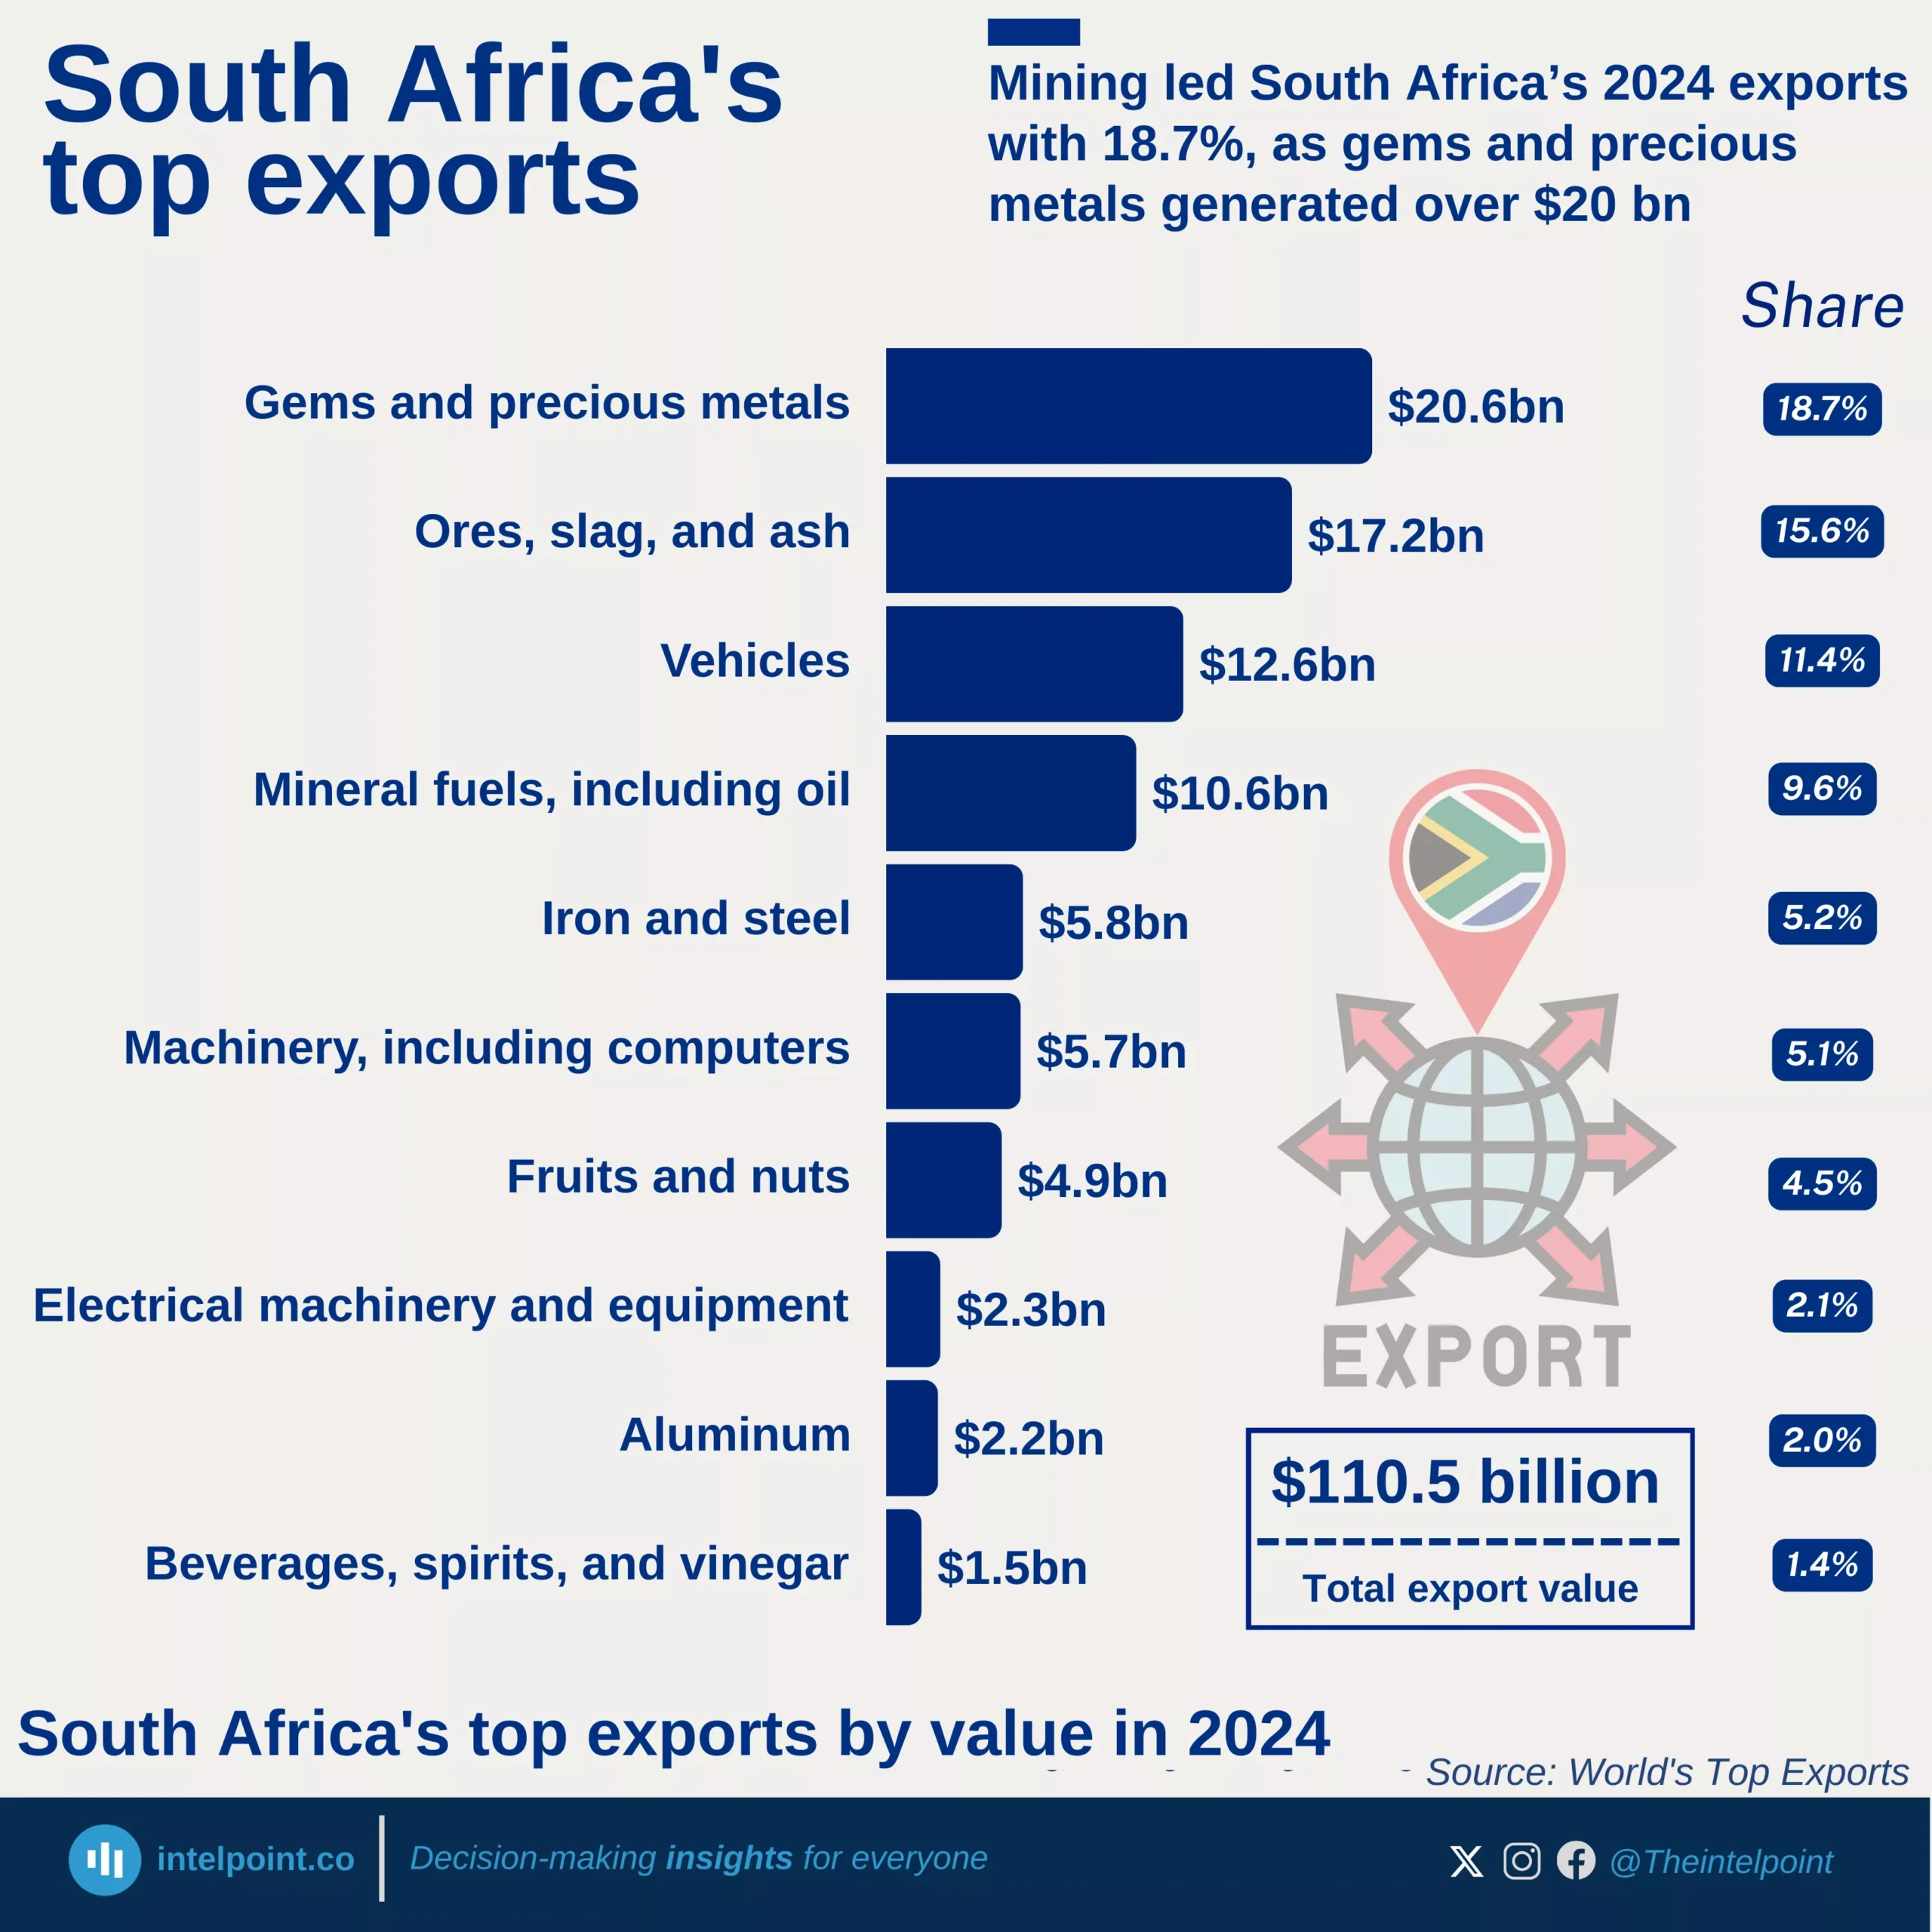
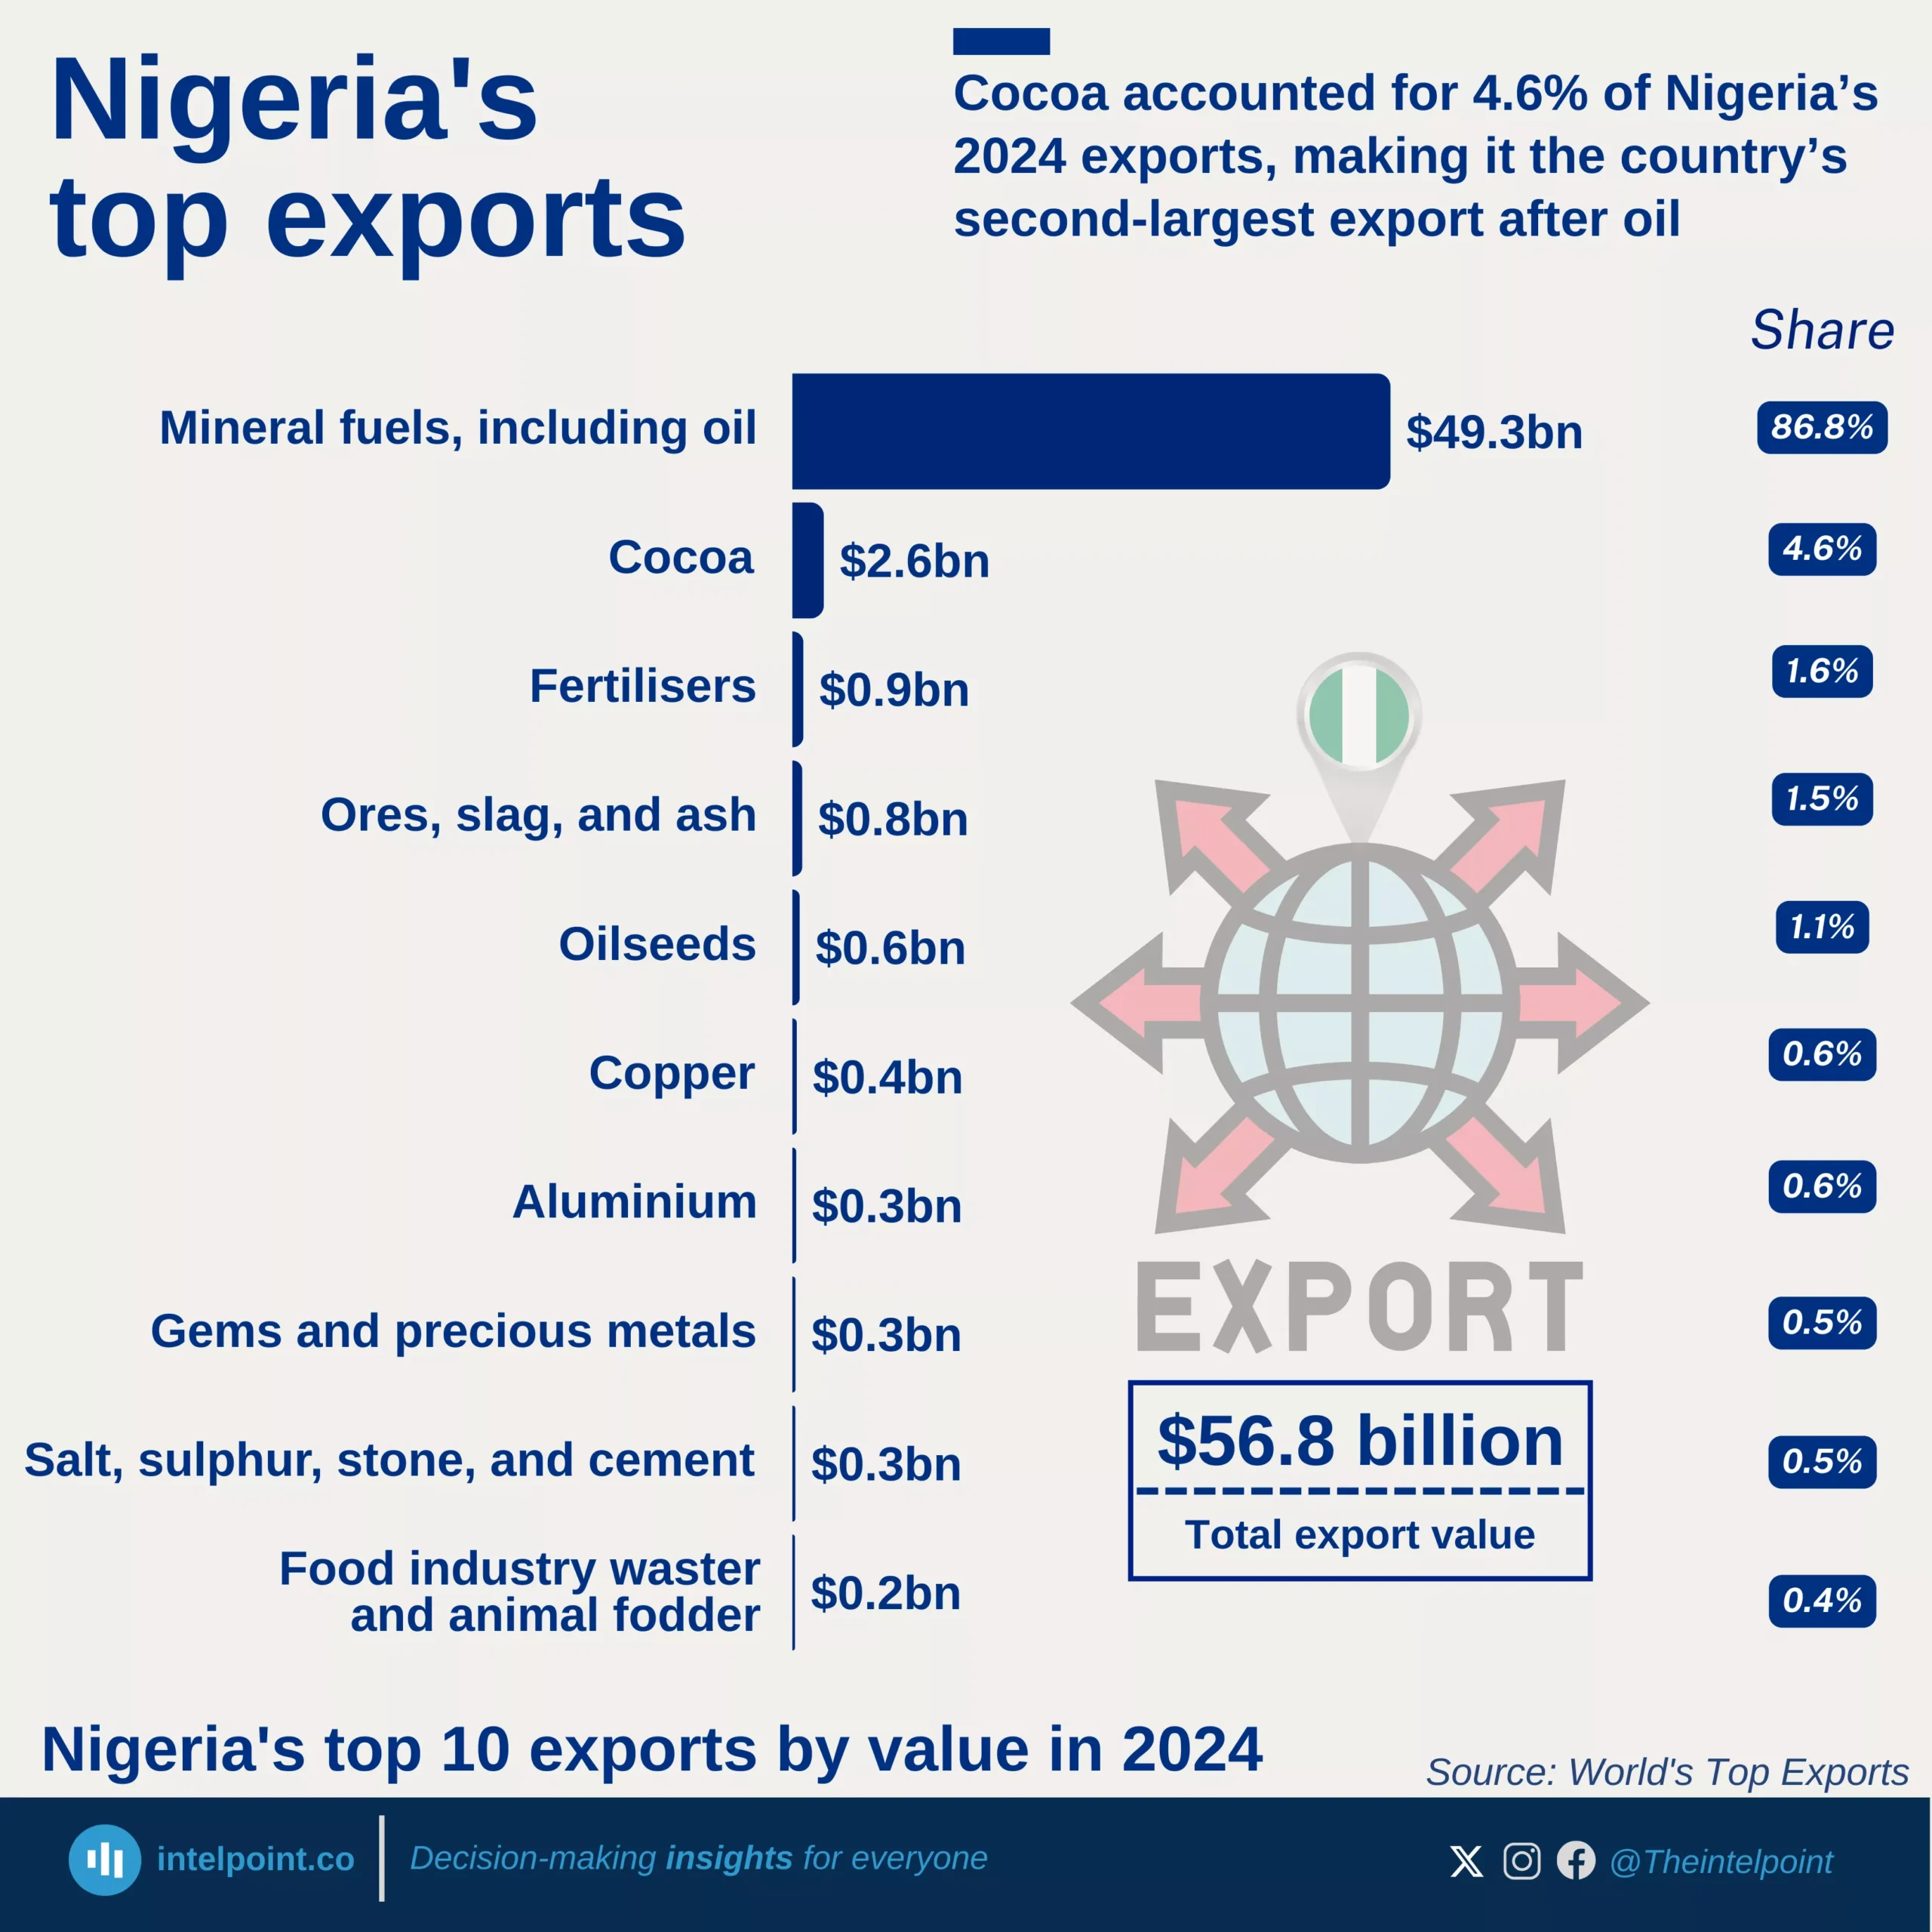
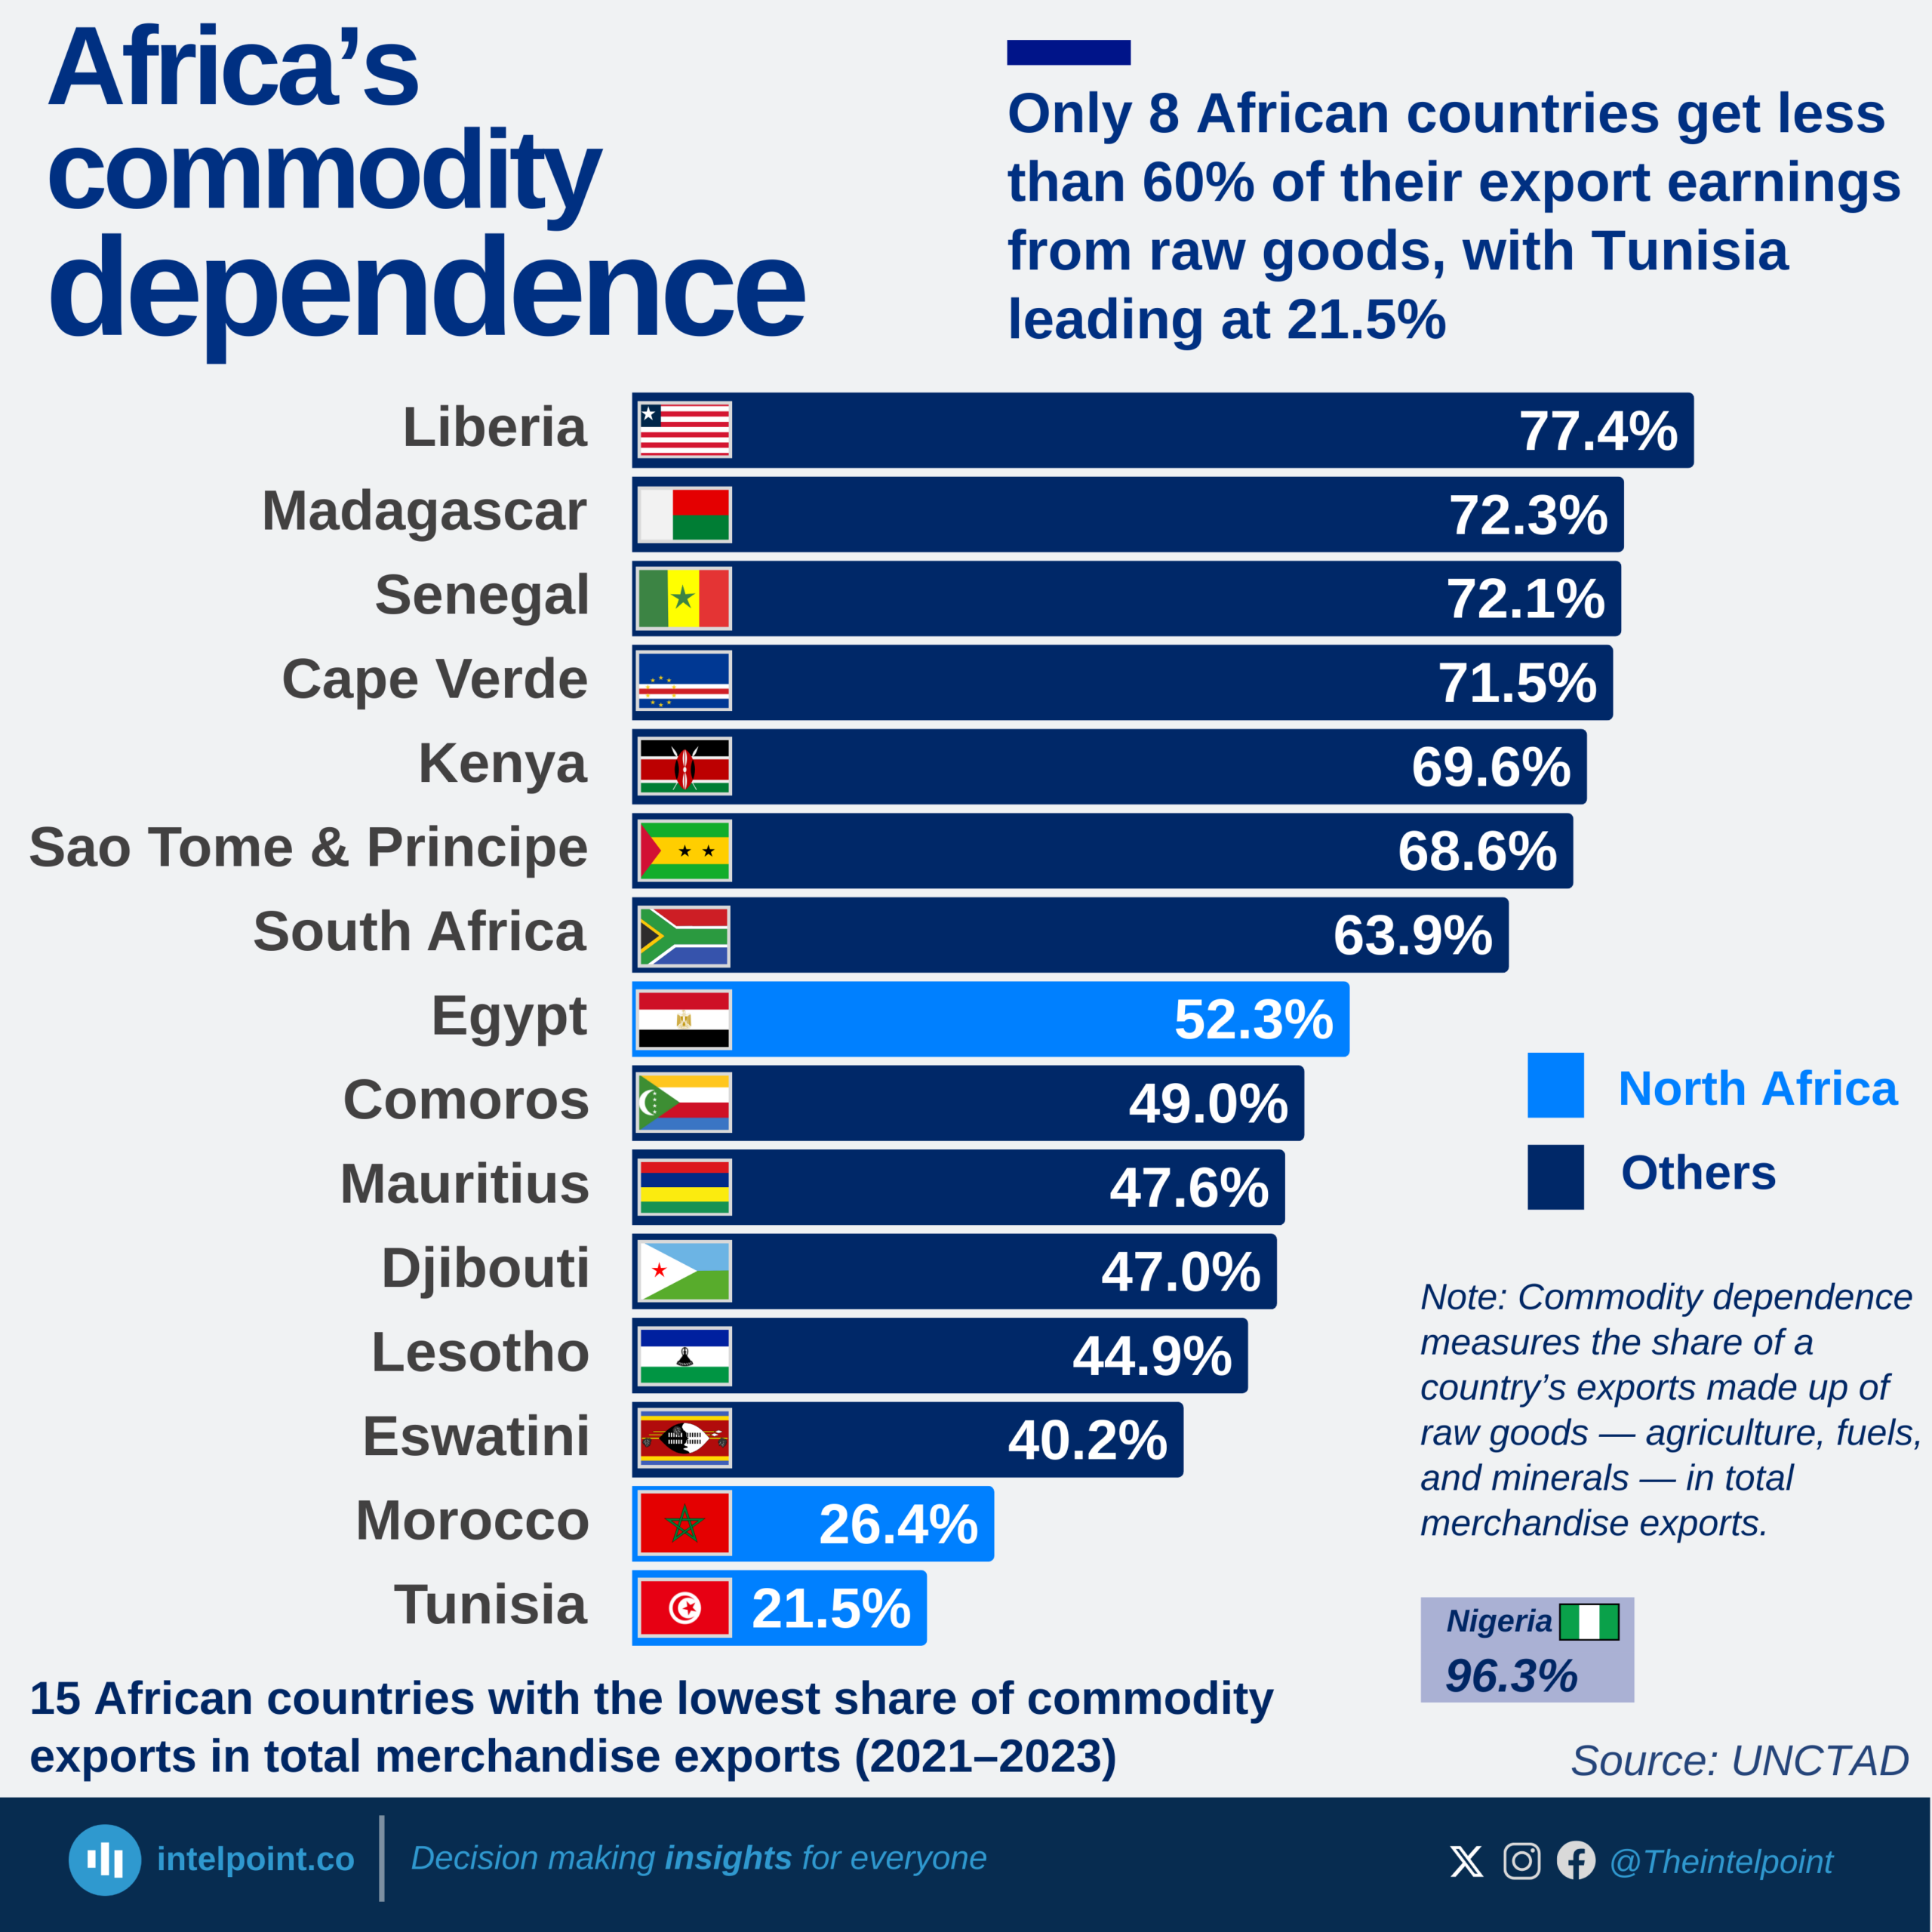
Across Africa, most economies remain heavily tied to raw goods — oil, minerals, and agricultural products — for the bulk of their export revenues. UNCTAD data for 2021–2023 shows that out of 54 countries, only eight managed to keep their dependence below 60%.

These eight are Tunisia, Morocco, Eswatini, Lesotho, Djibouti, Mauritius, Comoros, and Egypt. Their relatively low reliance reflects stronger export diversification, often in manufacturing, services, or re-exports. For instance, North African economies like Tunisia and Morocco benefit from industrial output and trade logistics, while Mauritius and Djibouti rely on services and re-export hubs.

Countries with less dependence on raw goods tend to be less vulnerable to global commodity price swings, giving them more stable revenue bases and resilience in downturns. For much of Africa, however, the dominance of commodities leaves economies exposed, underlining the urgent need for structural diversification.

Source:

UN Trade and Development (UNCTAD)

Period:

2021-2023
HTML code to embed chart
Want a bespoke report?
Reach out
Tags
Related Insights

Morocco leads Africa in digital trade surpluses, with $26 billion 20-year cumulative gain
  • Morocco achieved the highest cumulative surplus in Africa’s digital trade at $26.4 billion between 2005 and 2024.
  • Mauritius and Tunisia followed distantly with surpluses of $8.7 billion and $4.4 billion, respectively.
  • Nigeria and Angola recorded the deepest deficits, each exceeding $90 billion cumulatively.
  • Africa’s overall digital trade balance remained negative, averaging a -$618 million deficit in 2024.
  • Smaller economies like Kenya and Togo managed modest but consistent surpluses over the years.

In 2024, Asia and Europe together accounted for 63% of the world's copper export value
  • Asia leads global copper exports with 31.6% of total export value.
  • Europe follows closely at 31.4%, making the two regions nearly equal in contribution.
  • Combined, Asia and Europe control 63% of the global copper export market.
  • Africa ranks third globally, contributing 15.3% to copper exports.
  • Oceania plays the smallest role, with just 2% of the total export value.

Just 10 countries in Africa control 98% of the continent’s copper export value
  • The DR Congo is Africa’s copper giant, exporting $19.8 billion in 2024 (56.7% of the total).
  • Zambia follows with $7.6 billion, representing 21.7% of exports.
  • Together, the DR Congo and Zambia control almost 80% of Africa’s copper trade.
  • Tanzania is the third-largest exporter with $2.2 billion (6.3%).
  • Despite 52 African countries exporting copper, 42 of them collectively make up only 2% of the total value.

South Africa’s digital service imports still outweighed exports as of 2024, even after 300% growth since 2005
  • South Africa’s digital service imports consistently overshadowed export earnings, despite exports growing by over 300% since 2005.
  • South Africa exported $76.418 billion in digital services between 2005 and 2024.
  • Imports during the same period reached $113.67 billion.
  • The result was a trade deficit of $37.252 billion in over 20 years.
  • Exports rose from just $1.71 billion in 2005 to $7.05 billion in 2024.

Ghana recorded $53.00B in digital services imports against $49.1B in exports in 20 years
  • Ghana exported $49.11 billion in digital services between 2005 and 2024.
  • Digital services imports recorded during the same period was $53.00 billion.
  • Ghana recorded a $3.9 billion trade deficit across the two decades.
  • Exports grew from just $78 million in 2005 to $5.18 billion in 2024.

Since 2005, Egypt’s digital service imports have consistently exceeded exports, creating a $56b deficit
  • Egypt spends twice as much on digital services imports than it earns from exports, with $8.31b on imports and $4.03b from exports recorded in 2024.
  • Egypt exported $46.007 billion in digital services between 2005 and 2024.
  • Imports during the same period reached $101.98 billion.
  • The result was a trade deficit of $55.973 billion in over 20 years.
  • Export earnings rose from just $1.91 billion in 2005 to $4.03 billion in 2024.

POPULAR TOPICS
SIGN UP TO OUR NEWSLETTER
Get periodic updates about the African startup space, access to our reports, among others.
Subscribe Here
Subscription Form

A product of Techpoint Africa. All rights reserved