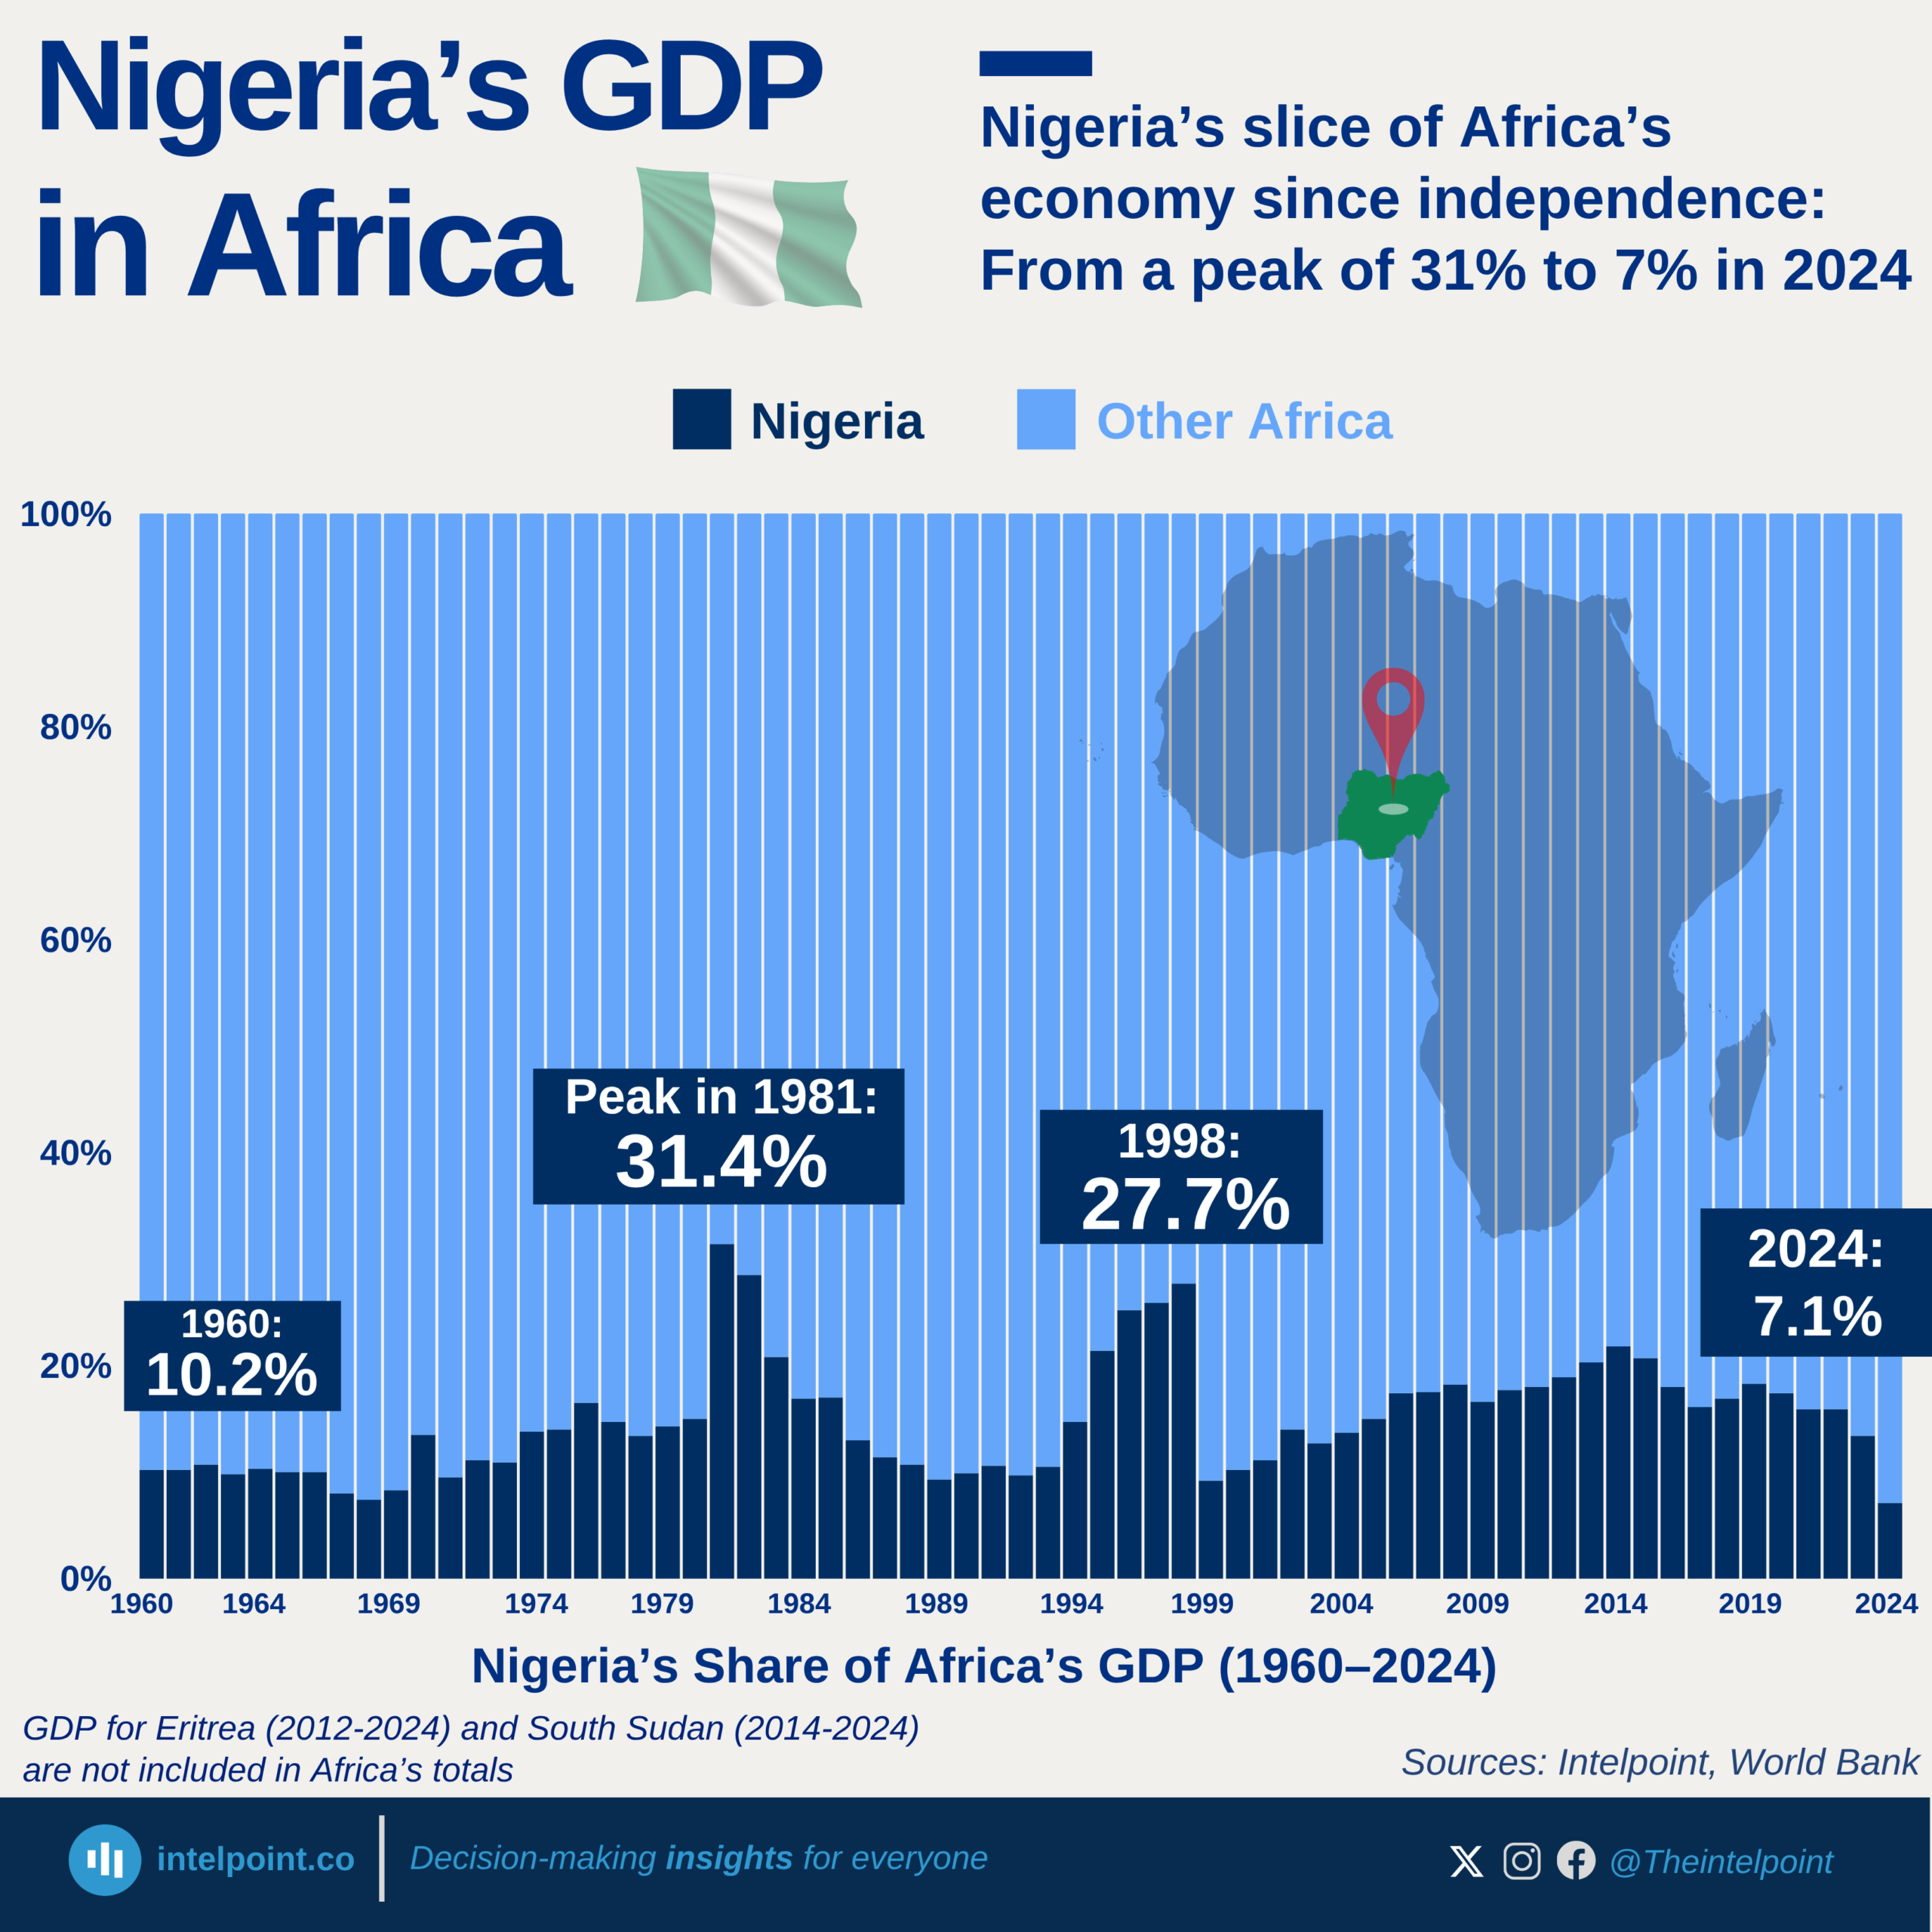
From independence in 1960, Nigeria consistently contributed about 10% of Africa’s GDP, a modest but notable share of the continent’s economic pie. For the first two decades, its share hovered around 10–16%, even as nominal GDP grew from $4.2 billion to $36.3 billion by 1976.
The oil boom of the late 1970s and early 1980s caused Nigeria’s slice of the African economy to expand dramatically, peaking at 31% in 1981, making it the dominant economy on the continent. Yet, as oil prices fluctuated and economic mismanagement took its toll, Nigeria’s share dropped sharply in the mid-1980s to around 13–17%, showing how volatile dependence on a single sector can be.
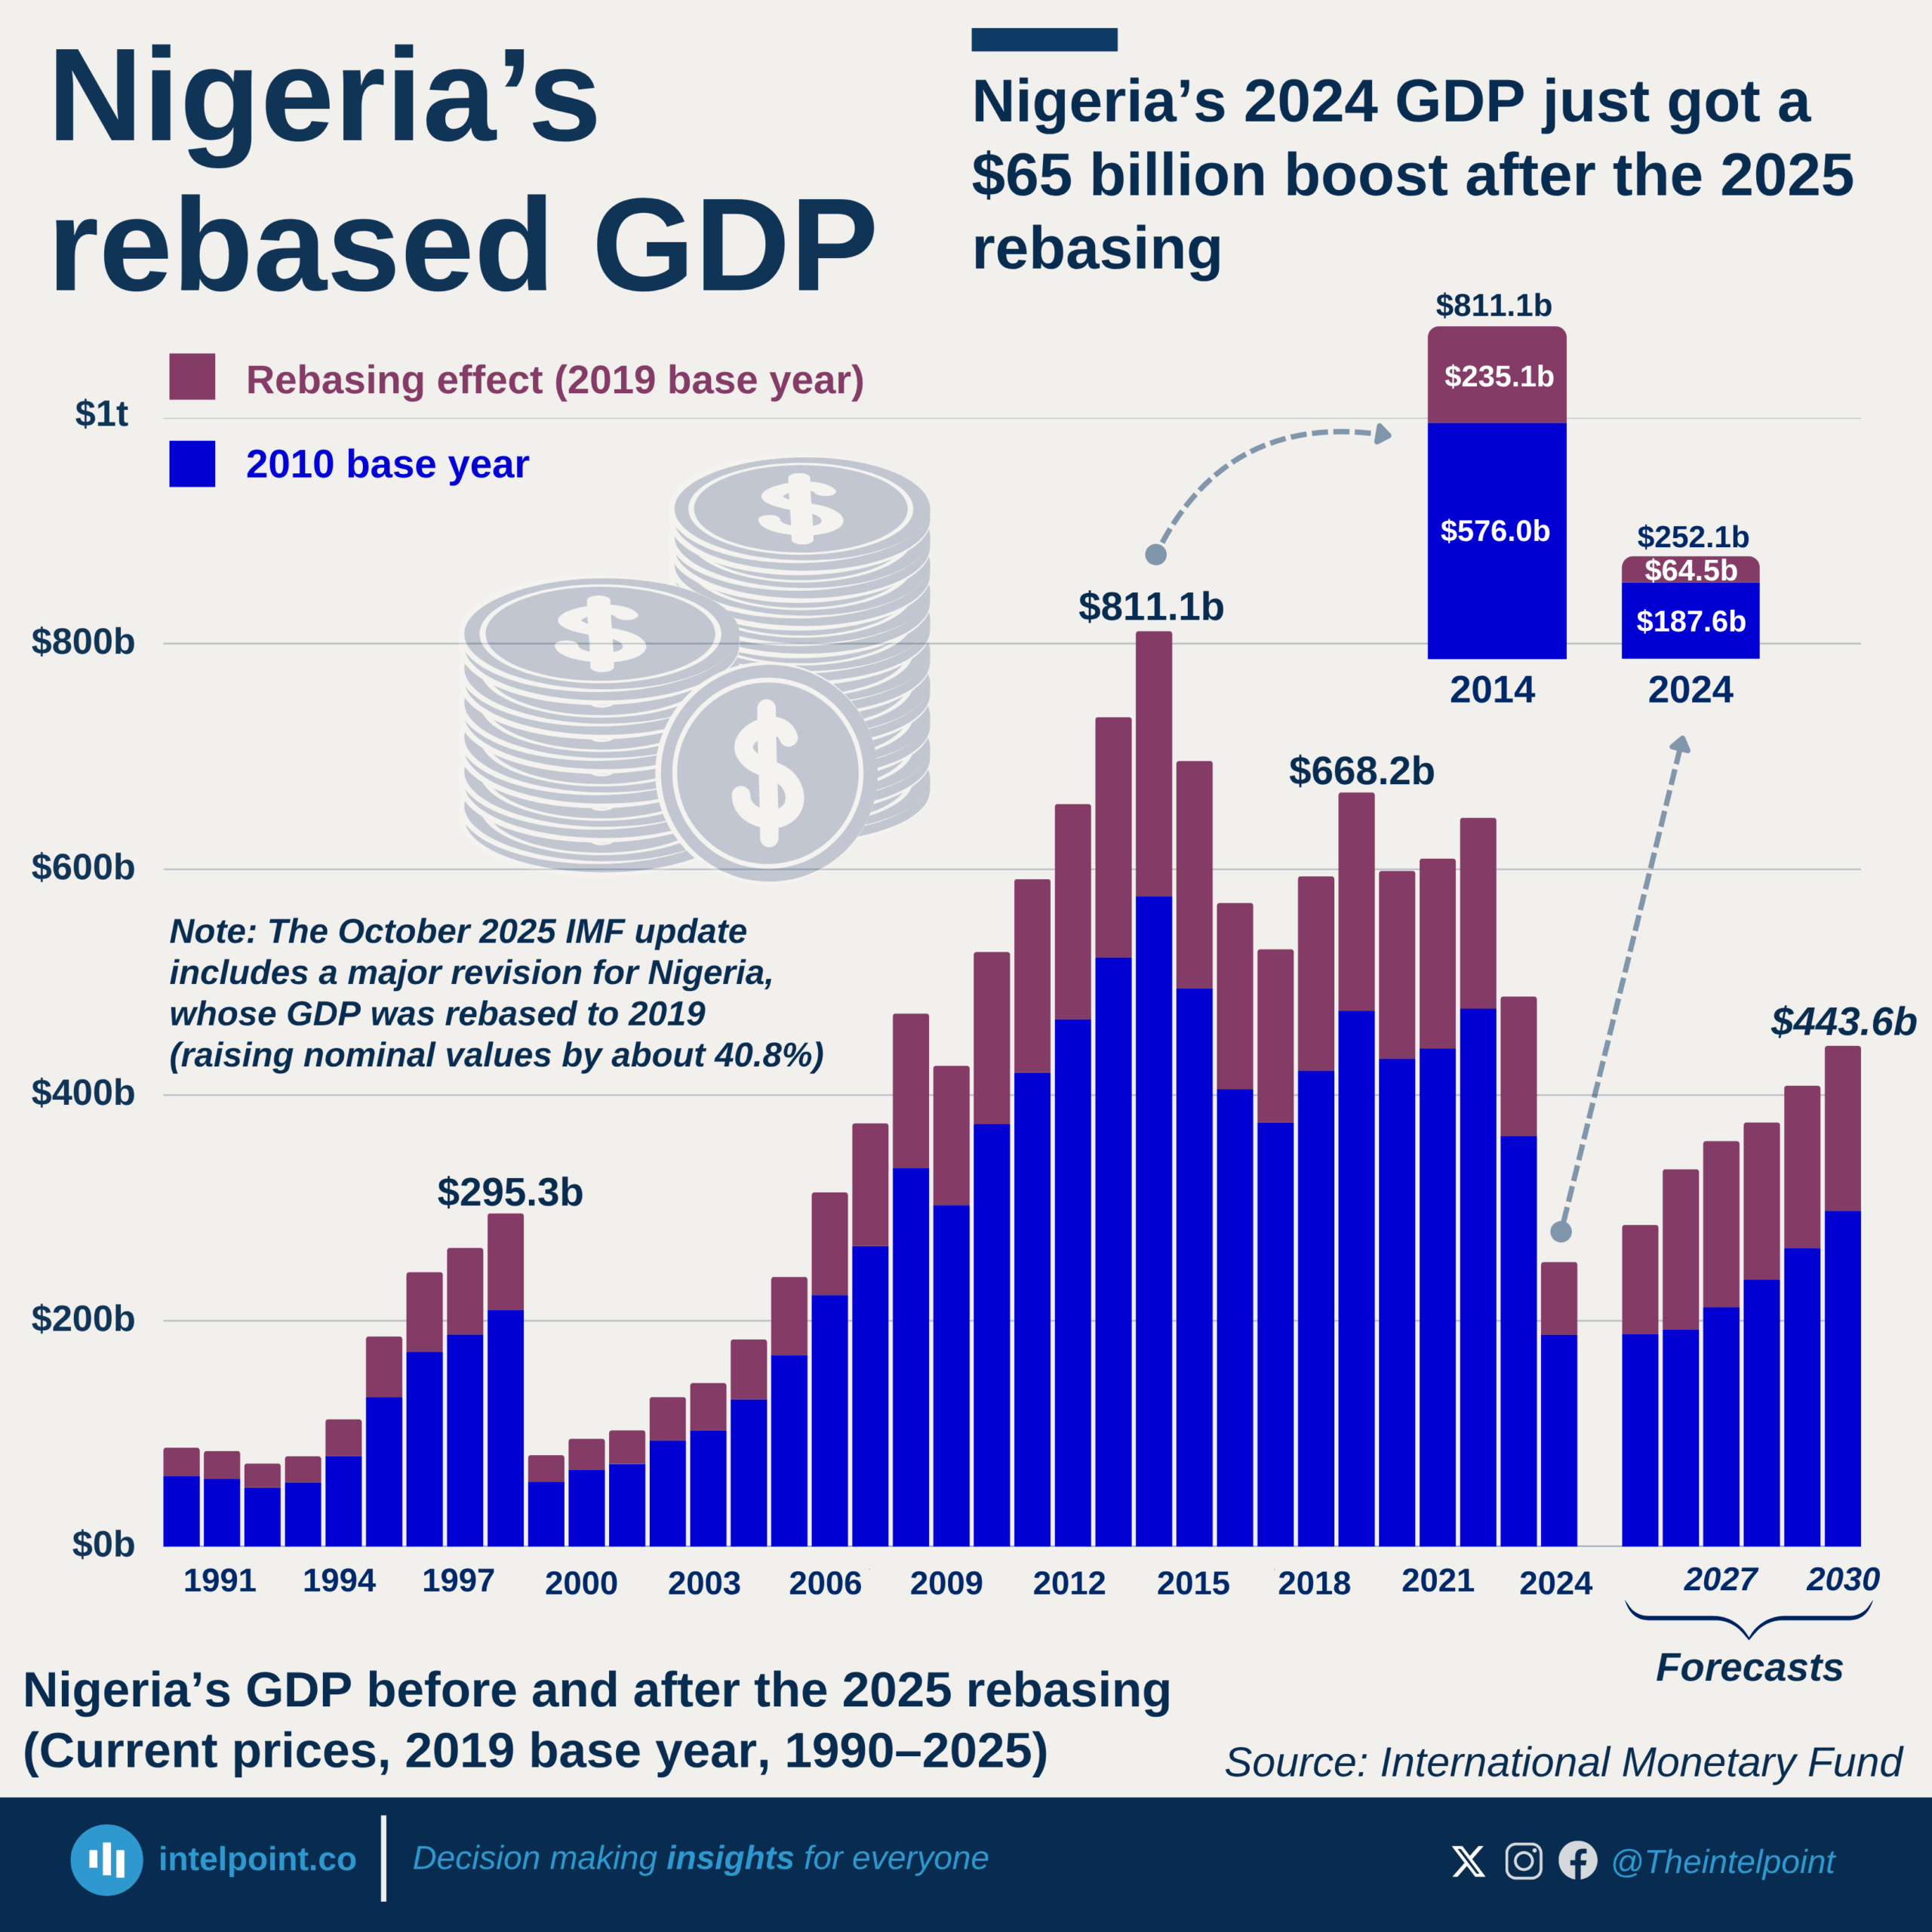
The 1990s and 2000s tell a story of recovery and growth. Nigeria’s share climbed again, reaching 27.7% in 1998 before a steep drop to 9.2% in 1999, reflecting political turmoil. By the 2010s, Nigeria maintained a more stable 16–22% share, with GDP hitting $574 billion in 2014, demonstrating sustained growth alongside Africa’s expanding economy. Yet, the latest data from 2024 shows Nigeria’s share at just 7.1%, despite a GDP of $187.8 billion, highlighting both domestic economic challenges and the rise of other African economies. The graph of Nigeria versus the rest of Africa tells a story of a nation whose relative influence has ebbed and flowed, reminding us that independence brought both opportunity and responsibility for sustained growth.