Nigeria’s power grid is 69.9% powered by thermal plants

Key Takeaways

  • Thermal energy dominates Nigeria’s grid, supplying 69.9% of total power.
  • Hydro plants contribute 30.1%, making them the country’s second major source.
  • The heavy reliance on thermal generation shows Nigeria’s grid is still largely fossil-fuel driven.
  • Hydro remains a crucial but secondary source, supporting overall supply stability.

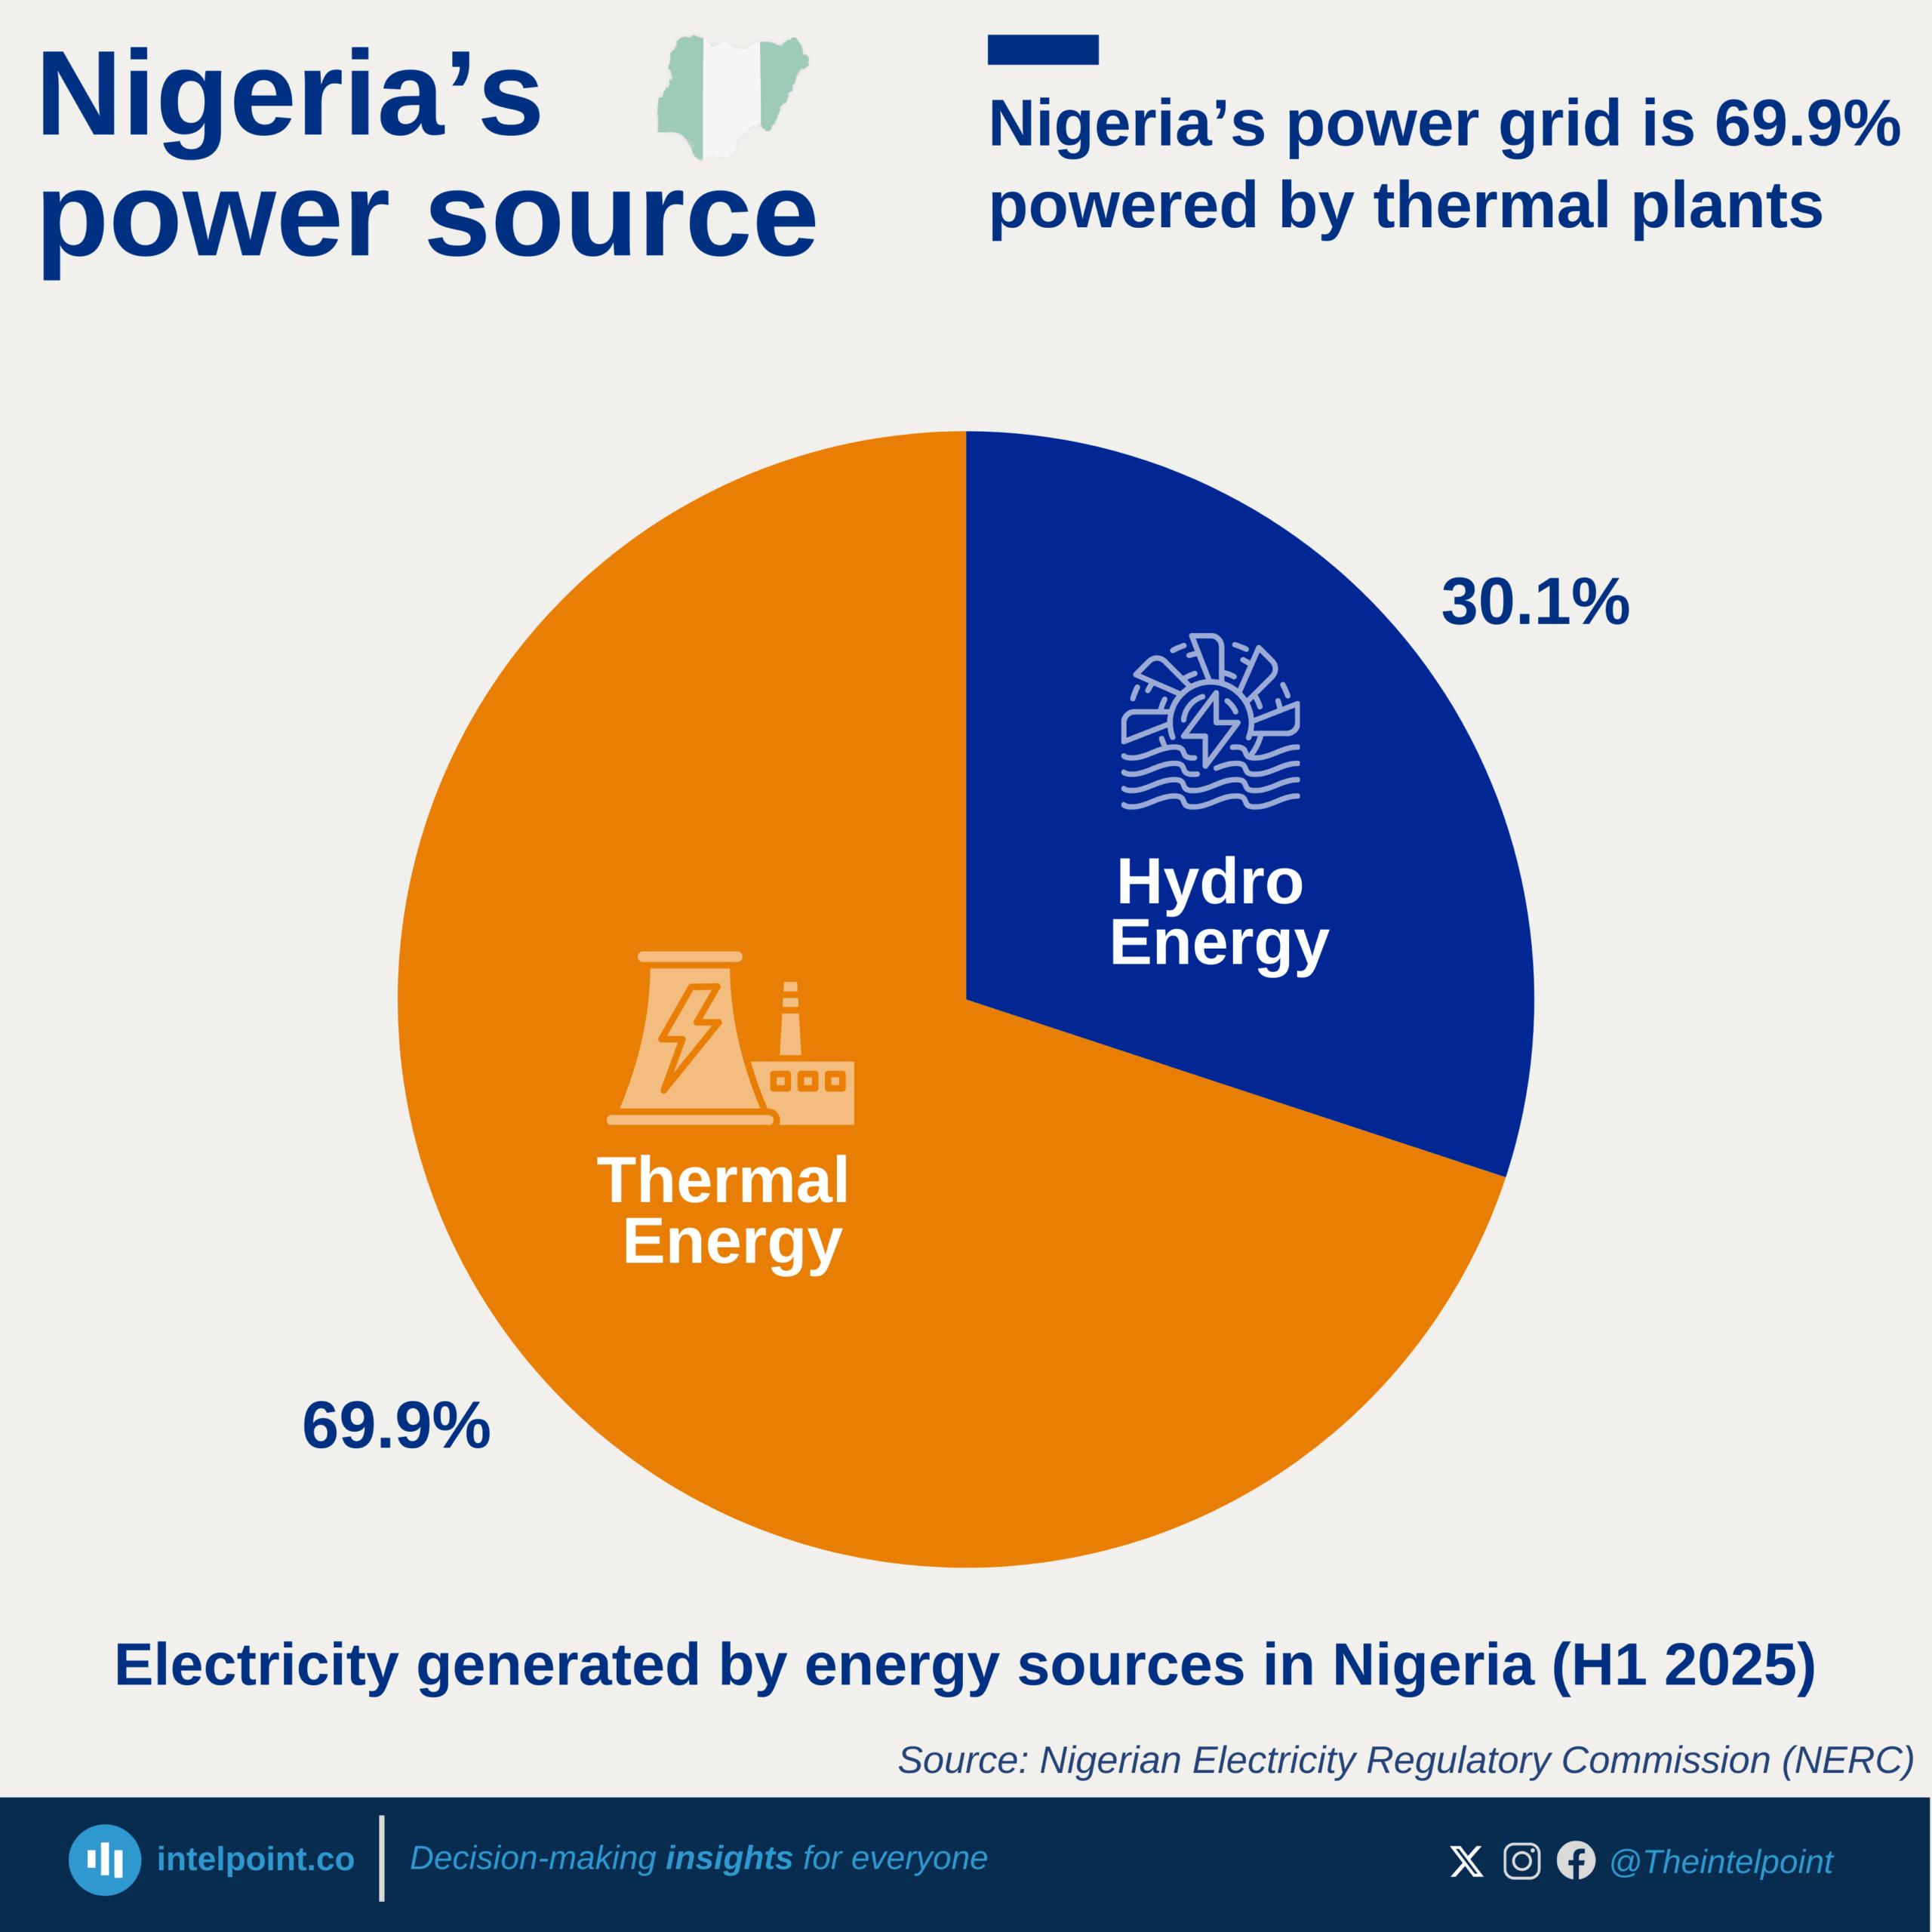
Nigeria’s electricity generation is mainly thermal, accounting for 69.9% of total supply, reflecting the country’s dependence on fossil-fuel-based plants for grid stability. Hydro power contributes 30.1%, providing an important complementary source that supports national generation levels. Together, both sources shape Nigeria’s power mix.

Source:

Nigeria Electricity Regulatory Commission (NERC)

Period:

H1 2025
HTML code to embed chart
Want a bespoke report?
Reach out
Tags
Related Insights

Despite allocating more funds than in 2020, Nigeria's defence budget share falls back to 9% in 2026, matching the 2020 low
  • Nominal spending surged, but inflation and naira depreciation eroded real gains. From ₦921 billion in 2012 to ₦6.57 trillion in 2025, the absolute figure may seem dramatic, but Nigeria's security challenges intensified over the same period.
  • Defence commanded over 21% of the budget in 2013. From 2024 to 2026, that figure has fallen below 14%, with 2026 hitting a historic low of 9.3%.
  • Boko Haram, banditry, and separatist tensions peaked in 2020, resulting in a cut that saw defence's share fall to just 9.2%, the lowest on record at that point.
  • The jump to ₦6.57trn (13.2%) in 2025 marks the sharpest year-on-year absolute increase in the dataset. But 2026 reversed this again, with the rate dropping to 9.3%.

Nigeria recorded a 76% drop in HIV cases over five years
  • The 2019 number revealed the truth — years of underdiagnosis were corrected in a single year when PEPFAR restructured testing entirely.
  • The 76% decline from 2019 to 2024 is one of the most significant HIV reductions in Africa in a single decade.
  • One year of disruption in 2020 erased an entire year of progress, creating a backlog that took until 2022 to clear.
  • With PEPFAR's $1.2 billion pipeline cut, fewer Nigerians are being tested, meaning fewer cases appear on paper while the virus spreads undetected.

Nigeria's insurance sector crossed ₦1.98tn in H1 2025 as every segment grew by at least 25%
  • Life Business was the single largest segment, and its 70.3% jump signals that more Nigerians are thinking seriously about financial protection for their families.
  • Miscellaneous, the smallest segment, posted the biggest growth at 86.7%, suggesting new and unconventional insurance products are gaining serious traction.
  • Aviation & Marine nearly doubled, with 79.9% growth in a sector tied to trade and logistics, reflecting Nigeria's expanding import/export activity and the rising cost of cargo and aircraft risk coverage.
  • Motor (52.5%), Fire (53.3%), and General Accident (49.6%) grew by roughly half, indicating broad-based sector expansion rather than isolated pockets of growth.

Nigeria’s crude oil export value surges over 400% from 2020 to a record ₦55.3tn in 2024
  • Export values have grown over 400%, rising from ₦11.8 trillion in 2013 to a peak of ₦55.3 trillion in 2024, a fivefold increase driven by rising oil prices and a weaker naira.
  • 2015 and 2016 were the hardest years, with export values crashing as low as ₦6.8 trillion in 2015, reflecting the brutal impact of the global oil price collapse on Nigeria's most critical export.
  • The most explosive growth came from 2023 onwards, with values surging past ₦29 trillion in 2023 and peaking at ₦55.3 trillion in 2024, largely driven by the naira depreciation following Nigeria's 2023 foreign exchange reforms.
  • The first nine months of 2025 saw a slower pace than the previous year, with ₦37.7 trillion recorded between Q1 and Q3, lower than the ₦41.5 trillion recorded during the same period in 2024.

The national grid collapses an average of 7 times annually under Tinubu, down from 13 times under Buhari
  • The highest number of grid collapses in the past 16 years occurred in 2010, with 42 incidents recorded.
  • During Goodluck Jonathan’s administration, Nigeria’s grid collapsed an average of 24.4 times a year, the highest among the three administrations.
  • Under Muhammadu Buhari, the annual average dropped to 12.8 collapses per year, indicating improved grid stability compared to earlier years.
  • Under Bola Ahmed Tinubu, the average has fallen further to about 6.7 collapses annually.
  • 2016 recorded the highest number of collapses during the Buhari administration, with 28 incidents.
  • The most stable years in the dataset were 2020 and 2021, with only four collapses each.

Local companies have consistently contributed most of Nigeria’s Company Income Tax payments since 2016
  • Local companies dominated CIT contributions in most years, accounting for over 50% of payments in 9 of 11 periods between 2015 and 2025 (Q1–Q3).
  • Foreign companies briefly closed the gap in 2023, contributing 49%, the closest they have come to matching local firms.p
  • Local companies recorded their strongest share in 2021 at 65%, marking the widest gap between local and foreign contributors.
  • “Other payments” peaked during the pandemic, rising to 17% in 2020 before dropping to 0% from 2022 onward.

POPULAR TOPICS
SIGN UP TO OUR NEWSLETTER
Get periodic updates about the African startup space, access to our reports, among others.
Subscribe Here
Subscription Form

A product of Techpoint Africa. All rights reserved