Nigeria's manufactured goods trade is overwhelmingly import-dependent, with imports consistently exceeding 85% since 2017

  • Imports have consistently exceeded 85% of Nigeria's manufactured goods trade since 2017.
  • In H1 2025, imports accounted for 93.3% of the total ₦16.5 trillion trade.
  • Nigeria’s export share in the manufactured goods trade was only 6.7% in H1 2025.
  • The highest export share in the past eight years was 14.8% in 2019.
  • Total manufactured goods trade grew from ₦4.9 trillion in 2017 to ₦29.1 trillion in 2024.

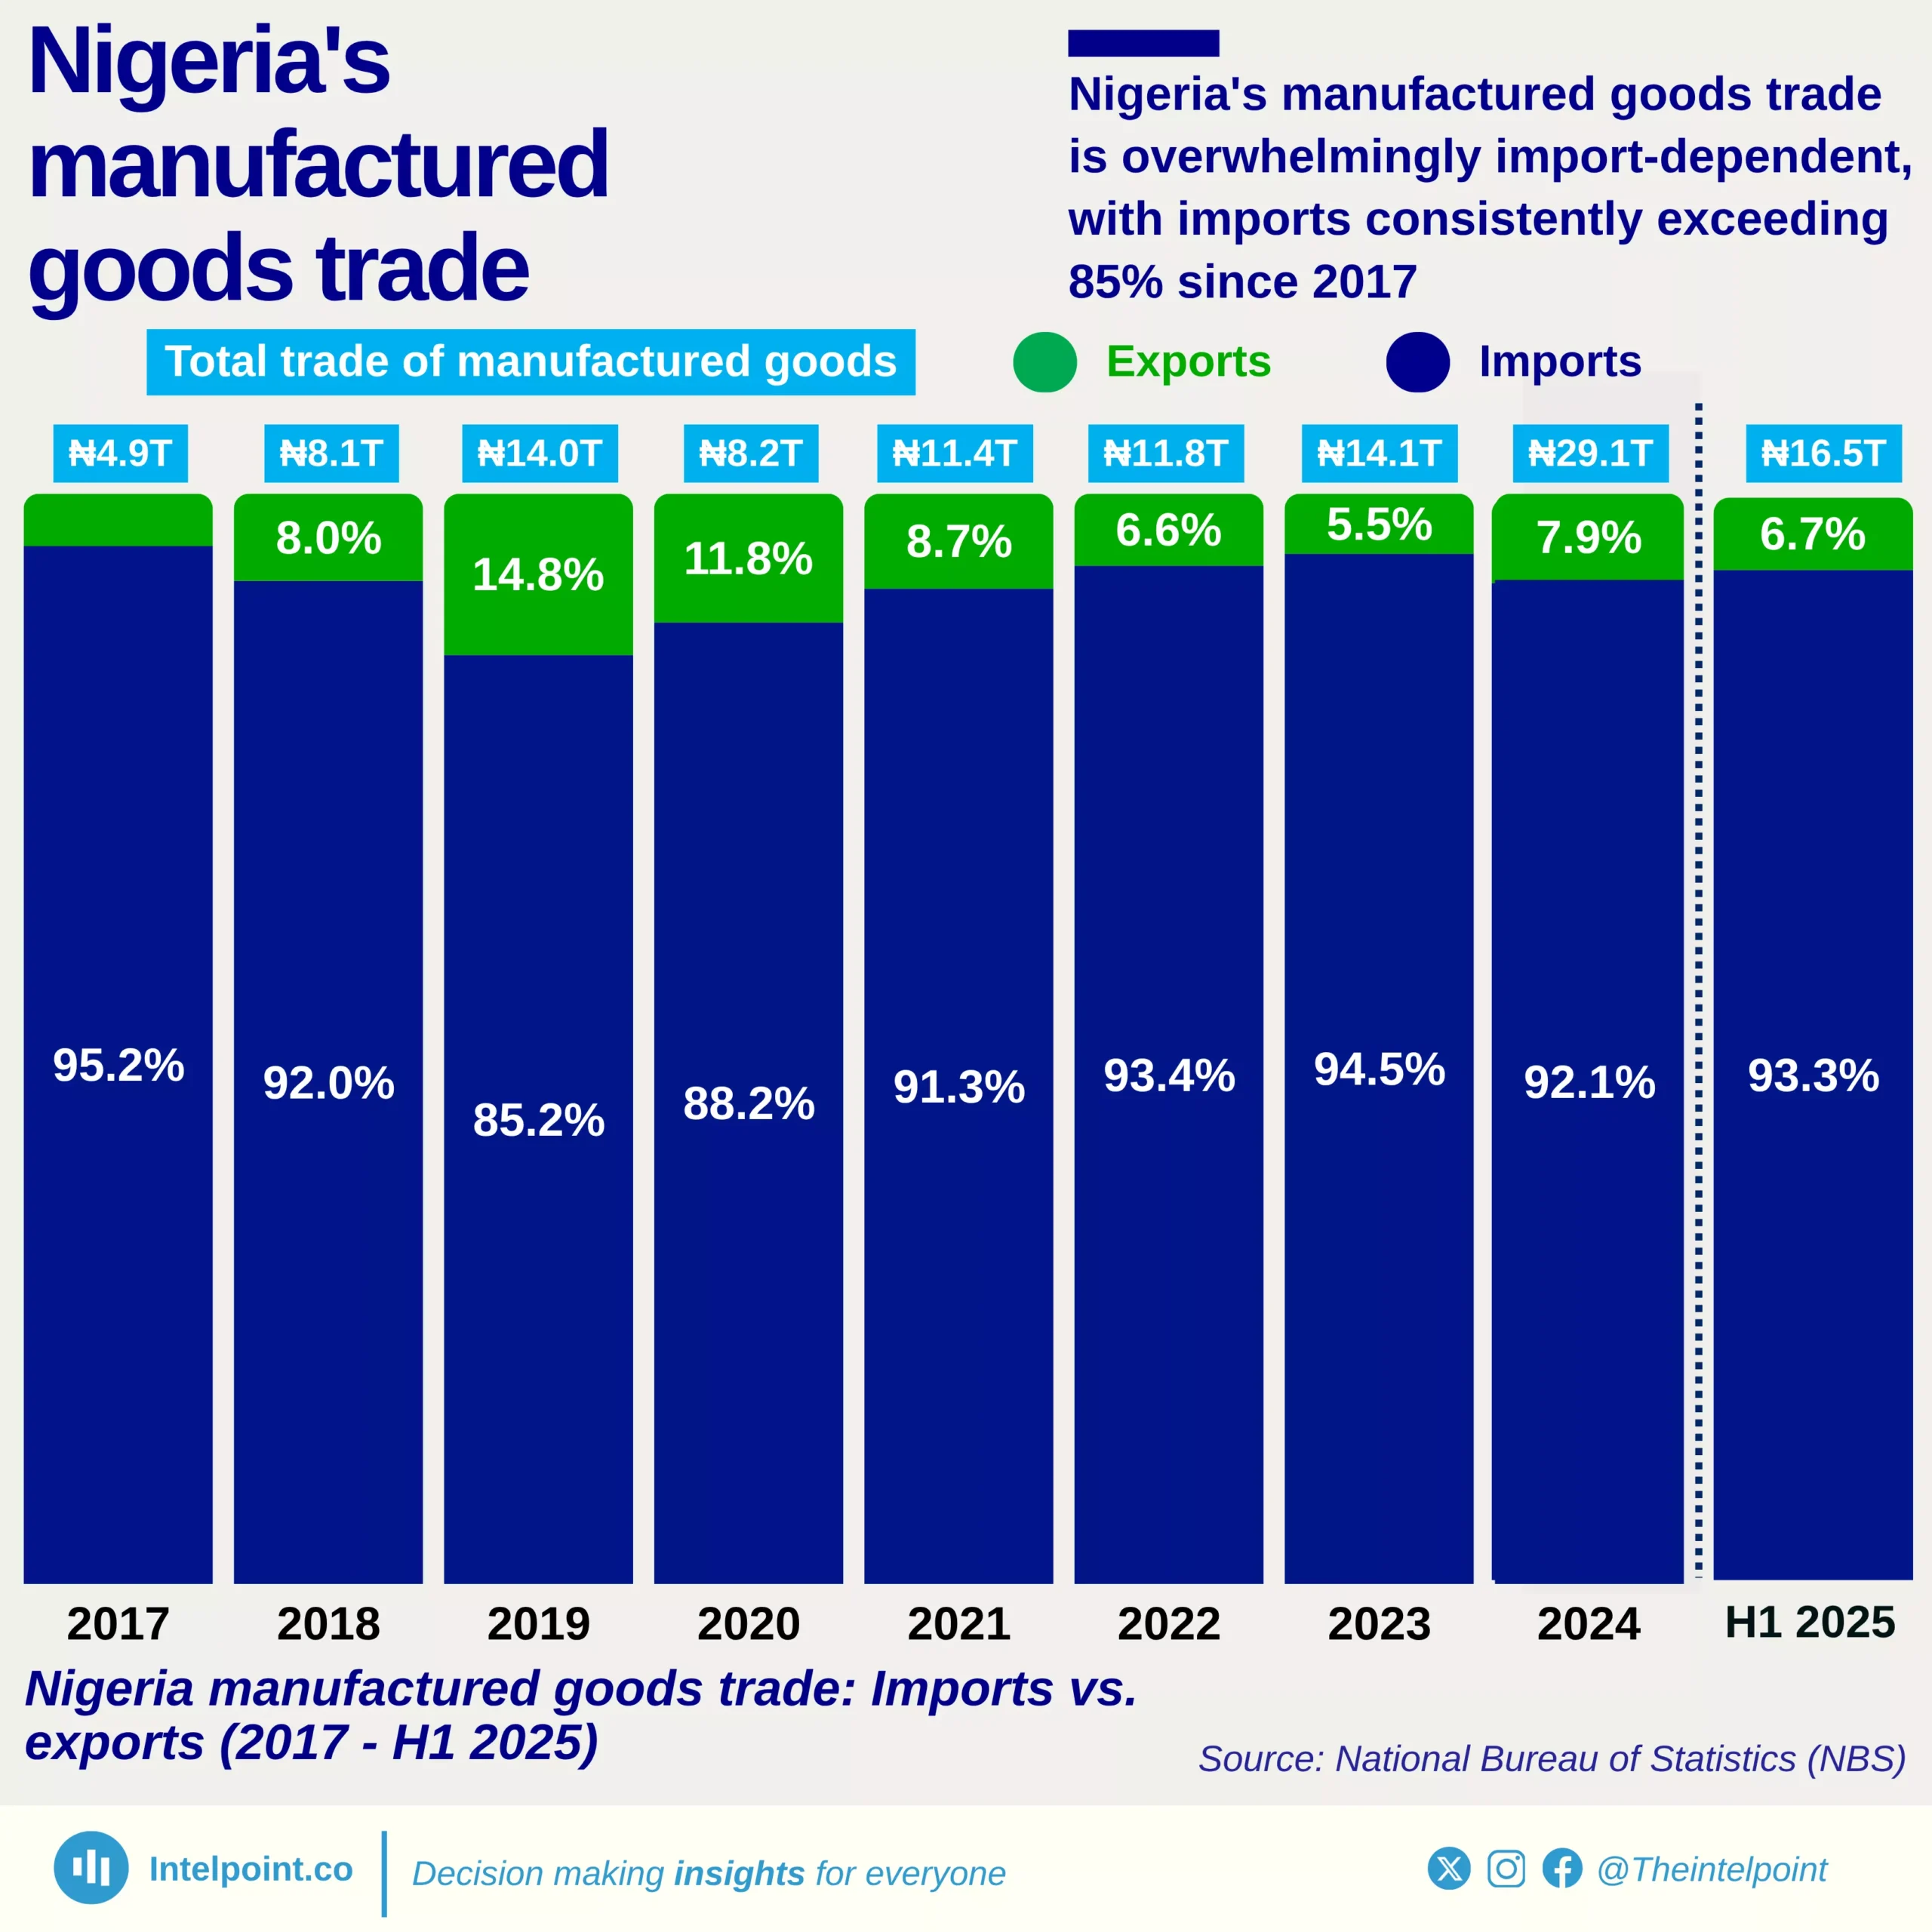
Nigeria’s trade in manufactured goods continues to highlight a profound structural imbalance in its industrial and trade composition.

Since 2017, the country’s manufactured goods trade has been overwhelmingly import-dependent, with imports consistently accounting for over 85% of total trade. In the first half of 2025, imports accounted for 93.3% of the total manufactured goods trade, while exports accounted for just 6.7%.

This persistent dominance of imports reveals Nigeria’s heavy reliance on foreign manufacturing to meet domestic demand, underlining the country’s limited local production and export capacity for finished goods.

Source:

National Bureau of Statistics

Period:

2017 - H1 2025
HTML code to embed chart
Want a bespoke report?
Reach out
Tags
Related Insights

Malacca and Hormuz handle about 24% and 22% of global oil supply, respectively
  • The Strait of Malacca is the world’s most important oil chokepoint, carrying about 24–25% of global oil supply in recent years.
  • The Strait of Hormuz moves around 20–23% of global oil supply, making it the second-largest energy transit chokepoint.
  • The Cape of Good Hope carries about 9–10% of global oil flows, and its share tends to increase when other chokepoints face disruptions.
  • The Bab el-Mandeb saw a sharp drop in oil flow share from about 9% in 2023 to around 4% in 2024, reflecting security concerns affecting shipping in the Red Sea corridor.
  • Oil transported through the Suez Canal and the SUMED pipeline system dropped significantly after 2023, falling from about 8.6% to below 5%, showing how quickly routes shift during geopolitical tensions.
  • The Strait of Malacca’s share has remained consistently high and stable, indicating its structural importance to Asian energy demand.
  • Alternative routes like the Cape of Good Hope in South Africa are longer but strategically crucial, especially when Middle Eastern chokepoints become unstable.

After three years of decline, China-Nigeria export trade hit a new peak of $24.9bn in 2025
  • Export value more than doubled from $9.72 billion in 2016 to $24.91 billion in 2025.
  • Trade rose steadily between 2016 and 2019, then surged sharply in 2021.
  • Exports declined for three consecutive years (2022–2024) after the 2021 peak.
  • 2025 marks the highest export value in the ten-year period.

China's top 10 African export destinations take about 66% of its exports to the continent in 2025
  • Nigeria leads by a clear margin, receiving the highest export value at $24.91bn.
  • Large, diversified economies dominate the top tier, with South Africa and Egypt ranking among the biggest destinations.
  • Resource-linked trade remains significant, with countries like Liberia and Algeria absorbing substantial export value.
  • Trade reach is geographically diverse, spanning West, East, and North Africa, including GhanaTanzaniaKenyaMorocco, and Guinea.

Post-pandemic trade reset lifts China–Africa exports to a record $225bn in 2025
  • Exports more than doubled in a decade, with trade rising from $92.27 billion in 2016 to $225 billion in 2025, a 144% increase.
  • The largest single jump occurred between 2020 and 2021, when exports surged by more than $34 billion.
  • From 2021 to 2024, exports climbed every year, reaching $178.91 billion before the latest surge.
  • The increase from $178.91 billion in 2024 to $225 billion in 2025 signals a new growth surge after several years of gradual increases.

Agricultural products led Kenya’s 2024 export economy, with coffee, tea, and spices generating $1.7 bn
  • Agriculture dominated Kenya’s exports, with coffee, tea, and spices alone contributing $1.7 billion, the largest single export category.
  • Mineral fuels were a surprisingly strong second, delivering $1.1 billion, and showing Kenya’s growing role in regional fuel distribution.
  • Horticultural exports (flowers, live plants, and trees) contributed $790 million, reinforcing Kenya’s global strength in floriculture.
  • All other export categories fall below $300 million individually, reflecting a long list of small but diverse export segments such as textiles, vegetables, and pharmaceuticals.

Mining led South Africa’s 2024 exports with 18.7%, as gems and precious metals generated over $20 bn
  • Gems and precious metals were the largest single export category, contributing $20.6 billion.
  • Ores and industrial minerals followed closely with $17.2 billion, showing the country’s reliance on mining.
  • Vehicles and machinery were significant non-mineral exports, with a combined $18.3 billion.
  • Agricultural and light industry products like fruits, nuts, and beverages contributed modestly, strengthening mining and manufacturing’s position as the core export drivers.

POPULAR TOPICS
SIGN UP TO OUR NEWSLETTER
Get periodic updates about the African startup space, access to our reports, among others.
Subscribe Here
Subscription Form

A product of Techpoint Africa. All rights reserved