Nigeria's imports of food and beverage have grown in value by 265% since 2020, reaching ₦6.6T in 2024

  • Nigeria’s food and beverage imports increased almost ninefold, from ₦0.7 trillion in 2013 to ₦6.6 trillion in 2024.
  • Imports remained relatively stable between 2015 and 2019, averaging around ₦1.1–₦1.6 trillion.
  • A major spike occurred in 2021, when imports surged by 62%, reaching ₦2.9 trillion.
  • Overall, the trend underscores Nigeria’s ongoing challenge of reducing dependency on imported food and beverages despite policies aimed at self-sufficiency.

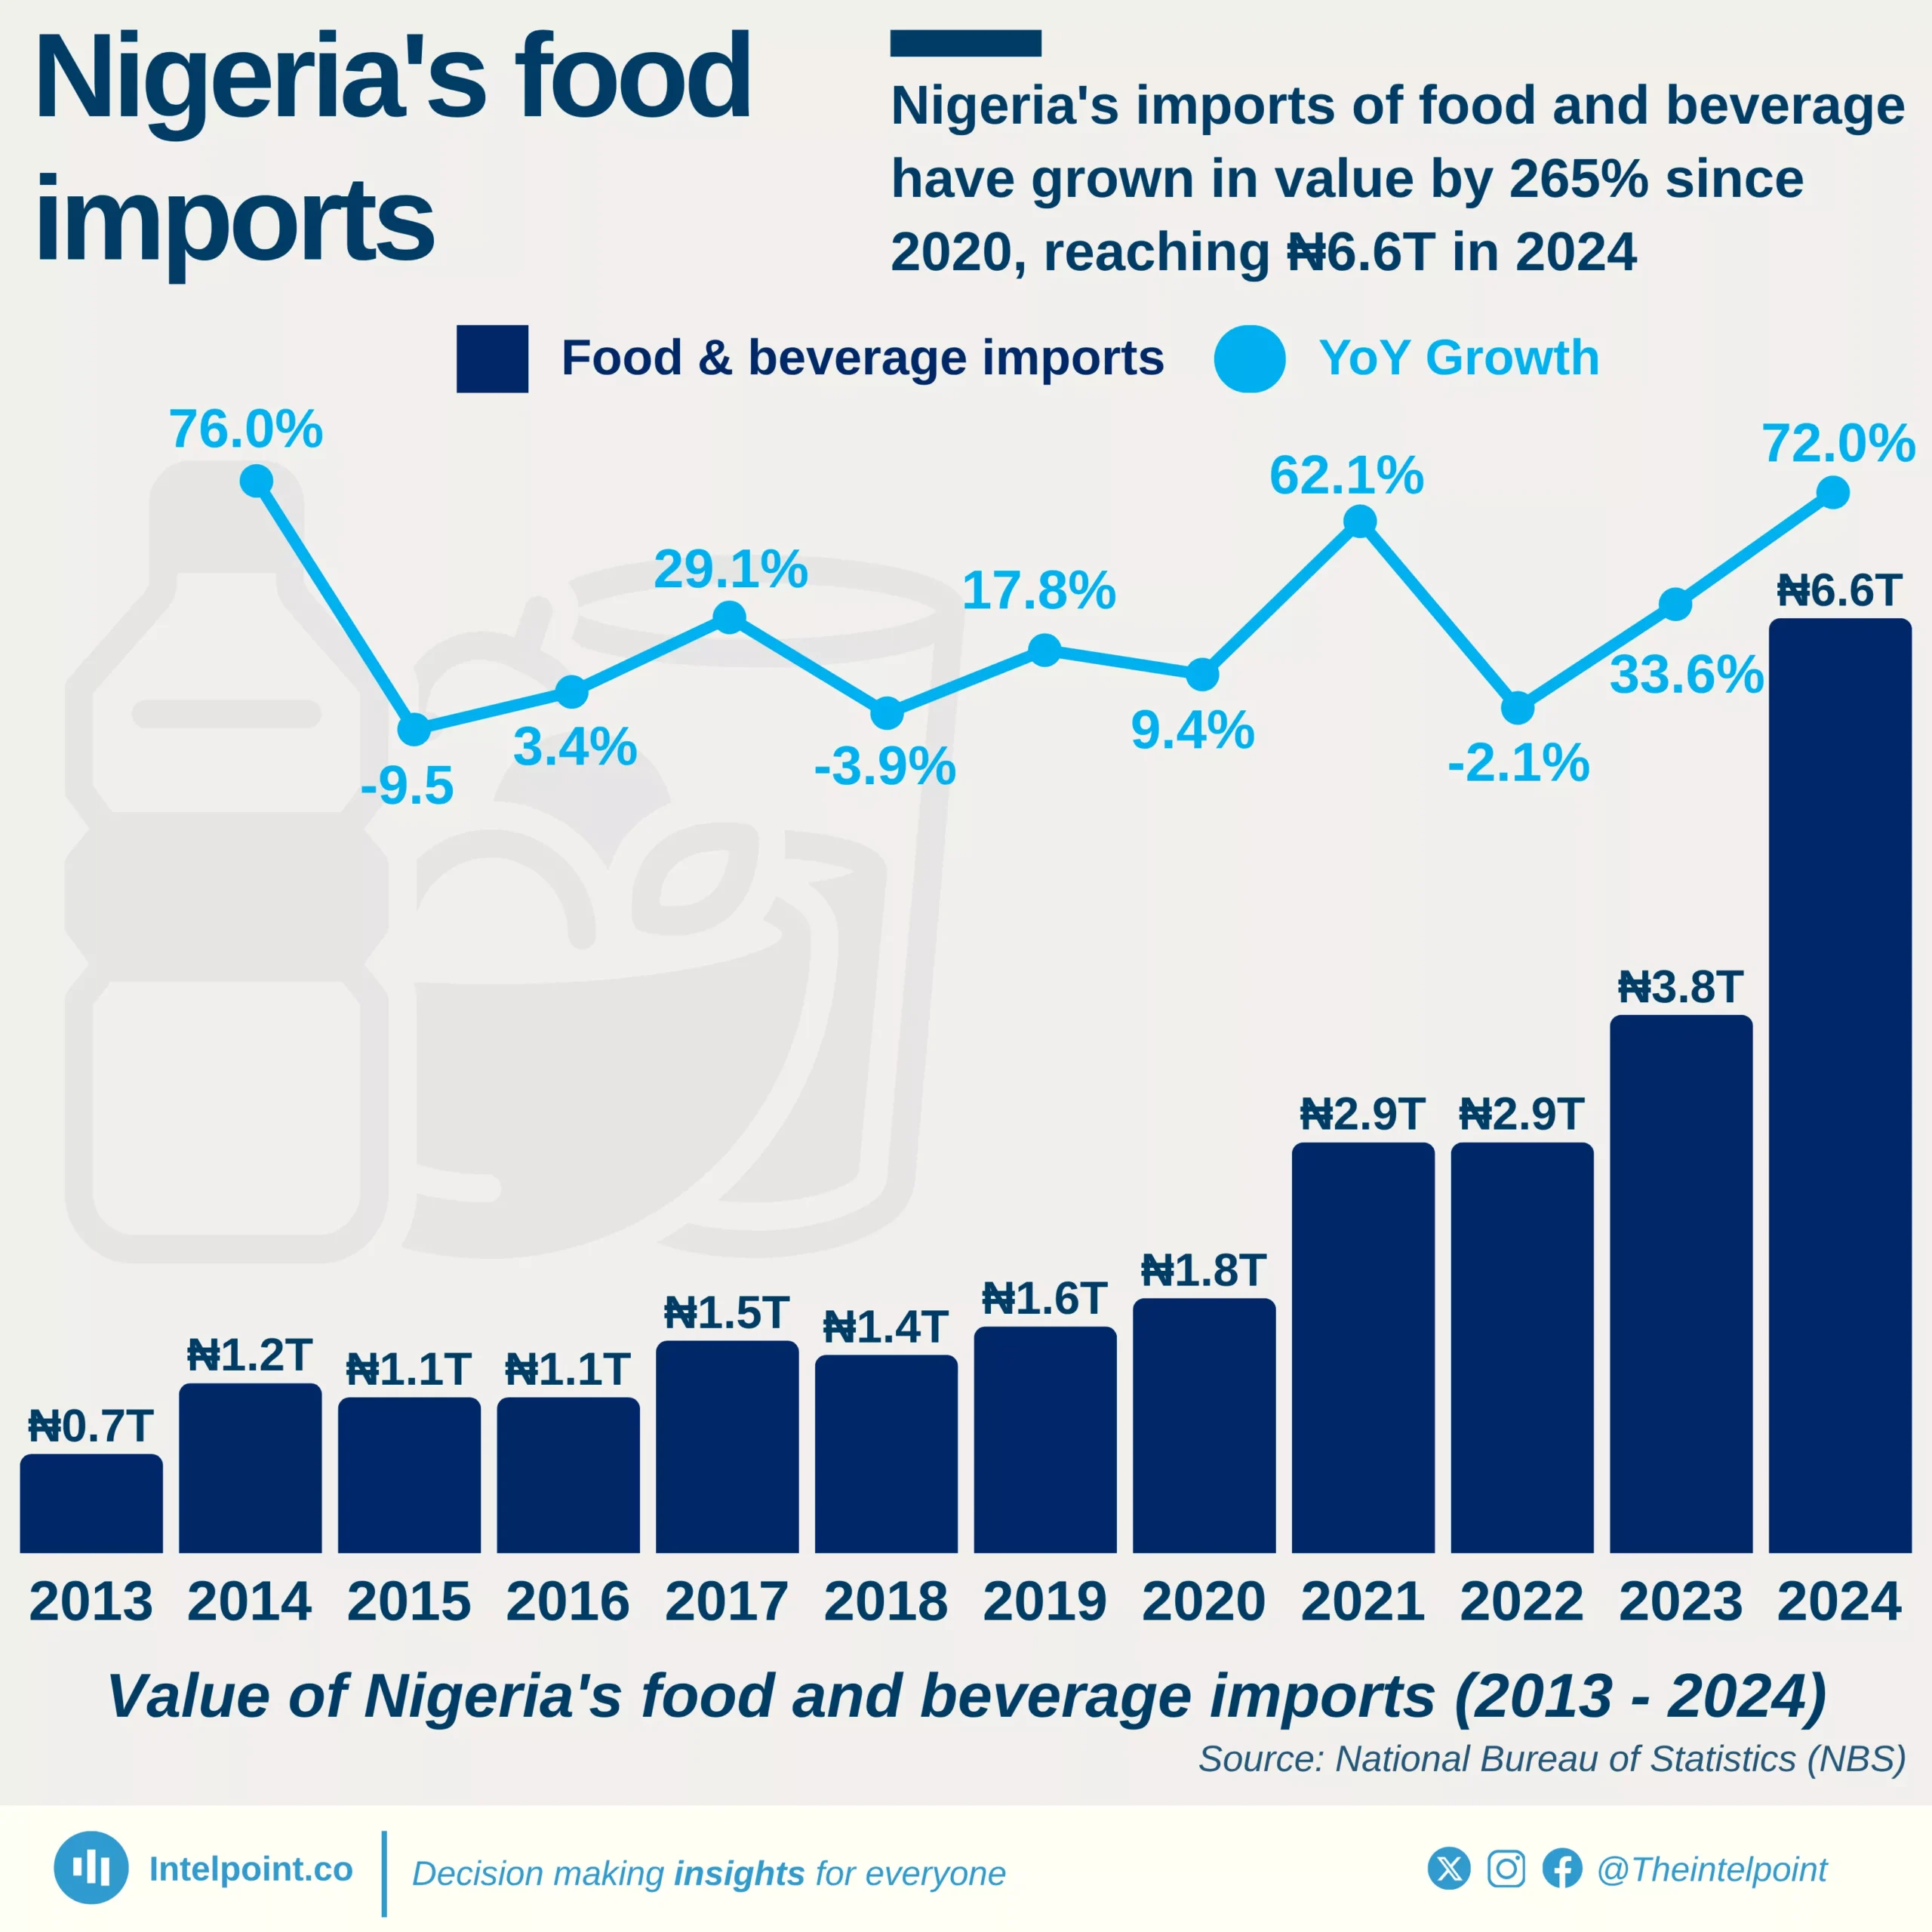
Nigeria’s food and beverage imports have witnessed a significant rise over the past decade, growing from ₦0.7 trillion in 2013 to ₦6.6 trillion in 2024—an increase of nearly ₦6 trillion. This sharp growth highlights the country’s deepening reliance on imported consumables despite efforts to boost local production. The import value has surged in recent years, particularly between 2023 and 2024, when it jumped by an astounding 72% year-on-year, indicating intensifying demand pressures and possibly weaker domestic supply capacity.

Source:

National Bureau of Statistics

Period:

2013 - 2024
HTML code to embed chart
Want a bespoke report?
Reach out
Tags
Related Insights

Fuels and lubricants dominated 2024 imports, accounting for 37.4% (₦22.7T) of the total ₦60.6T
  • Nigeria imported a total of ₦60.6 trillion worth of goods in 2024.
  • Fuels and lubricants dominated imports with ₦22.7 trillion (37.4%).
  • Industrial supplies accounted for ₦13.4 trillion (22.1%), showing strong demand for production inputs.
  • Capital goods and parts represented ₦9.1 trillion (15%).
  • Food and beverage imports reached ₦6.6 trillion (10.9%), signalling a high reliance on external food sources.

Nigeria is buying more from ECOWAS, with their share of African imports up to 32.4% in H1 2025
  • ECOWAS’s share of Nigeria’s African imports grew to 32.4% in H1 2025, up from 15.0% in 2021.
  • The lowest ECOWAS import share was recorded in 2014 (8.8%), showing significant progress since then.
  • The share of ECOWAS imports has more than doubled since 2021, signalling stronger regional trade ties.
  • Nigeria’s total imports from Africa rose to ₦1.8 trillion in 2025 (H1), indicating expanding trade activity.

For every $1 Ghana earns from exporting pharmaceutical products, it spends about $22 on imports
  • For every $1 Ghana earns from pharmaceutical exports, it spends about $22 on imports, underscoring the country’s overwhelming dependence on foreign pharmaceutical products.
  • Ghana is a net importer of medicine and has been for nearly two decades.
  • By 2015, Ghana’s pharmaceutical imports reached its peak with $348.12m while exports were $3.10m, meaning imports were nearly 100 times larger.
  • In 2016, Ghana recorded its highest-ever export performance at $78.33 million, but even then, imports stood at $154.96m, almost two times higher.

For the first time in 17 years, Ghana’s ceramic exports recorded a $19.9m surplus in 2023
  • In 2023, Ghana recorded $91.9m in ceramic exports, amassing $19.9m profit, after 17 years of consistent trade losses and heavy dependence on imported ceramic products.
  • For 17 years, Ghana’s ceramic market was largely import-driven, with local industries struggling to compete against foreign products.
  • Ghana's ceramic products trade recorded $1.397 billion in trade deficit in almost two decades.
  • Ghana's ceramic industry has finally moved from dependency to a driver of profit and progress.

Over the past two decades, Egypt exported roughly twice as much ceramic products as it imported
  • Over the past two decades, Egypt exported roughly twice as much ceramic products as it imported, positioning itself as a key player in regional and global ceramic products trade.
  • In 2012, exports peaked at $488.51 million, more than double imports at $178.23 million, setting a clear demonstration of strong industrial and commodity output.
  • In 2008, exports soared to $325.86 million, more than doubling imports at $126.21 million.
  • Between 2017 and 2021, the export sector showed stable performance, averaging $327 million annually.
  • The year 2021 was a standout, with exports reaching $401.12 million, reflecting a strong rebound that reaffirmed Egypt’s export capacity post-pandemic.

The U.S. consistently leads Nigeria’s imports from the Americas, accounting for 57–73% in 13 years
  • The U.S. consistently leads Nigeria’s imports from the Americas, accounting for 57–73% between 2013 and 2025.
  • Brazil ranks second, with shares ranging between 11% and 24%, highlighting its steady trade ties with Nigeria.
  • During the period, the combined share of the U.S. and Brazil never fell below 76%, even at its lowest point in 2022.
  • Total imports from the Americas surged from ₦0.9 trillion in 2013 to a peak of ₦6.3 trillion in 2024.
  • Canada’s import share peaked at 16.4% in 2022, showing a rare moment of diversification.

POPULAR TOPICS
SIGN UP TO OUR NEWSLETTER
Get periodic updates about the African startup space, access to our reports, among others.
Subscribe Here
Subscription Form

A product of Techpoint Africa. All rights reserved