Nigeria, the fourth-largest economy in Africa, experienced a constant annual growth rate (CAGR) of -16.02% in its GDP per capita over the past five years

Key takeaways:

  • At -16.02% CAGR, Nigeria's GDP per capita is shrinking fast, signalling deep economic strain on its population despite being a top 4 African economy.
  • Angola recorded 8.28% CAGR, showing that smaller economies can drive significant per capita progress when policies and investments align with citizen welfare.
  • With 8.23% CAGR, Algeria continues to transform national wealth into measurable benefits for its people.
  • Ethiopia’s 6.86% annual growth in GDP per capita highlights how consistent development efforts can raise living standards even in densely populated, developing nations.
  • A modest 2.52% CAGR for South Africa might not sound like much, but in a mature economy, this reflects resilience and relative stability in per capita income.
  • Egypt has a -1.41% CAGR, showing mild contraction, but far less severe than Nigeria’s economic shrinkage.

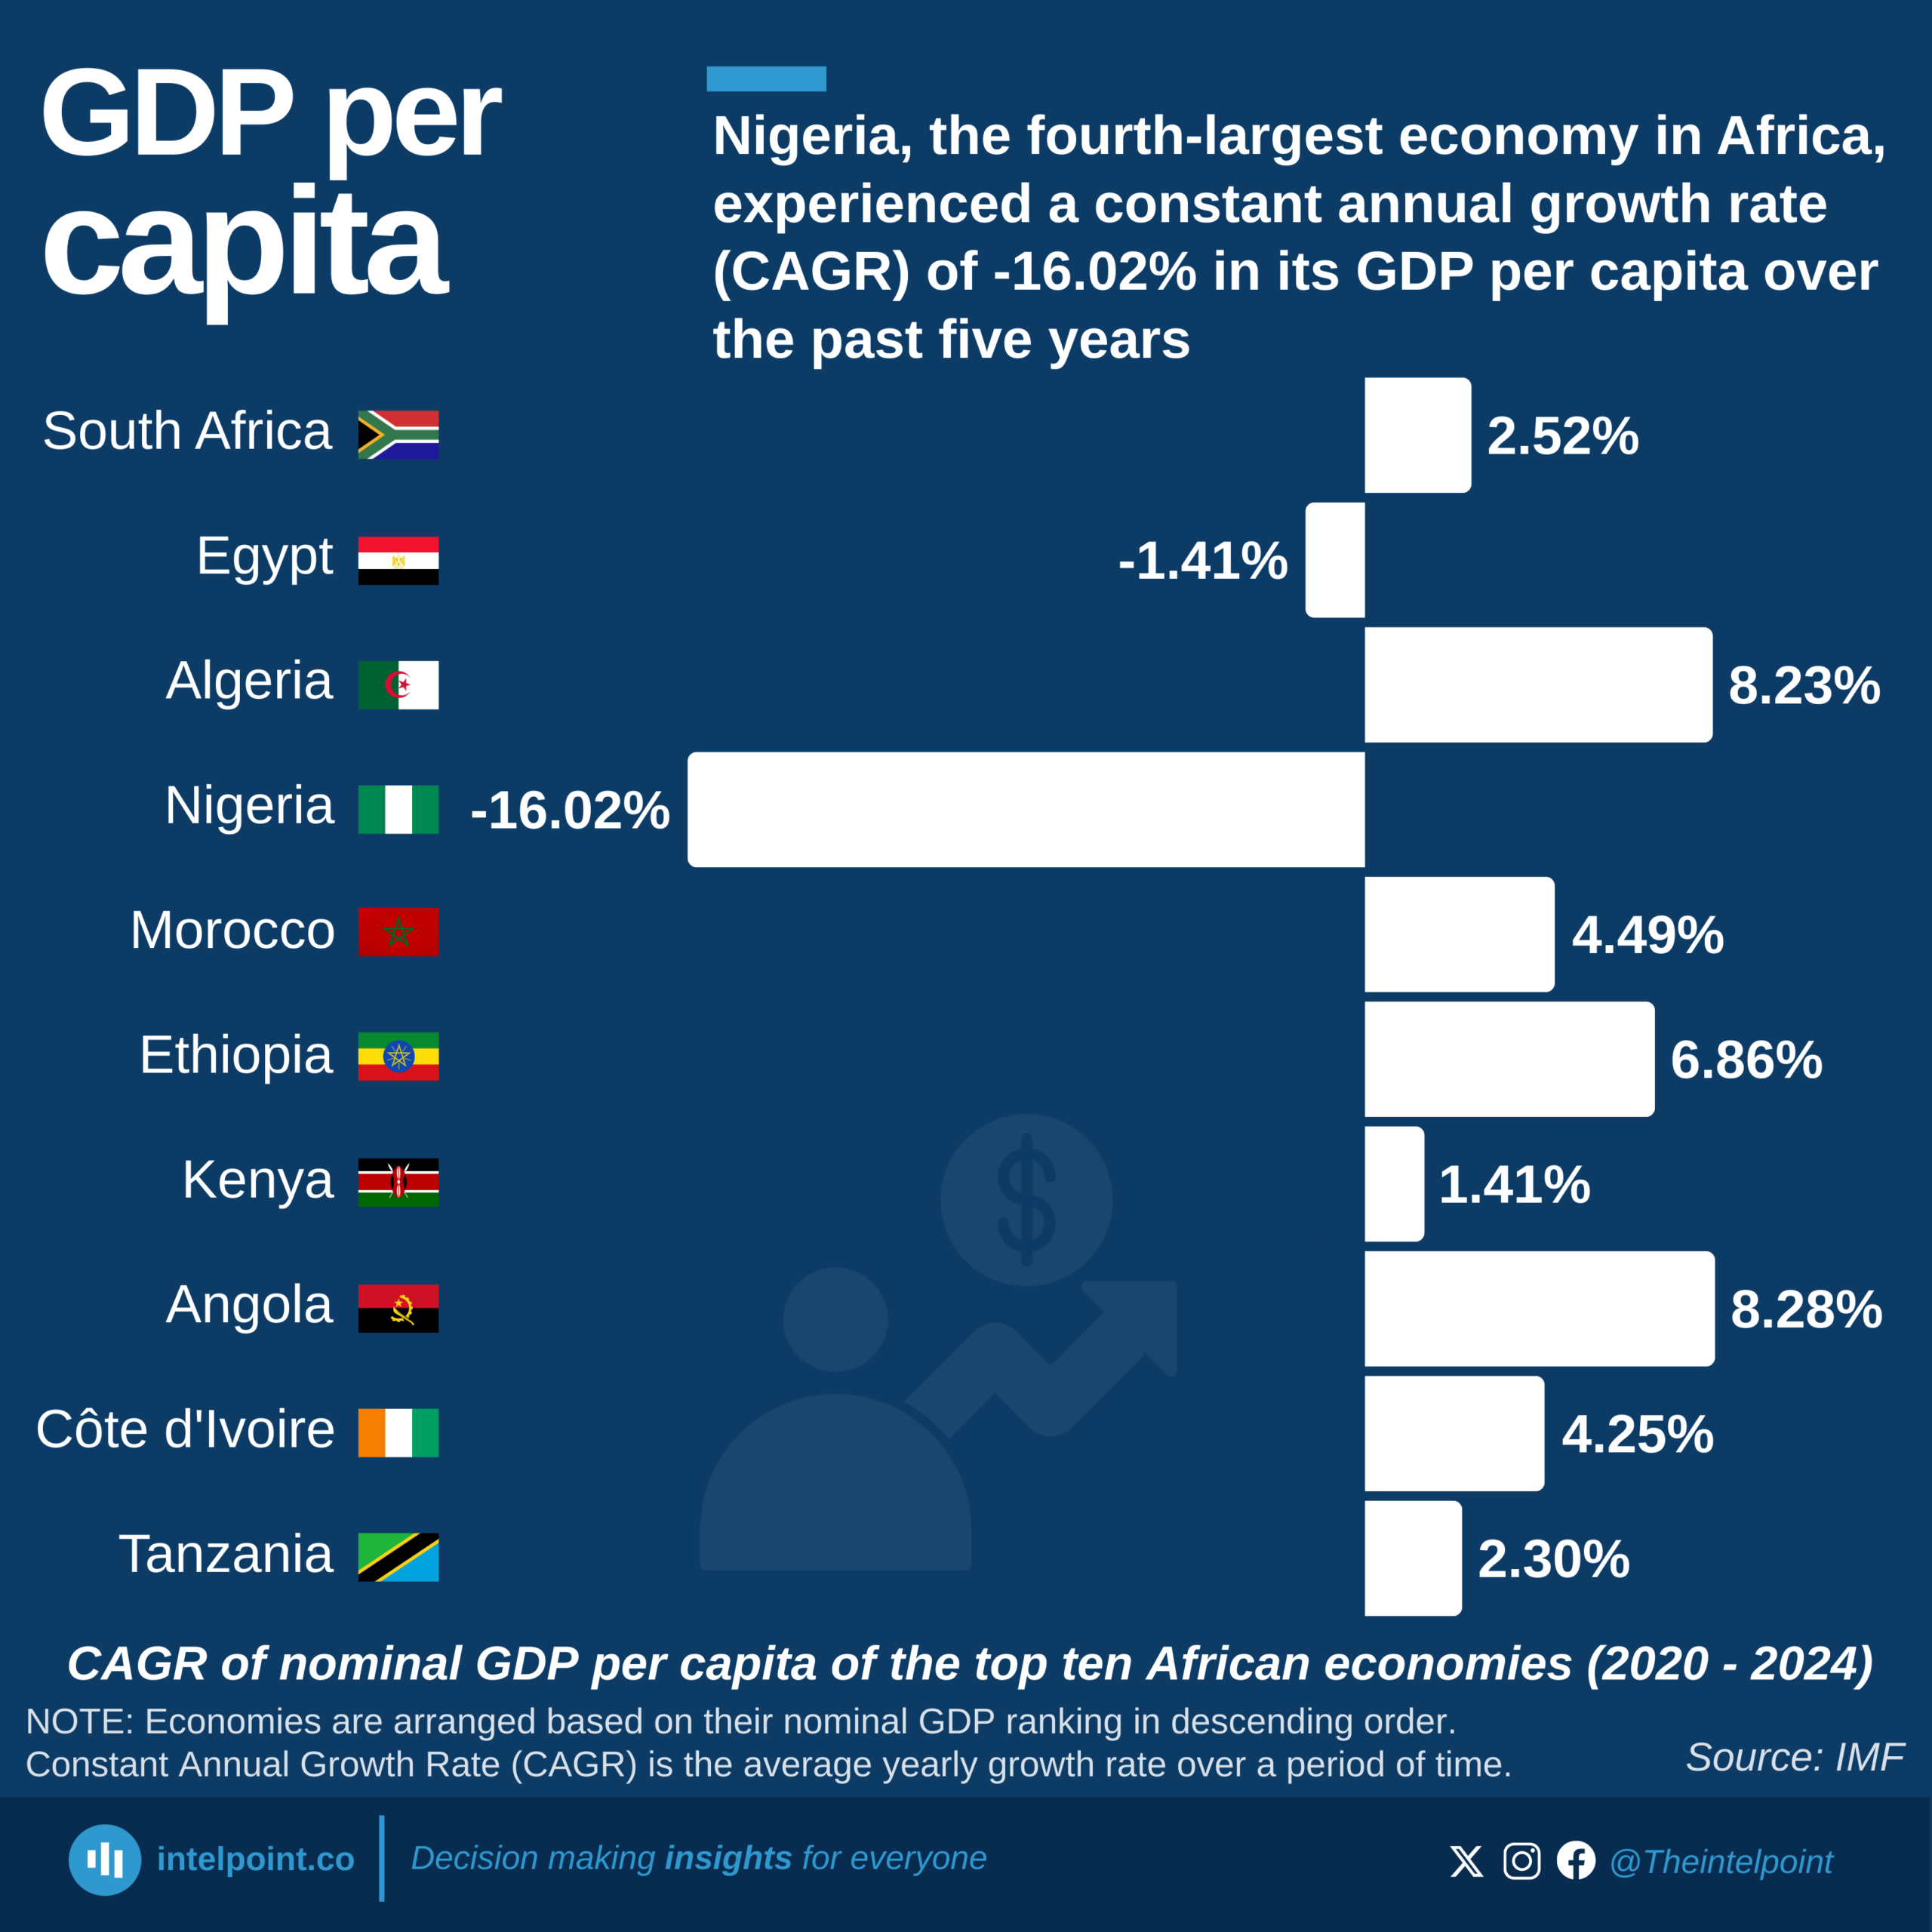
Between 2020 and 2024, Nigeria recorded the sharpest decline in nominal GDP per capita among Africa’s top 10 economies, with a -16.02% annual contraction. While most of the other African top economies managed moderate to strong gains in their citizens’ average economic wellbeing, Nigeria moved in reverse.
Similarly, on average, Egypt experienced a decline in its GDP per capita during the period. Meanwhile, countries like Angola and Algeria saw constant annual growth rates of over 8%, significantly improving the average economic situation of their people. This shows that GDP growth alone isn’t enough — how that growth is distributed and sustained over time also matters.

Source:

IMF

Period:

2020-2024
HTML code to embed chart
Want a bespoke report?
Reach out
Tags
Related Insights

Nigeria’s 2024 GDP just got a $65 billion boost after the 2025 rebasing
  • The IMF’s new 2019 GDP base year added between $20 billion and $235 billion annually to Nigeria’s GDP from 1990–2025.
  • 2014 saw the biggest jump — an upward revision of $235.1 billion, raising GDP to $811.1 billion from $576.0 billion under the old base.
  • The rebased data consistently show 40–45% higher GDP values through the 2000s and 2010s, revealing a larger economy than earlier estimates.
  • The impact was strongest during Nigeria’s oil boom years (2007–2014), when rebasing captured fast-growing sectors like digital services, informal trade, and modular refining.

With new 2019 base year, Nigeria ranked among the world’s 20 largest economies in 1998, 2013, 2014, and 2015 — peaking at $811 billion
  • Nigeria’s GDP has been rebased to a 2019 base year, raising its nominal value by about 40.8%, according to the IMF’s October 2025 update.
  • The revision includes new data on digital, informal, and service sectors, giving a fuller picture of the economy.
  • Nigeria ranked among the world’s top 20 economies in 1998, 2013, 2014, and 2015, peaking in 2014 at $811 billion.
  • Despite later declines from currency depreciation and slower growth, the revision reaffirms Nigeria’s position as Africa’s largest economy.

Nigeria’s GDP growth peaked at 14.6% in 2002 after years of expansion, now averaging around 3.3% annually
  • From recession to recovery, Nigeria’s GDP growth journey reveals three decades of economic volatility and slow transformation.
  • Nigeria's economy grew by 14.6% in 2002, which is still the highest in the country's history.
  • The country entered a recession in 2016, with the economy shrinking by -1.6%.
  • Nigeria enjoyed a long period of strong growth between 2003 and 2010: The economy grew between 7% and 11%, powered by high oil prices and booming sectors like telecoms and banking.

South Africa’s share of Africa’s GDP has averaged 20% since 1960, peaking in early 1990s
  • South Africa’s share of Africa’s GDP has averaged around 20% since 1960.
  • The country’s relative dominance peaked in the early 1990s at nearly 28% of continental GDP.
  • Nominal GDP grew steadily from $8.7 billion in 1960 to over $400 billion in 2024.
  • South Africa’s share of Africa’s GDP has generally declined in recent decades as other African economies expanded faster.
  • Despite the relative decline, South Africa remains one of Africa’s largest and most influential economies.

Nigeria’s slice of Africa’s economy since independence: From a peak of 31% to 7% in 2024
  • At independence in 1960, Nigeria contributed about 10% of Africa’s GDP, establishing itself early as one of the continent’s largest economies.
  • Nigeria’s share peaked at 31% in 1981 during the oil boom, highlighting the dramatic impact of natural resources on the economy.
  • Between the mid-1980s and 2000s, Nigeria’s share fluctuated significantly, dropping to 9.2% in 1999 due to political instability, economic mismanagement, and external shocks.
  • By 2024, Nigeria’s share fell to 7.1%, despite a GDP of $187.8 billion, showing slower relative growth compared to other African economies and the ongoing need for economic diversification.
  • This share reflects Nigeria’s relative position in Africa’s economy over time, showing how it moved in relation to the growth of the rest of the continent.

From 2013 to 2024, the Services sector has consistently dominated Ghana’s GDP, while Agriculture has remained the smallest sector
  • From 2013 to 2024, the services sector has consistently dominated Ghana’s GDP, while agriculture has remained the smallest sector.
  • A weak agriculture sector can make Ghana more dependent on food imports.
  • Agriculture’s stagnation reduces its role as a labour buffer.

POPULAR TOPICS
SIGN UP TO OUR NEWSLETTER
Get periodic updates about the African startup space, access to our reports, among others.
Subscribe Here
Subscription Form

A product of Techpoint Africa. All rights reserved