Morocco leads Africa in digital trade surpluses, with $26 billion 20-year cumulative gain

  • Morocco achieved the highest cumulative surplus in Africa’s digital trade at $26.4 billion between 2005 and 2024.
  • Mauritius and Tunisia followed distantly with surpluses of $8.7 billion and $4.4 billion, respectively.
  • Nigeria and Angola recorded the deepest deficits, each exceeding $90 billion cumulatively.
  • Africa’s overall digital trade balance remained negative, averaging a -$618 million deficit in 2024.
  • Smaller economies like Kenya and Togo managed modest but consistent surpluses over the years.

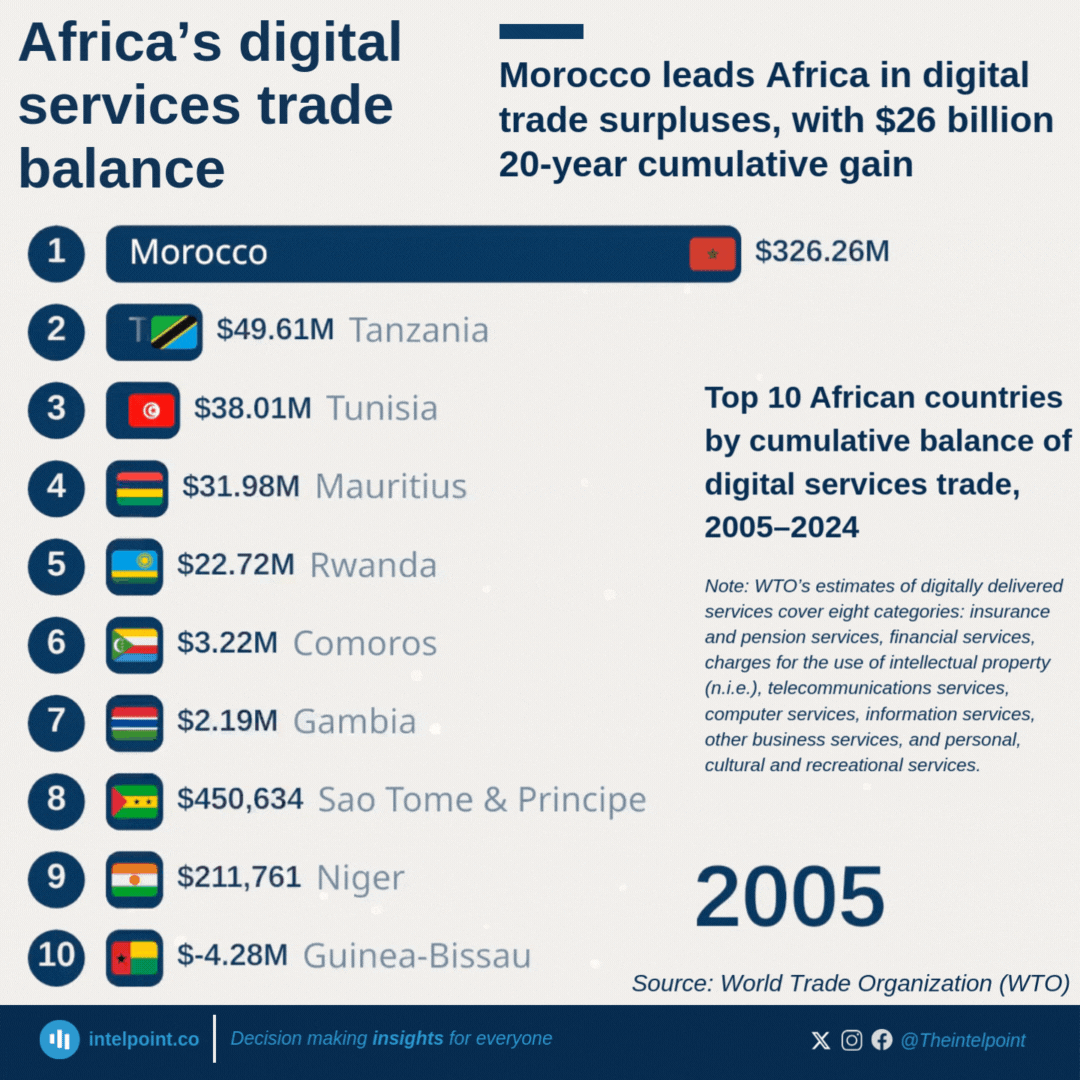
Morocco has built a commanding lead in Africa’s digital services trade, recording a cumulative surplus of $26.4 billion between 2005 and 2024. This places it far ahead of Mauritius ($8.7 billion) and Tunisia ($4.4 billion), cementing its role as the continent’s most competitive digital exporter.

In 2024 alone, Morocco posted a surplus of $3.56 billion, the highest in Africa, ahead of Mauritius ($2.65 billion) and Tunisia ($621 million). Other countries like Kenya ($1.9 billion) and Togo ($1.1 billion) also managed to sustain long-term surpluses, but at much smaller scales.

On the flip side, Africa’s largest economies carry the deepest deficits. Nigeria (-$94.5 billion), Angola (-$97.8 billion), and Egypt (-$55.9 billion) have seen decades of heavy outflows on digital services, while South Africa (-$37.2 billion) and Algeria (-$28.4 billion) also rank among the biggest laggards.

Morocco’s cumulative strength shows that consistent investment in digital exports—particularly IT-enabled services and outsourcing—can turn the tide, even in a region where the overall trend remains negative.

Source:

World Trade Organization (WTO)

Period:

2005-2024
HTML code to embed chart
Want a bespoke report?
Reach out
Tags
Related Insights

Nigeria's energy goods imports have stayed low and stable for 7 years, while exports increased from ₦37B to ₦263B
  • Nigeria’s energy goods exports rose from ₦37.3B in 2017 to ₦262.9B in 2024, before falling to ₦154.2B in H1 2025.
  • Imports remained consistently low, ranging from ₦24.2M to ₦353.1M throughout the period.
  • Export growth outpaced imports, showing a widening trade surplus in energy goods.
  • The 2024 spike in exports represents the highest export value within the nine-year window.
  • Energy imports stayed below ₦400M yearly, indicating low dependency on foreign energy goods.

For most of the period (2013-H1 2025), China's share of Nigeria's imports from Asia hovers around 50%-55%, showing dominance
  • China has dominated Nigeria’s imports from Asia, maintaining a 50–55% share for most of the period.
  • China’s share reached its highest level at 58.6% in H1 2025.
  • India's import share remained volatile, ranging between 11% and 25%.
  • Total imports from Asia surged from ₦2.6 trillion in 2013 to ₦16.4 trillion in H1 2025.

Nigeria's agricultural imports' share has been dropping, from 83.9% (2017) to a low of 42.9% (H1 2025)
  • Agricultural imports fell from 83.9% in 2017 to 42.9% in H1 2025, indicating a significant decline in import dependency.
  • Agricultural exports grew from 16.1% in 2017 to 54.0% in 2024, surpassing imports for the first time since 2017.
  • Total agricultural trade increased from ₦1.1 trillion in 2017 to ₦8.2 trillion in 2024.
  • Between 2022 and 2024, the import share dropped significantly from 75.7% to 46.0%.

Crude oil imports in Nigeria emerged in H1 2025 (the first since 2017), capturing a 10.2% share of the total crude oil trade
  • Crude oil imports into Nigeria in H1 2025 marked the first occurrence since 2017.
  • Crude oil imports accounted for 10.2% of total crude oil trade.
  • From 2017 to 2024, exports made up 100% of crude oil trade annually.
  • Total crude oil trade peaked at ₦55.3 trillion in 2024.
  • The emergence of crude oil imports can be linked to domestic refinery operations, especially the Dangote Refinery.

Asia and Europe (combined) have consistently represented over 70% of Nigeria's total imports since 2013
  • Asia and Europe have consistently represented over 70% of Nigeria’s imports since 2013.
  • Asia’s share of imports reached a record 53.5% in H1 2025.
  • Europe contributed 23.1% of total imports in H1 2025.
  • Imports from the American region averaged between 10%–14% over the period.
  • Africa’s import share remained below 10%, showing limited regional trade.

The Netherlands held the largest share of Nigeria's imports from Europe for most of the period, averaging 20% of annual imports
  • The Netherlands has mostly been the top European import source, with Nigeria averaging 20% of annual imports from the region.
  • Netherlands' highest share of Nigeria's imports was 27.9% in 2018.
  • The United Kingdom consistently contributed around 5–15% of Nigeria’s European imports.
  • Germany’s share remained relatively stable at 5–10% over the years.
  • France, Italy, and Spain maintained smaller shares, mostly under 7%.

POPULAR TOPICS
SIGN UP TO OUR NEWSLETTER
Get periodic updates about the African startup space, access to our reports, among others.
Subscribe Here
Subscription Form

A product of Techpoint Africa. All rights reserved