Kenya’s GDP per capita has risen in 20 of the past 25 years, growing from ~$415 in 2000 to $2,206 in 2024

key takeaways:

  • Kenya's GDP per capita soared from $414.6 in 2000 to a significant $2206.1 in 2024, marking a 532% increase.
  • The country saw its largest single-year jump between 2006 and 2007, rising by 33.7% from $523.5 to $699.8.
  • Economic downturns were visible in 2020 (-1.7%) and 2023 (-7.5%), showing vulnerability to shocks.
  • Since 2020, GDP per capita has grown by 14.5%, with 2024 recording the highest value.
  • Kenya’s GDP per capita rose in 20 of the past 24 years, and declines occurred in only 4 years (2001, 2002, 2020, and 2023).

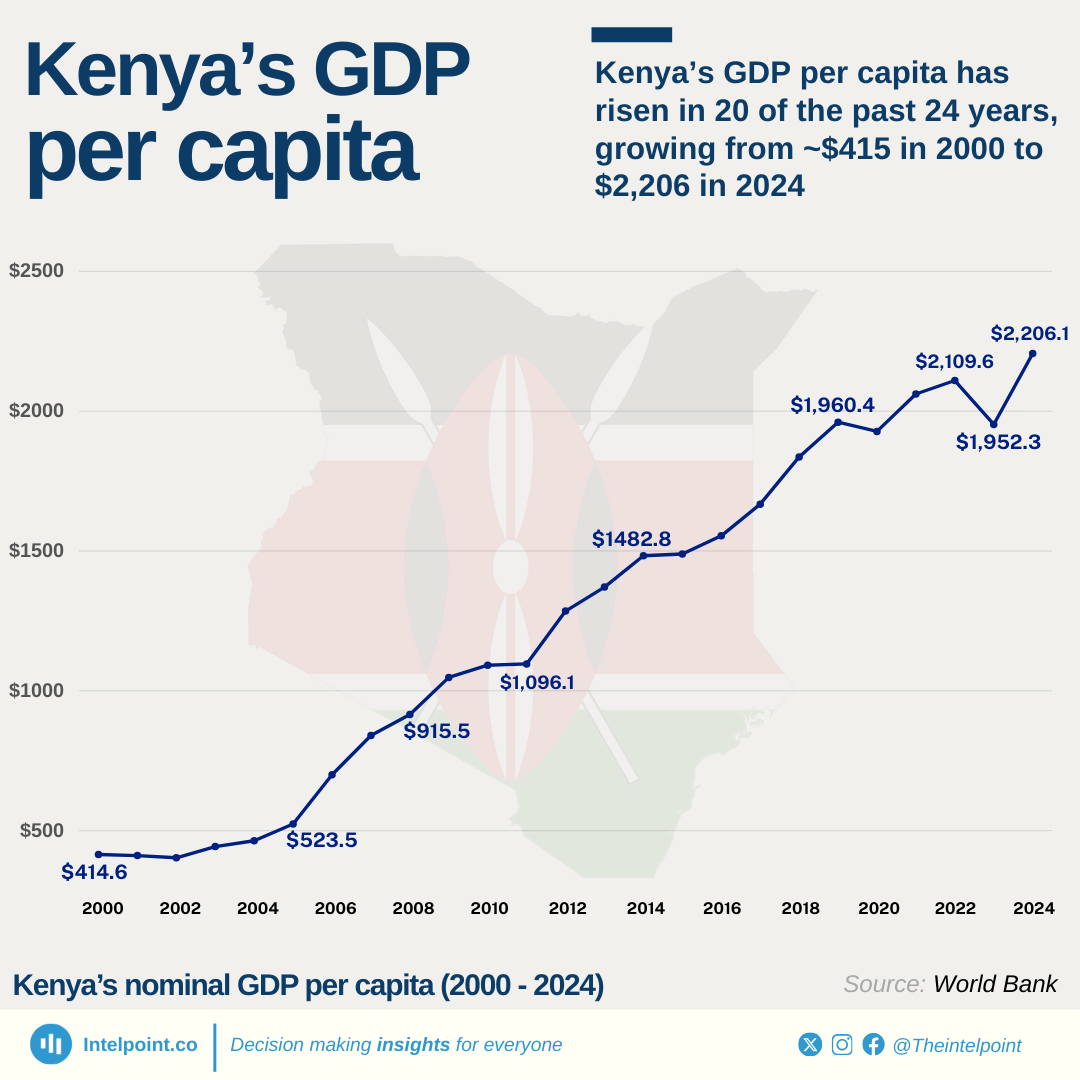
Kenya’s GDP per capita has climbed from $414.6 in 2000 to an all-time high of $2206.1 in 2024, a 532% increase in the last 25 years.

The early 2000s began with economic stagnation and little to no growth. The country experienced its first significant growth between 2005 and 2006, recording a $176.3 (33.7%) increase. From 2006, GDP per capita continued to rise steadily, reaching $1,960.4 by 2019. However, in 2020, the COVID-19 pandemic caused a sharp decline in economic activity and income levels. Kenya quickly rebounded in 2021, moving from $1,927.7 in 2020 to $2,061.4.

In 2022, growth slowed, and by 2023, GDP per capita dipped to $1,952.3, recording a 7.5% decrease. Kenya rose by 13% in 2024 with $2.206.1, which solidified the country's lead position among other East African mainland countries like Uganda, Ethiopia and Tanzania.

Source:

World Bank

Period:

2000-2024
HTML code to embed chart
Want a bespoke report?
Reach out
Tags
Related Insights

10 Nigerian states and the FCT cut their external debt by a combined $227.19 million in H1 2025
  • Ten states and the FCT collectively reduced their external debt by $227.19 million in H1 2025.
  • Lagos, Edo, and Rivers accounted for most of the reductions, making up more than three-quarters of the total.
  • Several smaller states also trimmed their balances, but by relatively modest amounts.
  • These reductions significantly offset the increases recorded by 26 other states, helping keep nationwide net external debt growth low.

26 Nigerian states added a combined $239m to their external debt in H1 2025
  • 26 states increased their external debt by a combined $239 million in H1 2025.
  • Imo, Oyo, Kaduna, Enugu, and Ogun recorded the biggest increases.
  • 11 states, including the FCT, reduced their debt through higher repayments.
  • Lagos, Edo, Rivers, and Bauchi accounted for most of the $227 million in reductions.
  • Total state external debt rose only slightly, from $4.8 billion to $4.812 billion.

Debt Management Office (DMO) Nigeria received a whopping 92.23% of the $15.5tn allocation for the Federal Ministry of Finance’s MDAs
  • The Debt Management Office (DMO) Nigeria took the lion’s share, with ₦14.3 trillion (92.23%) of the Ministry of Finance's total allocation.
  • The Nigerian Bulk Electricity Trading Plc. received ₦858.7 billion (5.53%), making it the second-highest allocation.
  • The Federal Ministry of Finance (Headquarters) got ₦289.4 billion (1.86%).
  • The Office of the Accountant General of the Federation was allocated ₦50.7 billion (0.33%).
  • The figures reveal how debt servicing priorities overshadow operational and policy-related financial allocations.

From 45% to 2%: How Nigeria lost its global palm oil production share to Asia
  • Indonesia dominated with 46.8M tonnes in 2022, up from 145.7 ktonnes in 1961
  • Malaysia was the second-largest producer in 2022 with 18.5M tonnes
  • Global production has increased from under 2M tonnes (1961) to over 75M tonnes (2022)
  • Thailand, Colombia, and Guatemala have emerged as major producers in recent decades
  • Nigeria was historically significant, but has been overtaken by Asian producers

Over one-fourth of Asia’s forests were in legally established protected areas as of 2024
  • Asia leads globally with 26% of its forests in legally protected areas.
  • The global average stands at 20%, meaning that one-fifth of all forests are under some form of legal protection.
  • Africa and Europe are tied at 23%, both above the global average.
  • South America has only 17% of its forests protected, despite being home to the Amazon rainforest.

Russia has the world's largest forest area at 832.6 Mha, accounting for a dominant 20.1% global share
  • Global forest cover is 4.1 Bha, according to the latest FAO assessment.
  • At 832.6 Mha, 20.1% of the global total, Russia has the world’s largest forest area.
  • Brazil (486.1 Mha; 11.7%) and Canada (368.8 Mha; 8.9%) rank second and third, respectively.
  • The United States (7.5%) and China (5.5%) complete the global top five.
  • Africa’s top contributor is the Democratic Republic of Congo, with 139.2 Mha, 3.4% of the global total.
  • Other African countries in the top 20 include Angola, Zambia, Tanzania, and the Central African Republic, each accounting for approximately 1% of the global forest area.
  • Together, the top ten countries account for over 78% of the world’s total forest area, highlighting the global concentration of forest resources.

POPULAR TOPICS
SIGN UP TO OUR NEWSLETTER
Get periodic updates about the African startup space, access to our reports, among others.
Subscribe Here
Subscription Form

A product of Techpoint Africa. All rights reserved