Cocoa products accounted for 30% of the US' agricultural imports from Sub-Saharan Africa in 2024

Key Takeaways:

  • Cocoa products, including paste, butter, and beans dominated the US' agricultural imports from Sub-Saharan Africa in 2024, making up nearly one-third of the total.
  • Other major import categories included coffee, seafood, oilseed meals, and tree nuts, rounding out the top six.
  • The top 10 agricultural imports accounted for 74% of all the US' agricultural imports from the region.
  • Each of the top 10 products had an import value exceeding $120 million.
  • From SSA, Côte d'Ivoire and Ghana were the leading suppliers of cocoa products to the US in 2024.
  • The top three products together represented 41% of the total agricultural imports from the region.

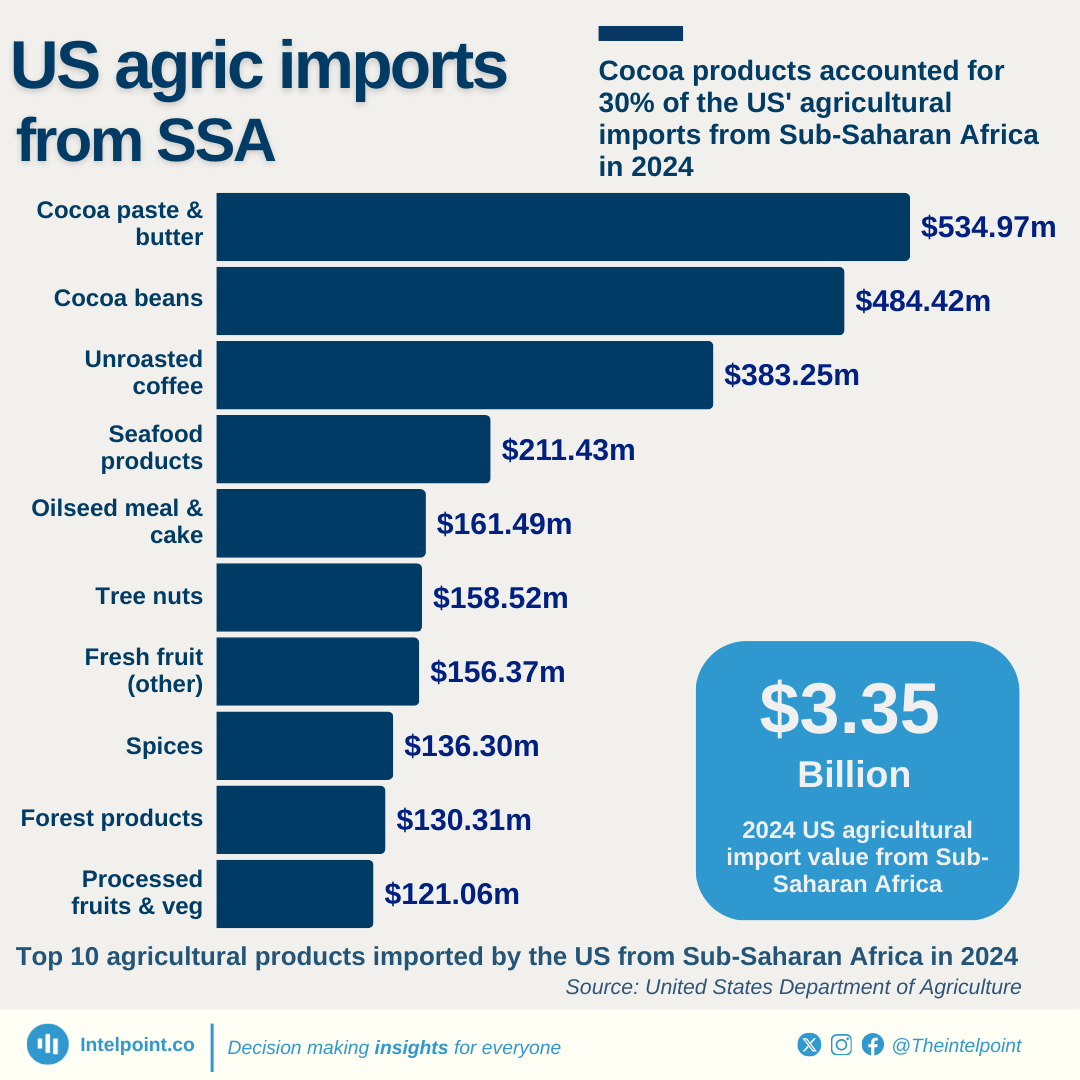
In 2024, the United States imported $3.35 billion worth of agricultural goods from Sub-Saharan Africa. Cocoa paste and cocoa butter led these imports at $534.97 million (16%), followed by cocoa beans at $484.42 million (14%) and unroasted coffee at $383.25 million (11%).

Other notable products included seafood, oilseed meals, fruits, and spices. The top 10 agricultural products collectively accounted for 74% of all the US' agricultural imports from Sub-Saharan Africa.

Source:

United States Department of Agriculture

Period:

2024
HTML code to embed chart
Want a bespoke report?
Reach out
Tags
Related Insights

Morocco leads Africa in digital trade surpluses, with $26 billion 20-year cumulative gain
  • Morocco achieved the highest cumulative surplus in Africa’s digital trade at $26.4 billion between 2005 and 2024.
  • Mauritius and Tunisia followed distantly with surpluses of $8.7 billion and $4.4 billion, respectively.
  • Nigeria and Angola recorded the deepest deficits, each exceeding $90 billion cumulatively.
  • Africa’s overall digital trade balance remained negative, averaging a -$618 million deficit in 2024.
  • Smaller economies like Kenya and Togo managed modest but consistent surpluses over the years.

In 2024, Asia and Europe together accounted for 63% of the world's copper export value
  • Asia leads global copper exports with 31.6% of total export value.
  • Europe follows closely at 31.4%, making the two regions nearly equal in contribution.
  • Combined, Asia and Europe control 63% of the global copper export market.
  • Africa ranks third globally, contributing 15.3% to copper exports.
  • Oceania plays the smallest role, with just 2% of the total export value.

Just 10 countries in Africa control 98% of the continent’s copper export value
  • The DR Congo is Africa’s copper giant, exporting $19.8 billion in 2024 (56.7% of the total).
  • Zambia follows with $7.6 billion, representing 21.7% of exports.
  • Together, the DR Congo and Zambia control almost 80% of Africa’s copper trade.
  • Tanzania is the third-largest exporter with $2.2 billion (6.3%).
  • Despite 52 African countries exporting copper, 42 of them collectively make up only 2% of the total value.

South Africa’s digital service imports still outweighed exports as of 2024, even after 300% growth since 2005
  • South Africa’s digital service imports consistently overshadowed export earnings, despite exports growing by over 300% since 2005.
  • South Africa exported $76.418 billion in digital services between 2005 and 2024.
  • Imports during the same period reached $113.67 billion.
  • The result was a trade deficit of $37.252 billion in over 20 years.
  • Exports rose from just $1.71 billion in 2005 to $7.05 billion in 2024.

Ghana recorded $53.00B in digital services imports against $49.1B in exports in 20 years
  • Ghana exported $49.11 billion in digital services between 2005 and 2024.
  • Digital services imports recorded during the same period was $53.00 billion.
  • Ghana recorded a $3.9 billion trade deficit across the two decades.
  • Exports grew from just $78 million in 2005 to $5.18 billion in 2024.

Since 2005, Egypt’s digital service imports have consistently exceeded exports, creating a $56b deficit
  • Egypt spends twice as much on digital services imports than it earns from exports, with $8.31b on imports and $4.03b from exports recorded in 2024.
  • Egypt exported $46.007 billion in digital services between 2005 and 2024.
  • Imports during the same period reached $101.98 billion.
  • The result was a trade deficit of $55.973 billion in over 20 years.
  • Export earnings rose from just $1.91 billion in 2005 to $4.03 billion in 2024.

POPULAR TOPICS
SIGN UP TO OUR NEWSLETTER
Get periodic updates about the African startup space, access to our reports, among others.
Subscribe Here
Subscription Form

A product of Techpoint Africa. All rights reserved