Cocoa led Nigeria’s agricultural exports by value in Q1 2025, with over ₦1.2B

  • The value of agricultural goods exported in Q1 2025 rose to ₦1.70 trillion, up 64.65% year-on-year and 10.63% quarter-on-quarter, highlighting continued growth in the sector.
  • Standard and superior cocoa beans led the chart, contributing a combined ₦1.23 trillion, with major buyers being The Netherlands (₦344.17B) and Belgium (₦203.17B).
  • Cashew nuts in shell earned ₦157.63B, mostly exported to India (₦87.56B) and Vietnam (₦69.74B), while sesamum seeds brought in ₦128.18B.
  • Soya bean flours and ornamental flowers fetched ₦27B and ₦18B respectively, showing Nigeria's export mix is broadening.

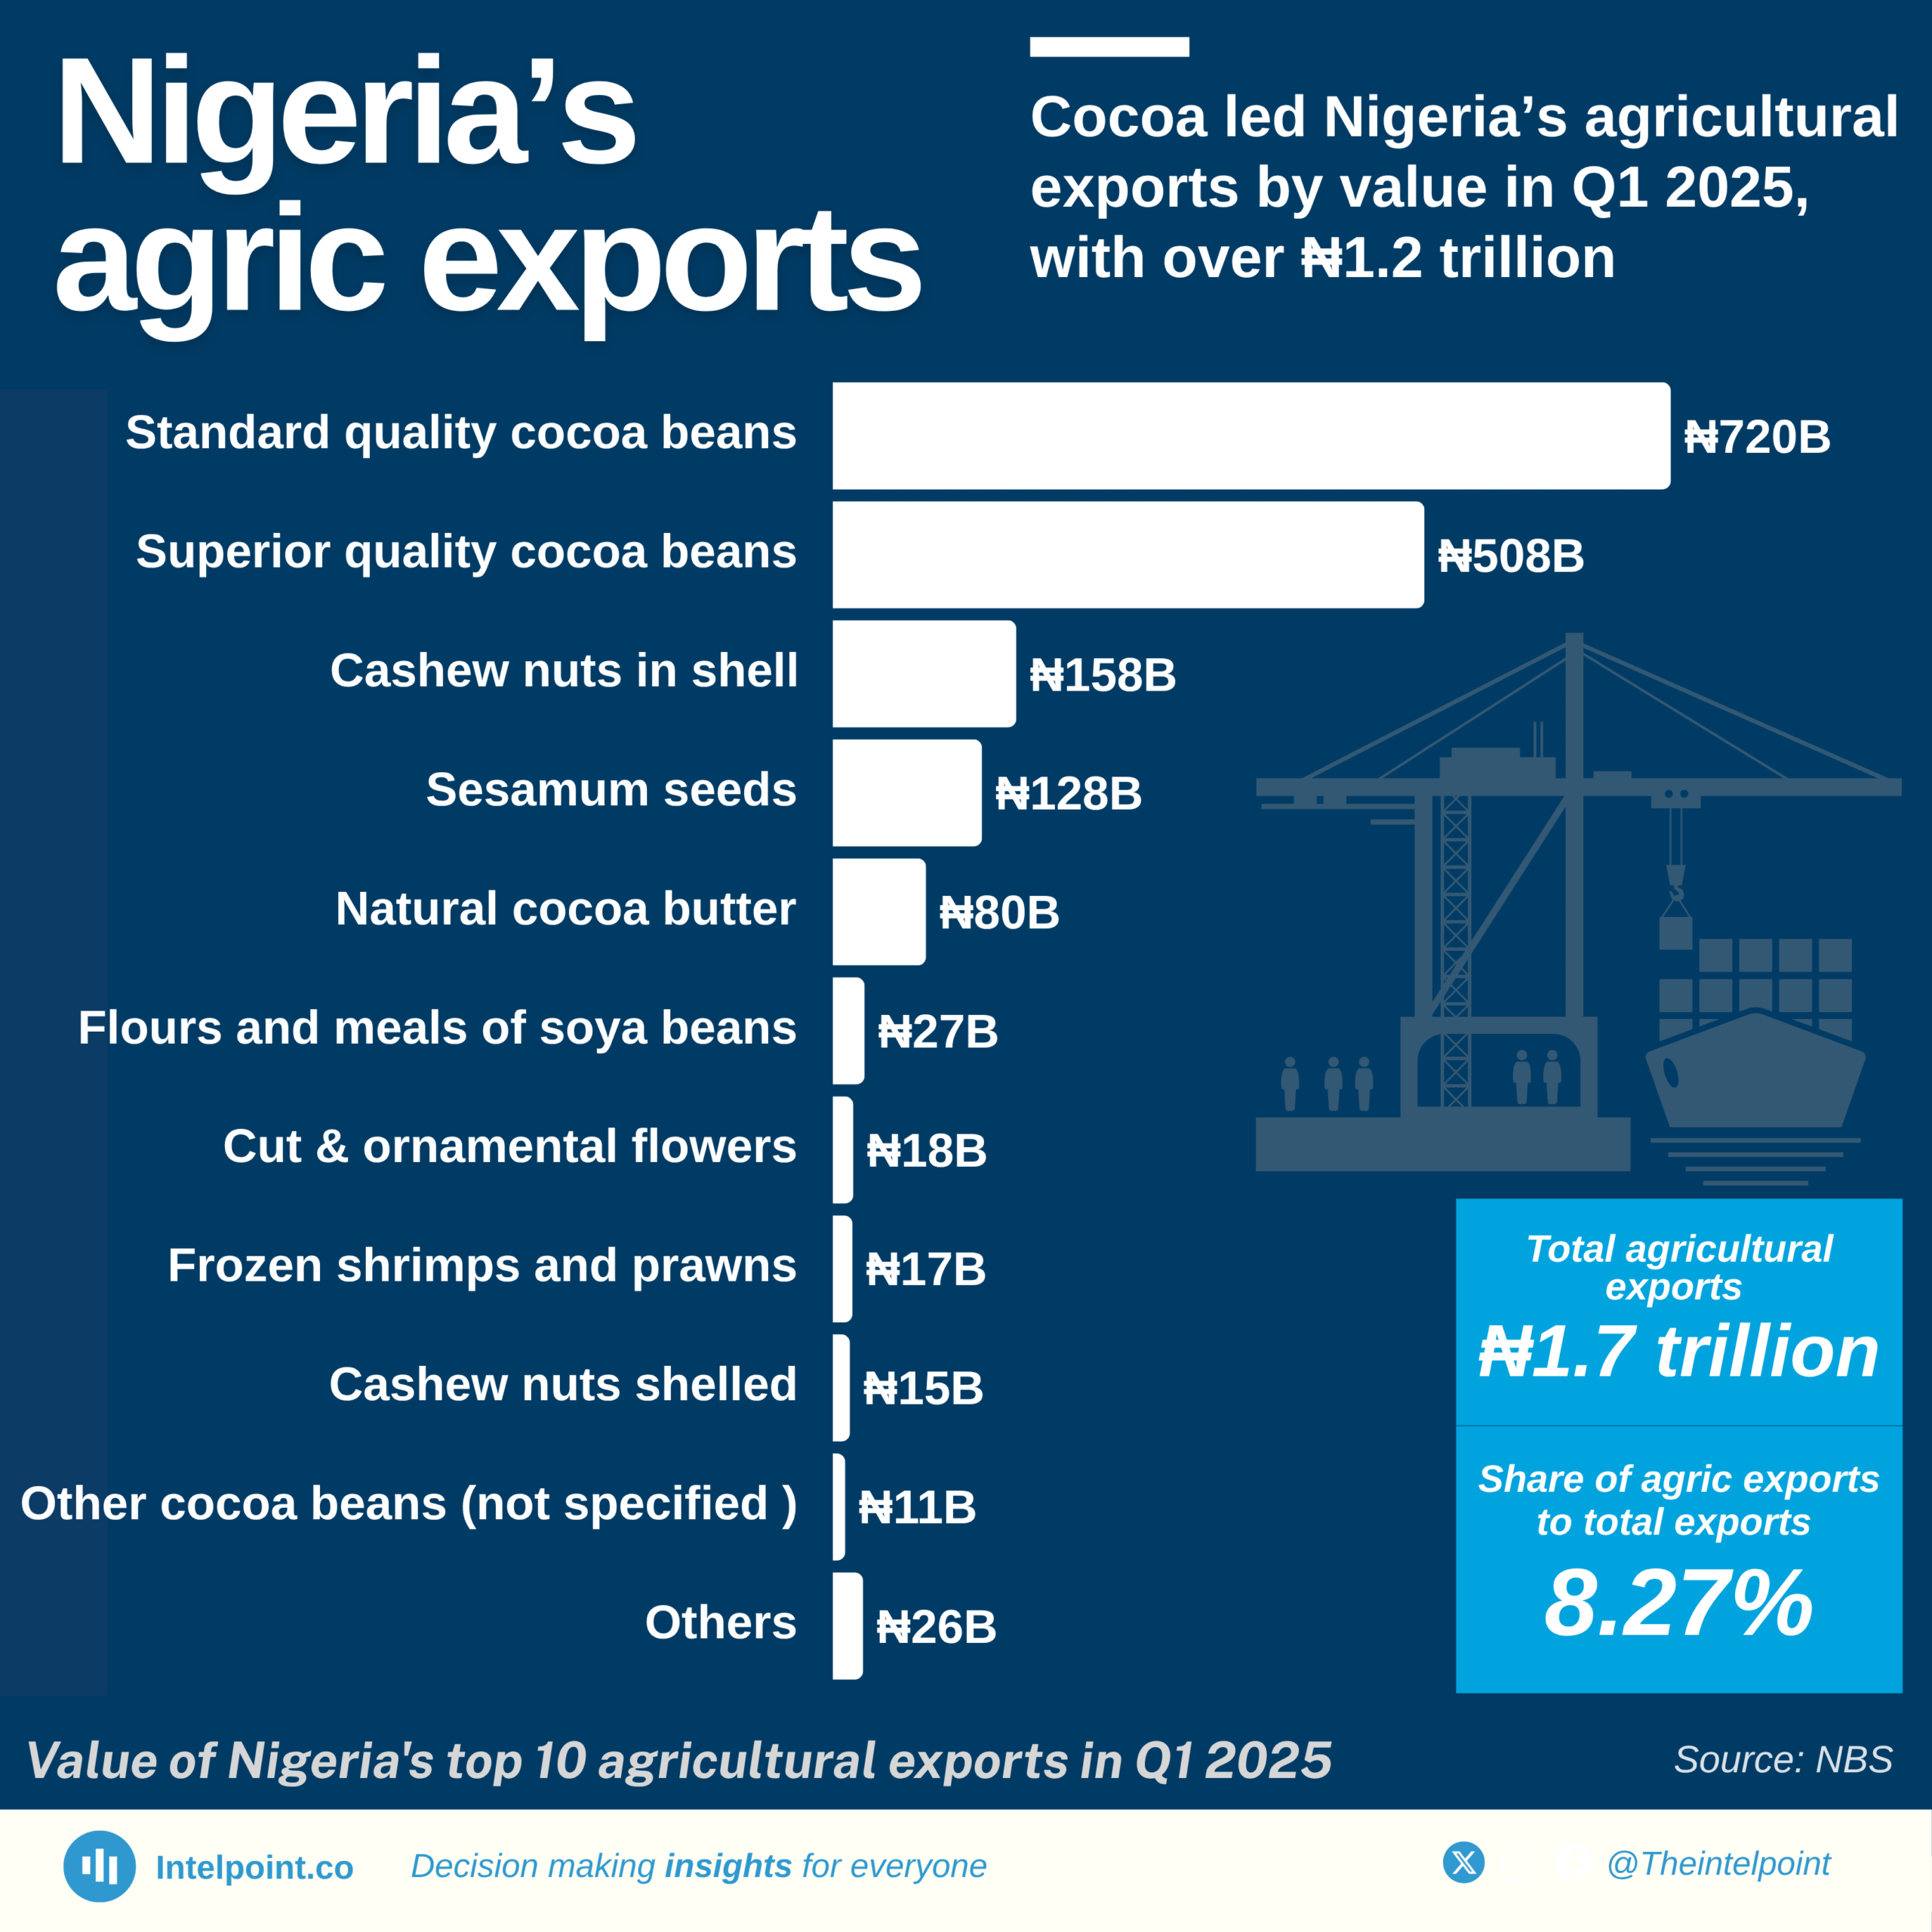
Nigeria's agricultural exports soared to ₦1.7 trillion (approximately $1.079 billion) in the first quarter of 2025, marking a significant 64.65% increase from Q1 2024. This impressive growth was largely driven by cocoa exports, which brought in over ₦1.2 trillion, primarily from standard and superior quality beans shipped to the Netherlands and Belgium.

Other strong performers included cashew nuts (₦158 billion) and sesamum seeds (₦128 billion). There was also notable growth in semi-processed goods like natural cocoa butter and soya flour. Additionally, non-traditional exports such as cut and ornamental flowers, along with frozen shrimps and prawns, showed increasing diversification, contributing to an expanding export base beyond a few core commodities.

This strong performance in Q1 2025 highlights Nigeria's growing momentum in the global agricultural market, signalling improved market penetration and a critical step toward economic diversification.

Source:

National Bureau of Statistics

Period:

Q1 2025
HTML code to embed chart
Want a bespoke report?
Reach out
Tags
Related Insights

Agricultural products led Kenya’s 2024 export economy, with coffee, tea, and spices generating $1.7 bn
  • Agriculture dominated Kenya’s exports, with coffee, tea, and spices alone contributing $1.7 billion, the largest single export category.
  • Mineral fuels were a surprisingly strong second, delivering $1.1 billion, and showing Kenya’s growing role in regional fuel distribution.
  • Horticultural exports (flowers, live plants, and trees) contributed $790 million, reinforcing Kenya’s global strength in floriculture.
  • All other export categories fall below $300 million individually, reflecting a long list of small but diverse export segments such as textiles, vegetables, and pharmaceuticals.

Mining led South Africa’s 2024 exports with 18.7%, as gems and precious metals generated over $20 bn
  • Gems and precious metals were the largest single export category, contributing $20.6 billion.
  • Ores and industrial minerals followed closely with $17.2 billion, showing the country’s reliance on mining.
  • Vehicles and machinery were significant non-mineral exports, with a combined $18.3 billion.
  • Agricultural and light industry products like fruits, nuts, and beverages contributed modestly, strengthening mining and manufacturing’s position as the core export drivers.

Cocoa accounted for 4.6% of Nigeria’s 2024 exports, making it the country’s second-largest export after oil
  • Mineral fuels (including crude oil) accounted for $49.3 billion, or 86.8% of total exports in 2024.
  • Non-oil exports remained marginal, with the second-largest item, cocoa, contributing only 4.6%.
  • Fertilisers, ores, slag, ash, and oilseeds collectively made up less than 5%, indicating limited diversification.
  • All other export categories each contributed 1% or less, underscoring Nigeria’s narrow export base.

Nigeria's energy goods imports have stayed low and stable for 7 years, while exports increased from ₦37B to ₦263B
  • Nigeria’s energy goods exports rose from ₦37.3B in 2017 to ₦262.9B in 2024, before falling to ₦154.2B in H1 2025.
  • Imports remained consistently low, ranging from ₦24.2M to ₦353.1M throughout the period.
  • Export growth outpaced imports, showing a widening trade surplus in energy goods.
  • The 2024 spike in exports represents the highest export value within the nine-year window.
  • Energy imports stayed below ₦400M yearly, indicating low dependency on foreign energy goods.

For most of the period (2013-H1 2025), China's share of Nigeria's imports from Asia hovers around 50%-55%, showing dominance
  • China has dominated Nigeria’s imports from Asia, maintaining a 50–55% share for most of the period.
  • China’s share reached its highest level at 58.6% in H1 2025.
  • India's import share remained volatile, ranging between 11% and 25%.
  • Total imports from Asia surged from ₦2.6 trillion in 2013 to ₦16.4 trillion in H1 2025.

Nigeria's agricultural imports' share has been dropping, from 83.9% (2017) to a low of 42.9% (H1 2025)
  • Agricultural imports fell from 83.9% in 2017 to 42.9% in H1 2025, indicating a significant decline in import dependency.
  • Agricultural exports grew from 16.1% in 2017 to 54.0% in 2024, surpassing imports for the first time since 2017.
  • Total agricultural trade increased from ₦1.1 trillion in 2017 to ₦8.2 trillion in 2024.
  • Between 2022 and 2024, the import share dropped significantly from 75.7% to 46.0%.

POPULAR TOPICS
SIGN UP TO OUR NEWSLETTER
Get periodic updates about the African startup space, access to our reports, among others.
Subscribe Here
Subscription Form

A product of Techpoint Africa. All rights reserved