Burundi and Mozambique consistently rank lowest in African worker productivity since 1991

  • The same countries—Burundi, Malawi, DR Congo, Mozambique, Niger, Liberia, Madagascar, Central African Republic, Chad, and Ethiopia—consistently occupy the bottom ranks over the years.
  • These countries remain far below the continent's average, often with GDP per person employed under $5,000 even in recent years.
  • Progress is marginal: while some, like Ethiopia and Mozambique, show slow growth, many fluctuate or even regress across periods.
  • Structural economic weaknesses, conflict, and low industrialisation seem to persist across the bottom group.

The bottom 10 African countries by GDP per person employed have demonstrated a persistent pattern of economic underperformance in 33 years since 1991.

Countries like Burundi, Malawi, and DR Congo have remained at the lowest end of the scale for over three decades, rarely crossing the $3,000 mark in GDP per person employed. While nations such as Ethiopia and Mozambique show incremental improvement—climbing from near or below $2,000 in the 1990s to the $4,000–$6,000 range recently—the overall trajectory across this group reflects chronic economic stagnation.
Source:

World Bank - World Development Indicators

Period:

1991-2023
HTML code to embed chart
Want a bespoke report?
Reach out
Tags
Related Insights

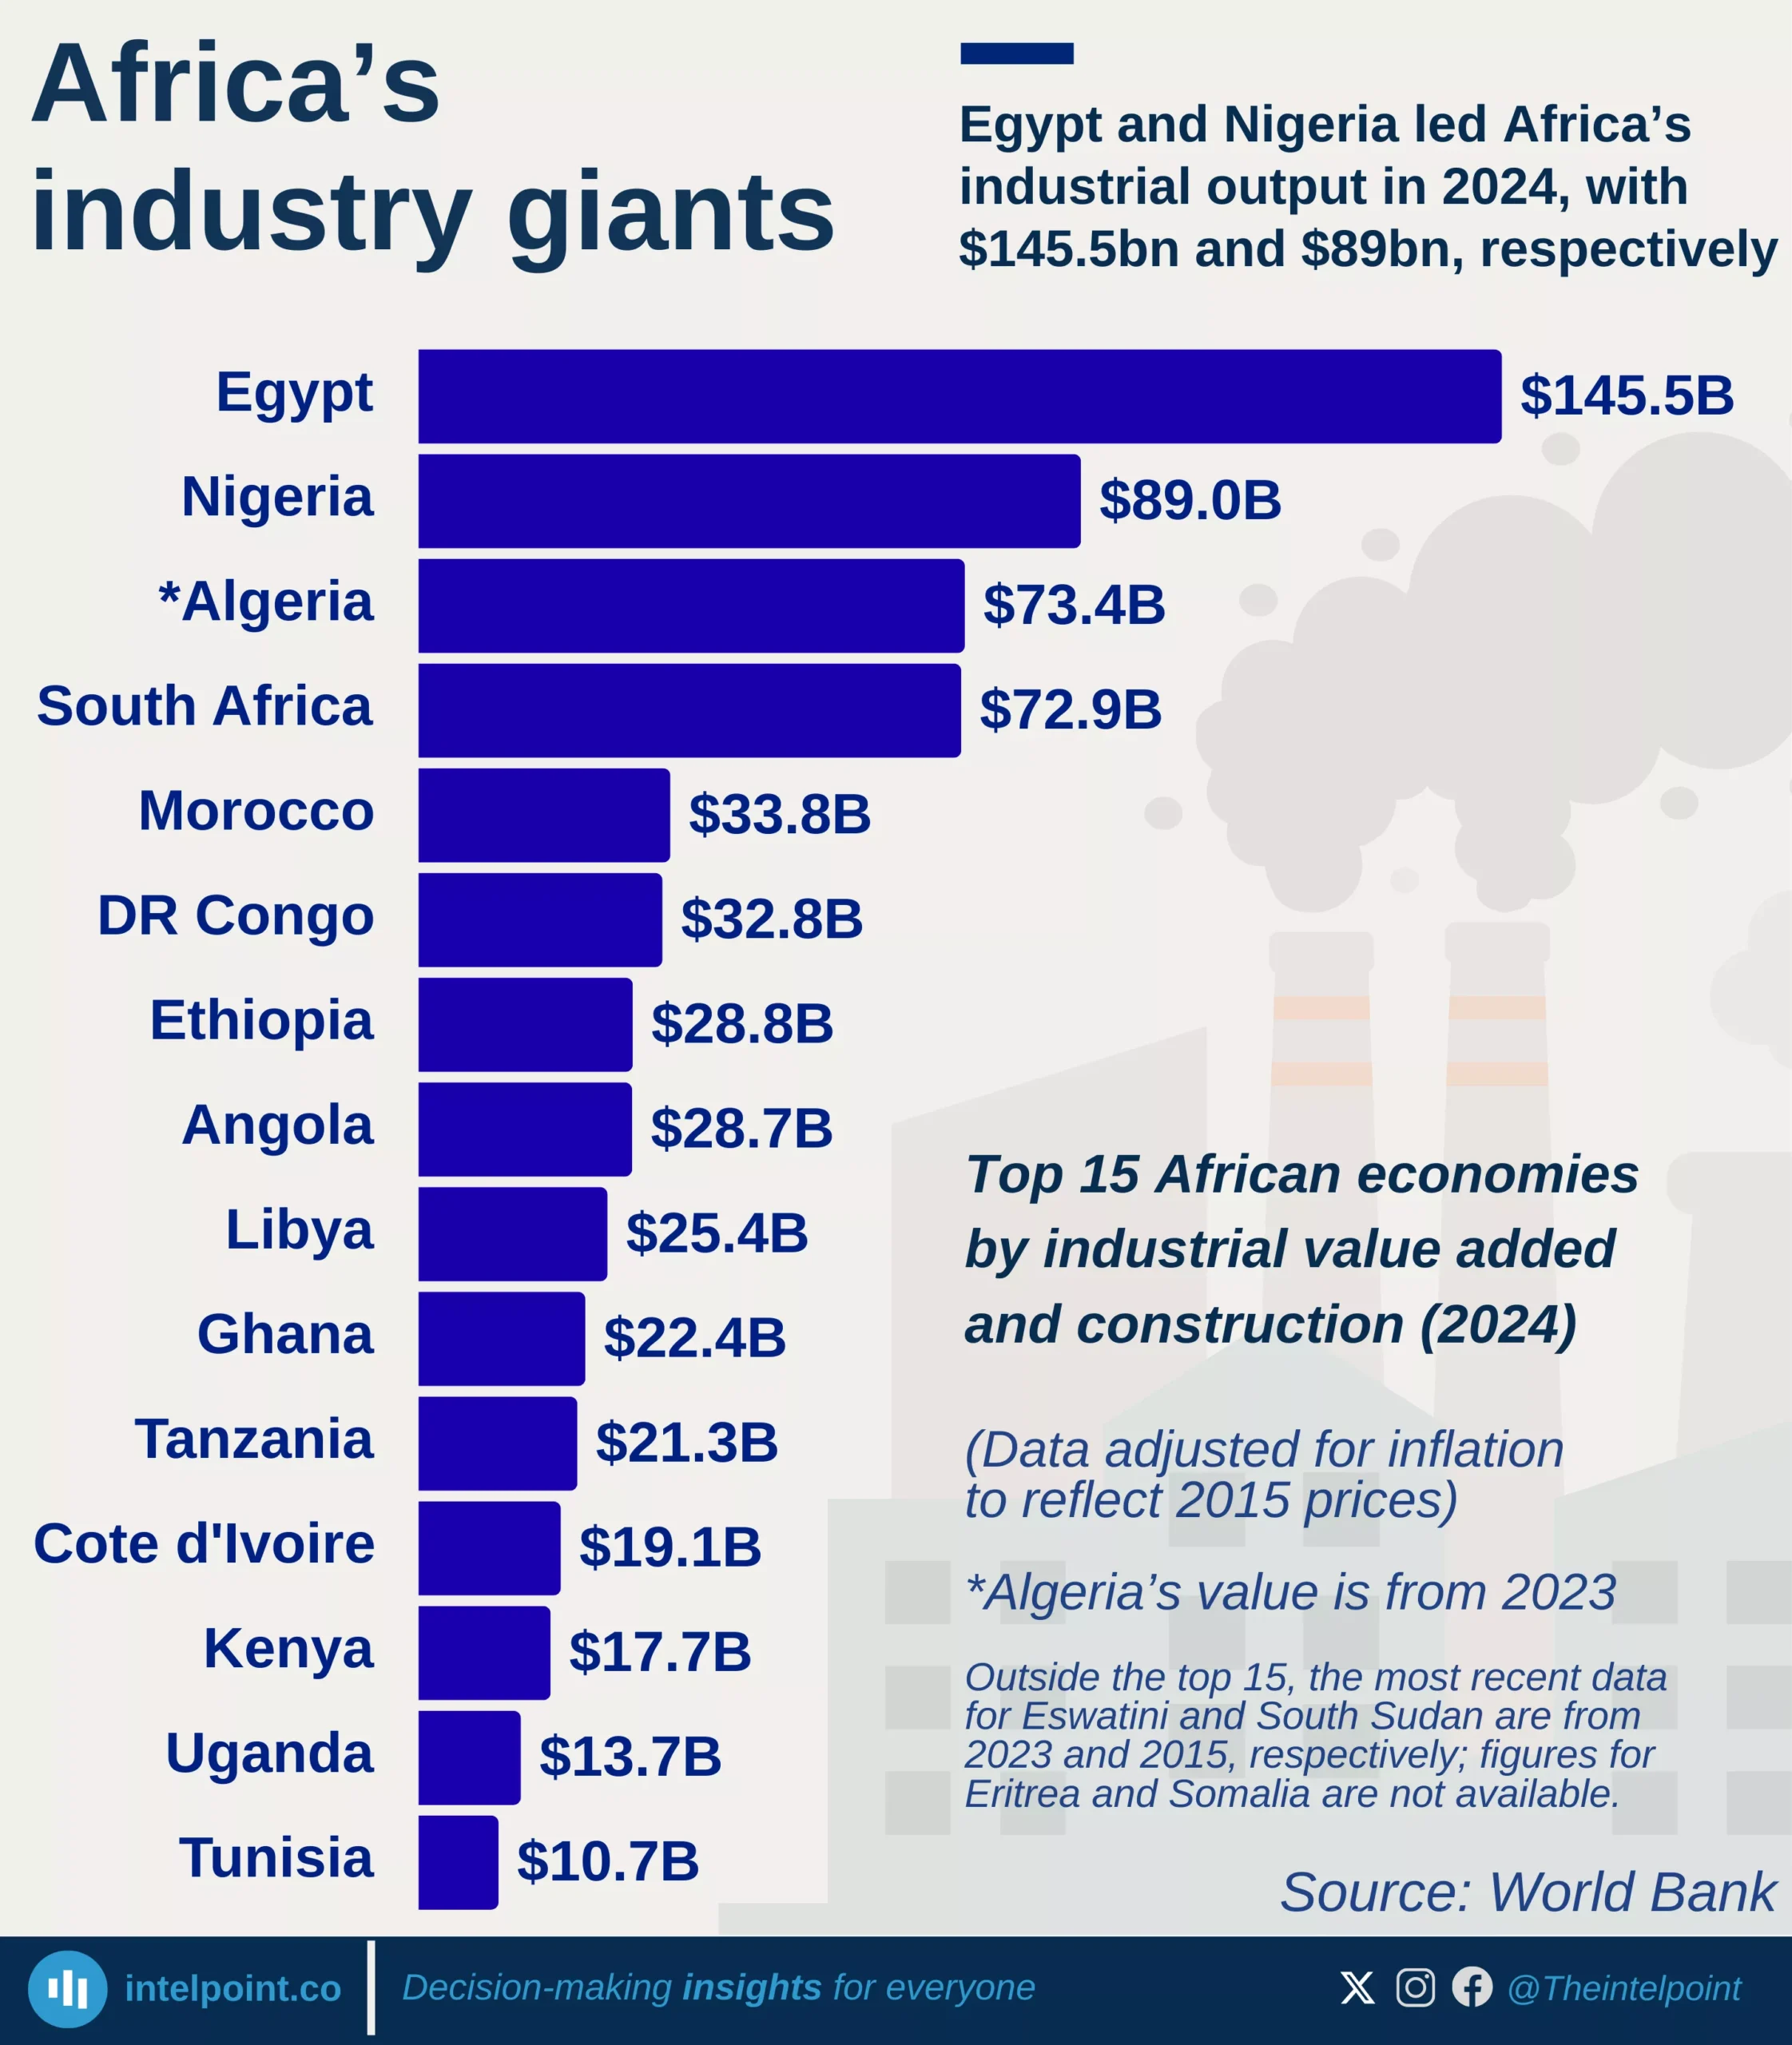
Egypt and Nigeria led Africa’s industrial output in 2024, with $145.5bn and $89bn, respectively
  • Egypt led with an estimated $145.5 billion, accounting for about 25% of Africa's total industrial output among its top 15 economies.
  • Nigeria followed with $89 billion, while South Africa, Algeria, and Morocco made up the rest of the top five.
  • The top five economies accounted for more than 70% of Africa’s total industrial value added.
  • Notable mid-tier performers, Ethiopia and DR Congo, reflected rapid industrial investment.
  • Using constant 2015 USD reveals real production strength, not nominal currency shifts.

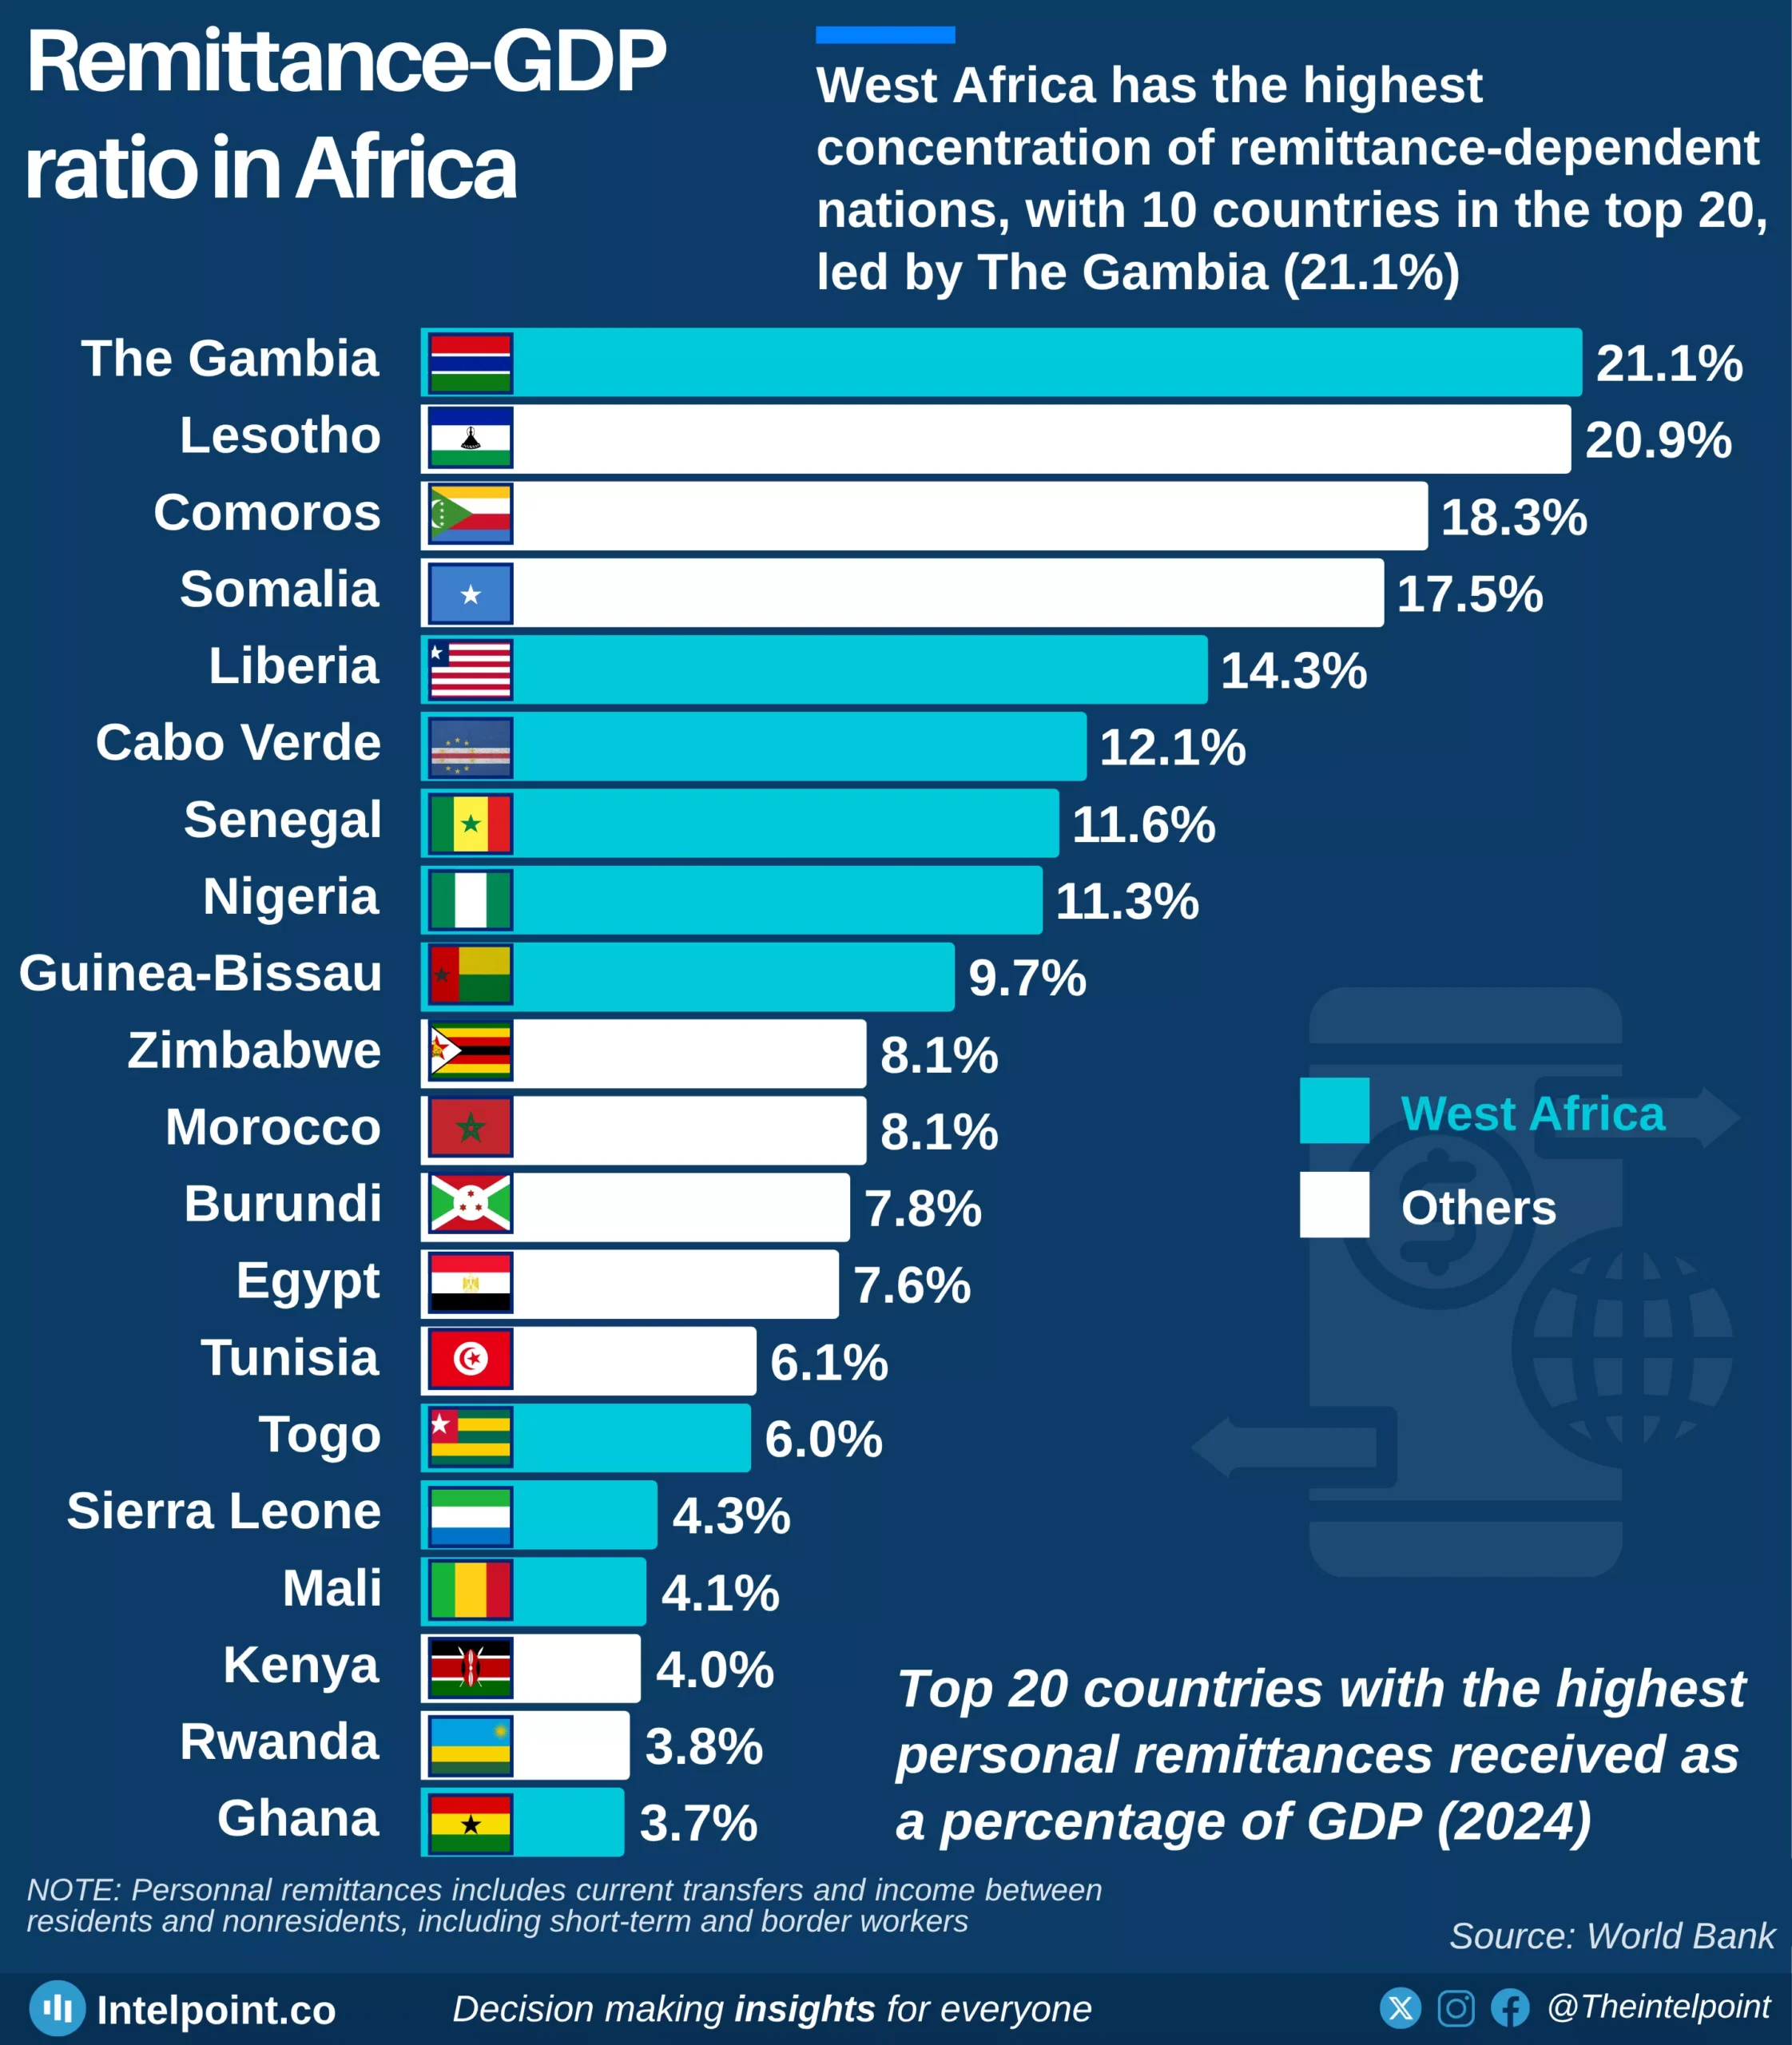
West Africa has the highest concentration of remittance-dependent nations, with 10 countries in the top 20, led by The Gambia (21.1%)
  • The Gambia leads Africa in remittance-GDP ratio, with remittance accounting for 21.1% of its GDP in 2024.
  • Lesotho (20.9%) and Comoros (18.3%) closely follow as highly remittance-dependent economies.
  • Somalia (17.5%) and Liberia (14.3%) also rely heavily on diaspora inflows to support their economies.
  • Nigeria (11.3%) remains a major player, highlighting its strong global diaspora network.
  • Cabo Verde (12.1%) and Senegal (11.6%) demonstrate that remittances are key drivers of income in smaller economies.
  • In larger economies like Egypt (7.6%) and Morocco (8.1%), remittances also make up a significant share of GDP.

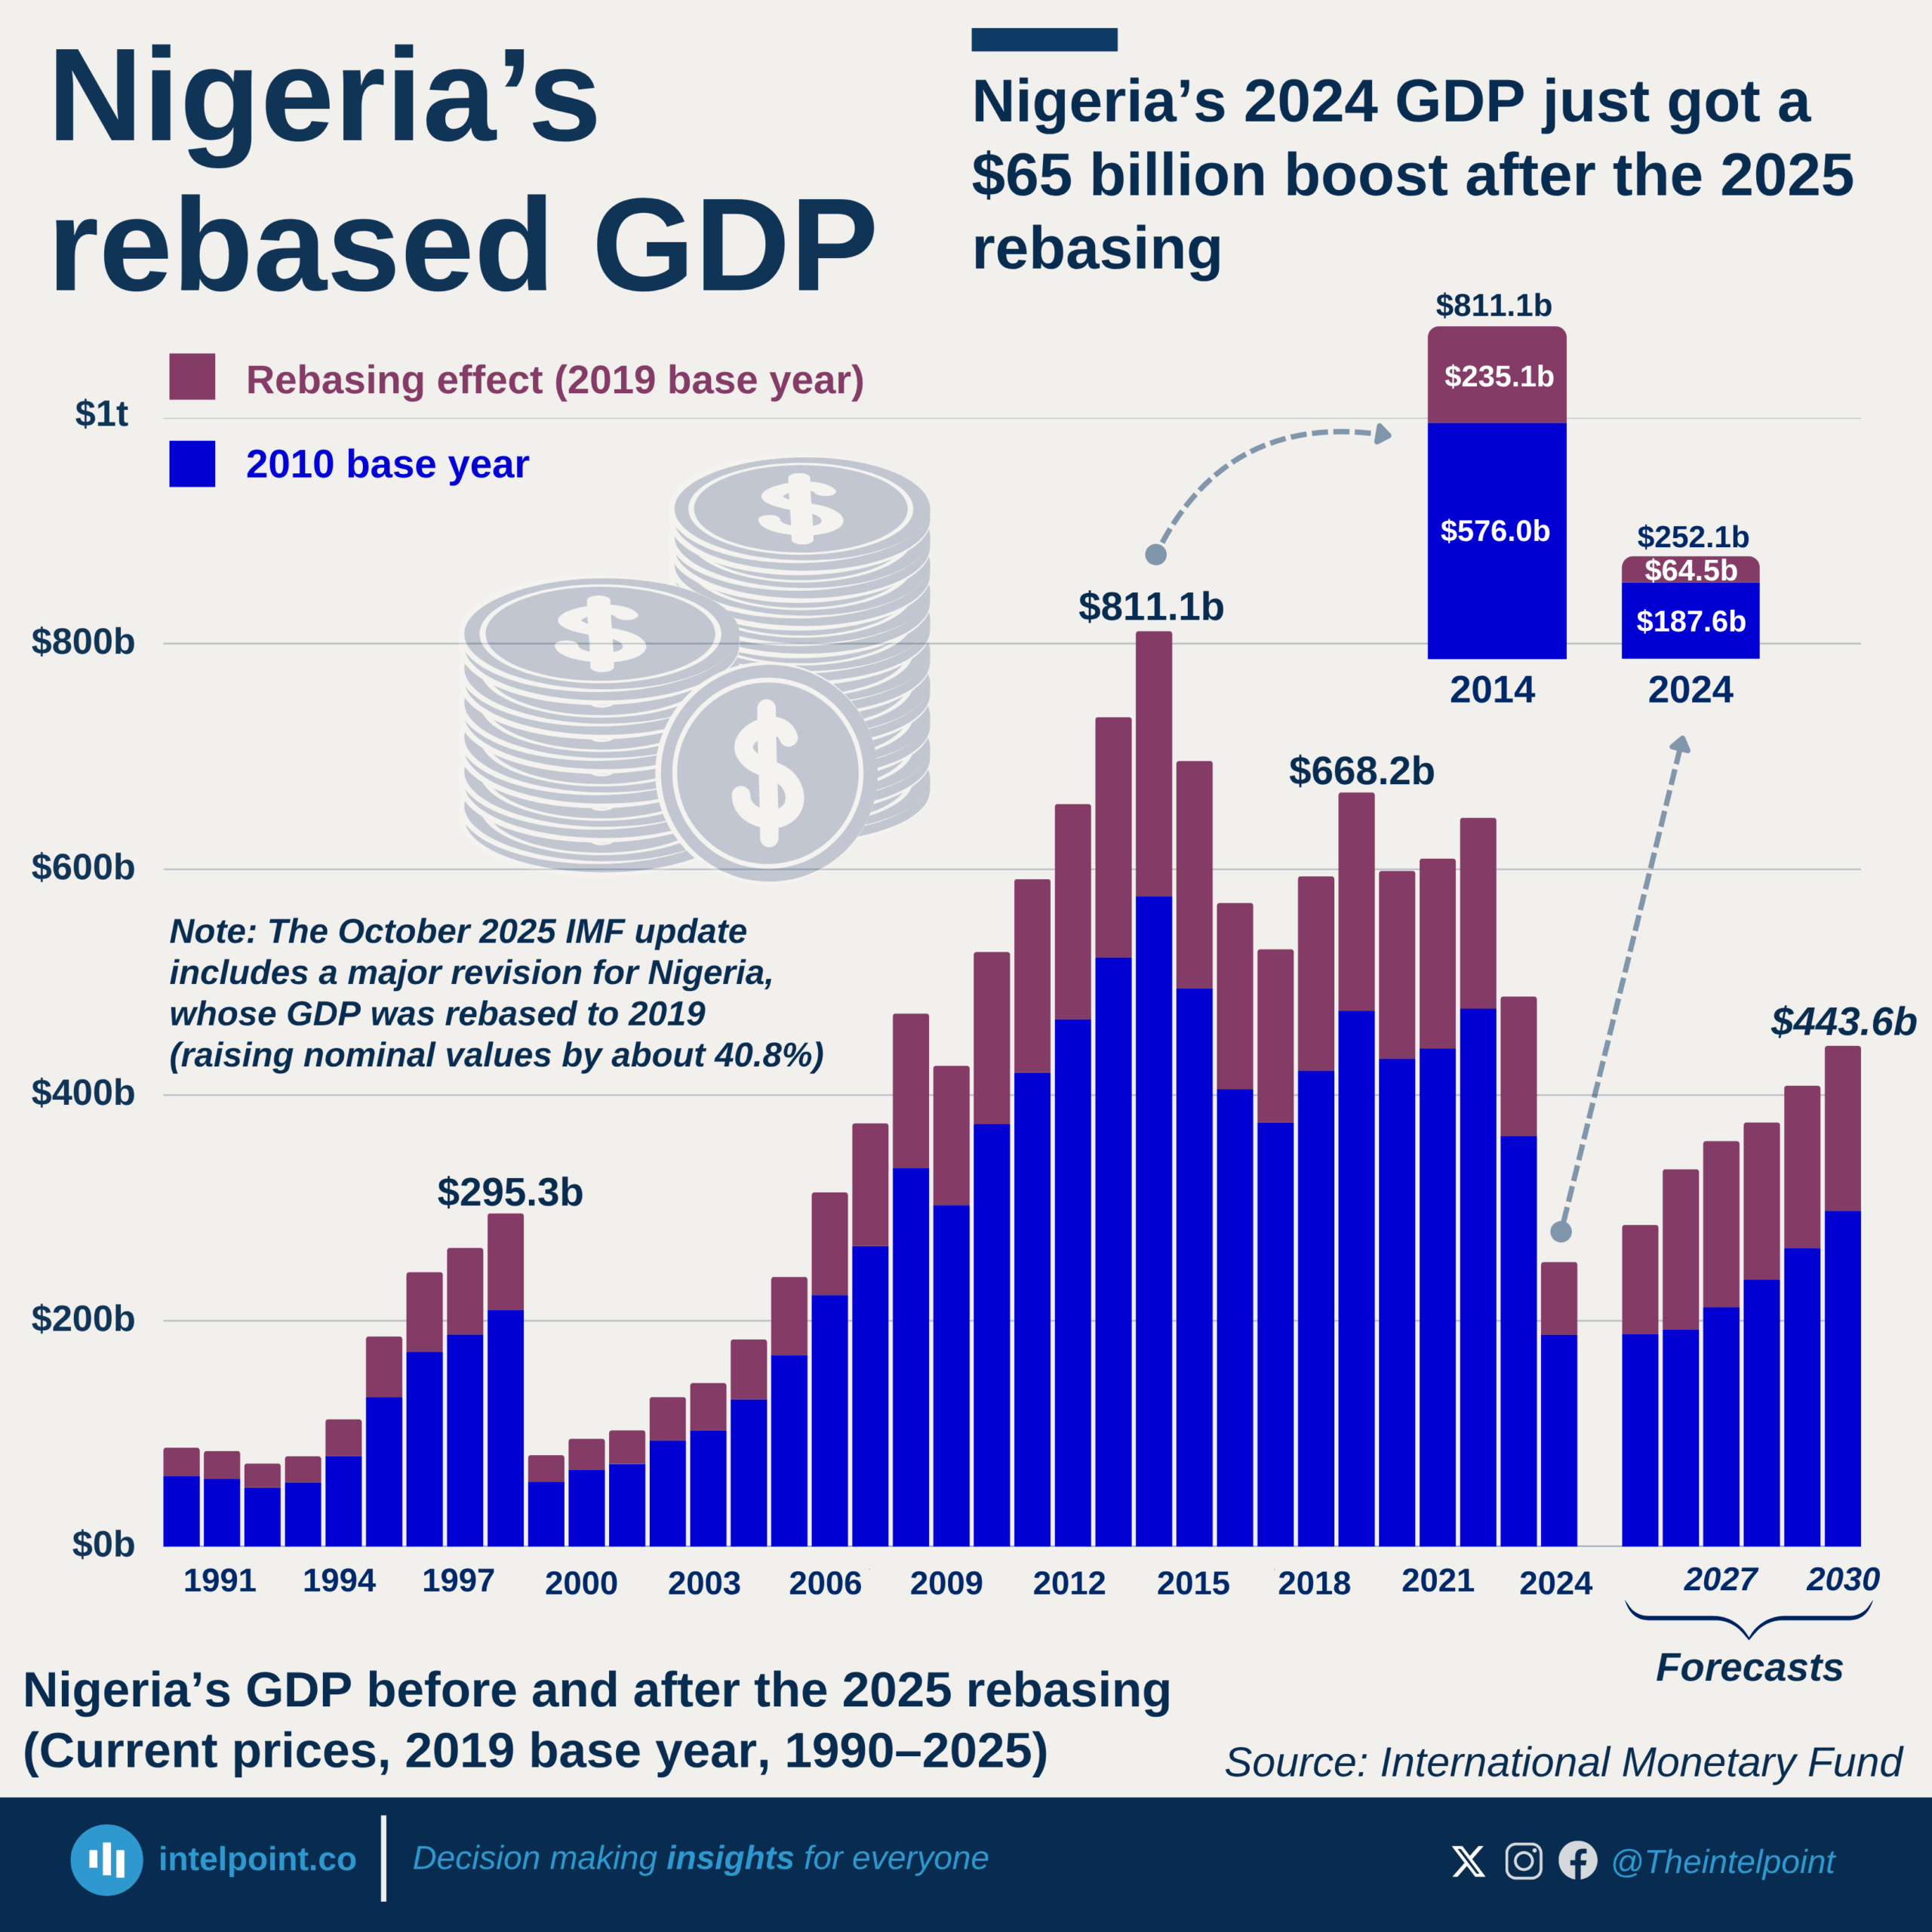
Nigeria’s 2024 GDP just got a $65 billion boost after the 2025 rebasing
  • The IMF’s new 2019 GDP base year added between $20 billion and $235 billion annually to Nigeria’s GDP from 1990–2025.
  • 2014 saw the biggest jump — an upward revision of $235.1 billion, raising GDP to $811.1 billion from $576.0 billion under the old base.
  • The rebased data consistently show 40–45% higher GDP values through the 2000s and 2010s, revealing a larger economy than earlier estimates.
  • The impact was strongest during Nigeria’s oil boom years (2007–2014), when rebasing captured fast-growing sectors like digital services, informal trade, and modular refining.

With new 2019 base year, Nigeria ranked among the world’s 20 largest economies in 1998, 2013, 2014, and 2015 — peaking at $811 billion
  • Nigeria’s GDP has been rebased to a 2019 base year, raising its nominal value by about 40.8%, according to the IMF’s October 2025 update.
  • The revision includes new data on digital, informal, and service sectors, giving a fuller picture of the economy.
  • Nigeria ranked among the world’s top 20 economies in 1998, 2013, 2014, and 2015, peaking in 2014 at $811 billion.
  • Despite later declines from currency depreciation and slower growth, the revision reaffirms Nigeria’s position as Africa’s largest economy.

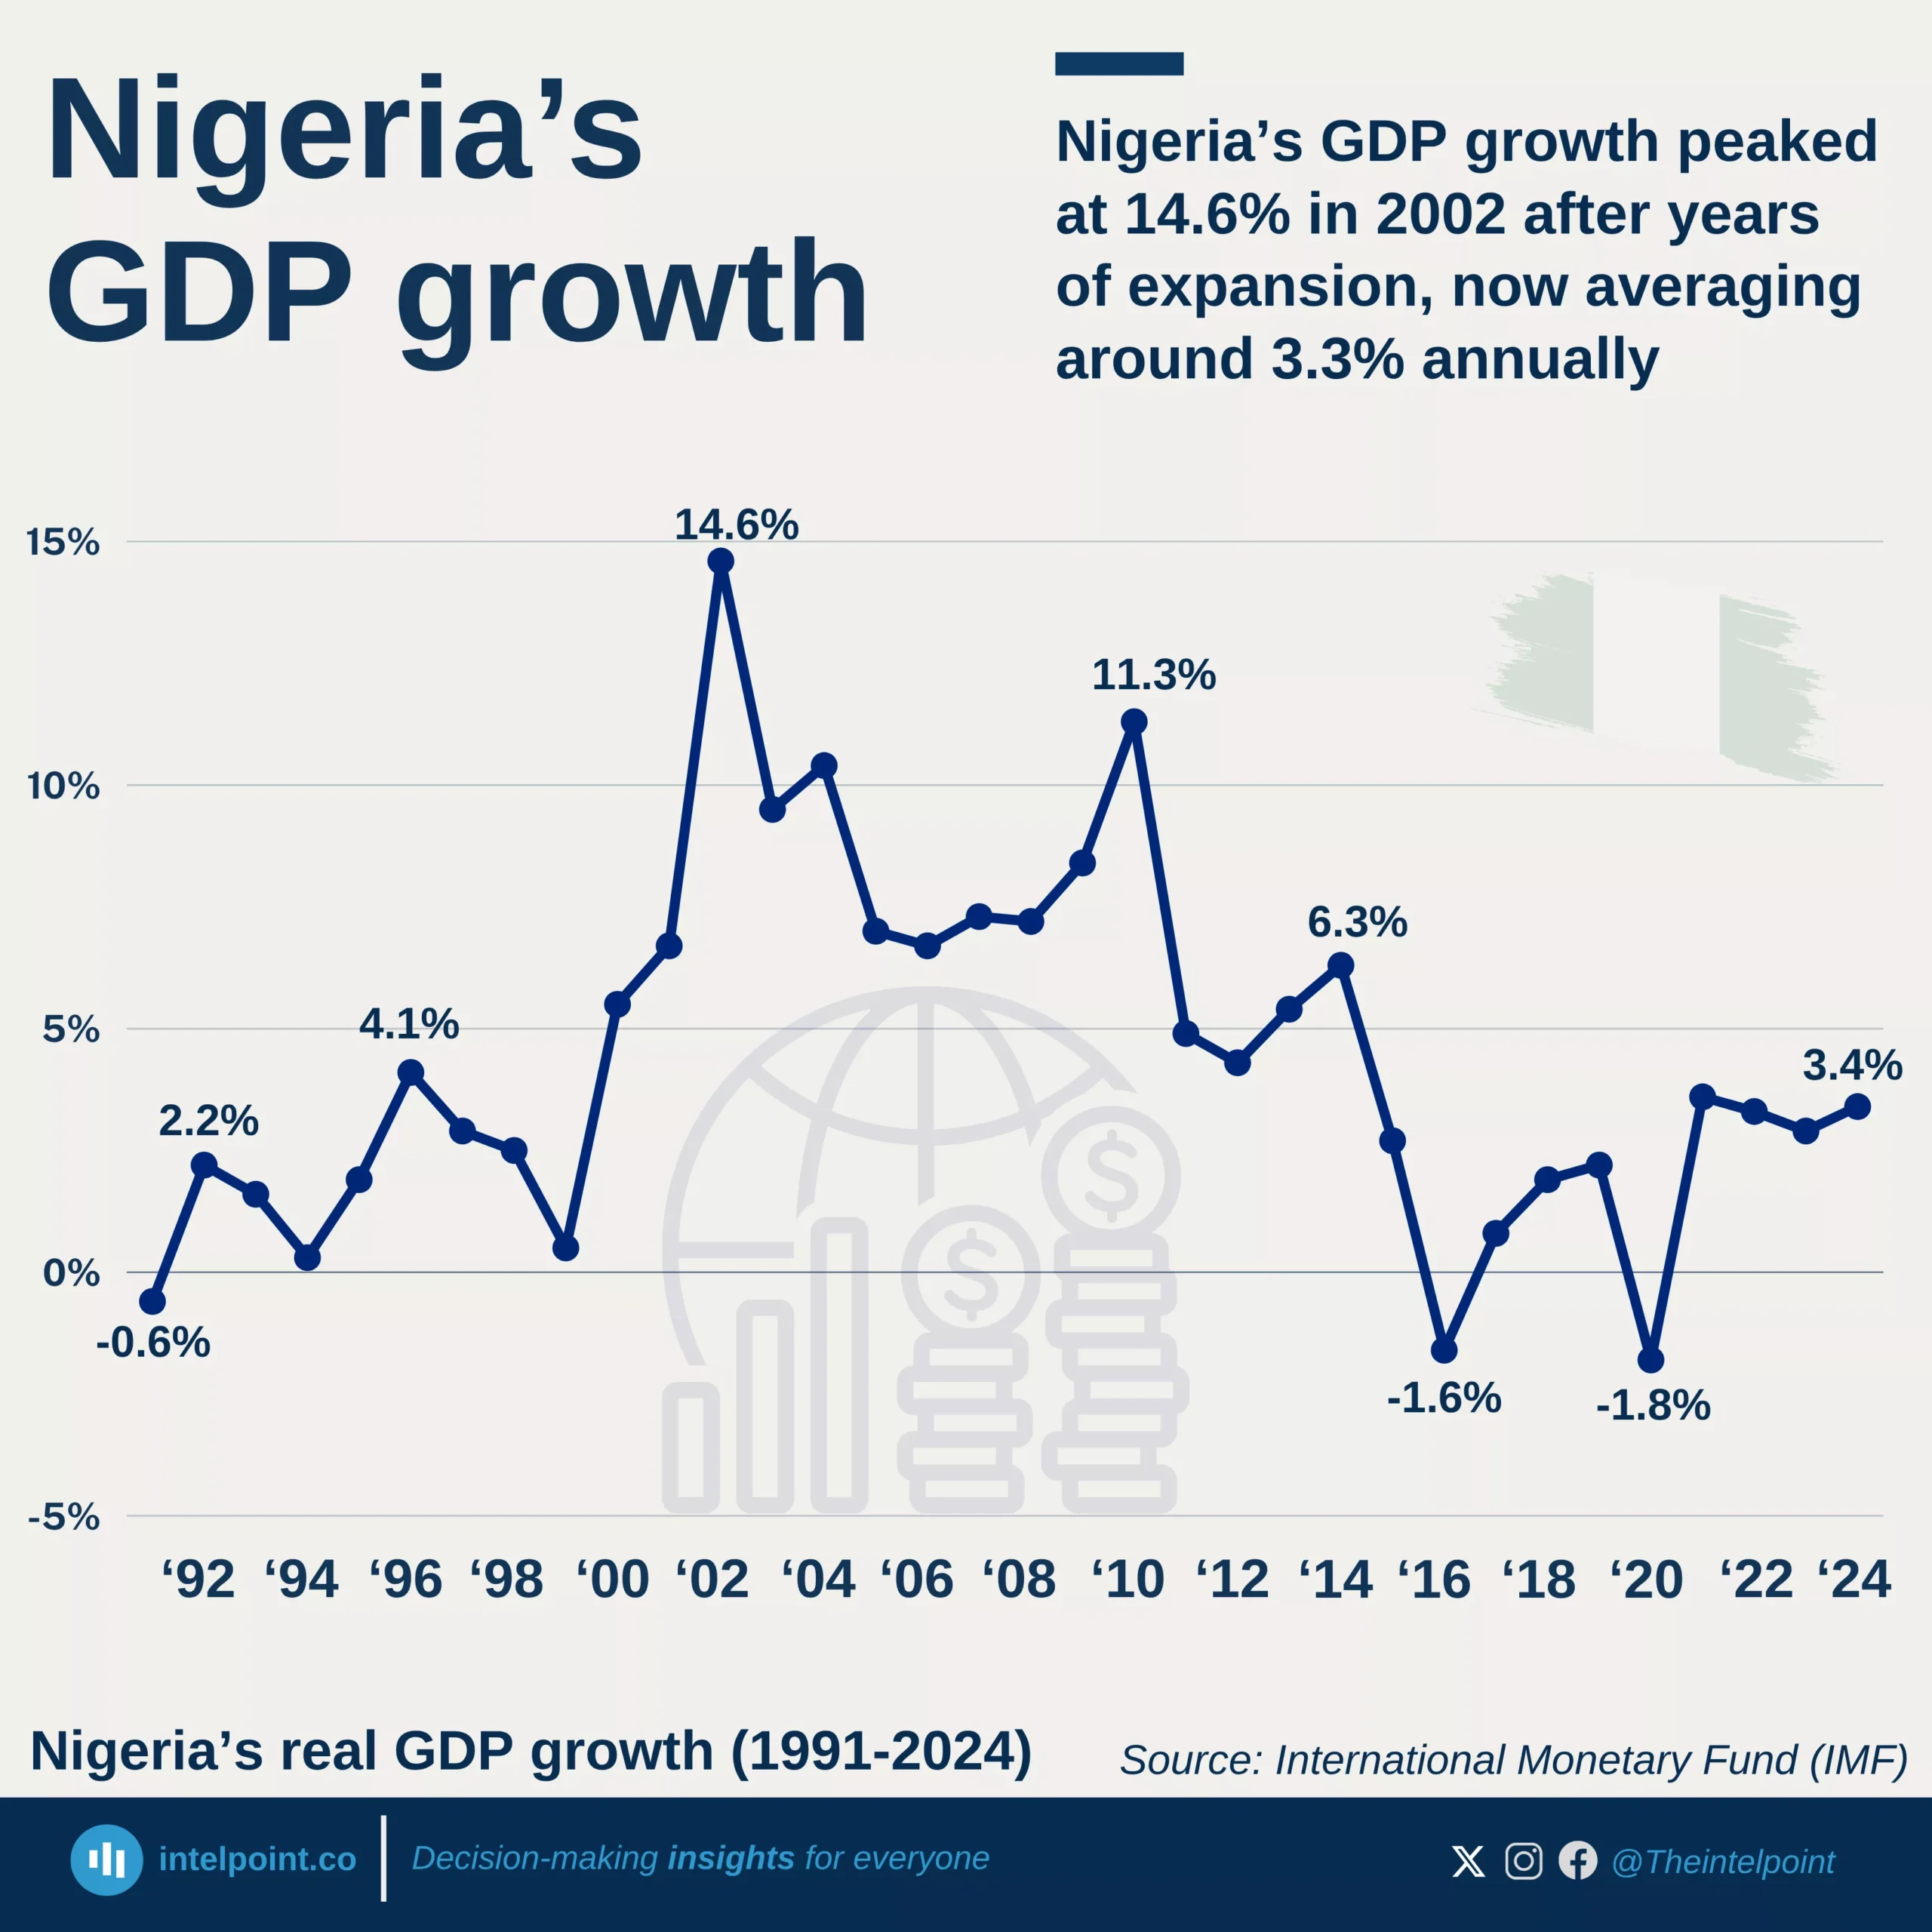
Nigeria’s GDP growth peaked at 14.6% in 2002 after years of expansion, now averaging around 3.3% annually
  • From recession to recovery, Nigeria’s GDP growth journey reveals three decades of economic volatility and slow transformation.
  • Nigeria's economy grew by 14.6% in 2002, which is still the highest in the country's history.
  • The country entered a recession in 2016, with the economy shrinking by -1.6%.
  • Nigeria enjoyed a long period of strong growth between 2003 and 2010: The economy grew between 7% and 11%, powered by high oil prices and booming sectors like telecoms and banking.

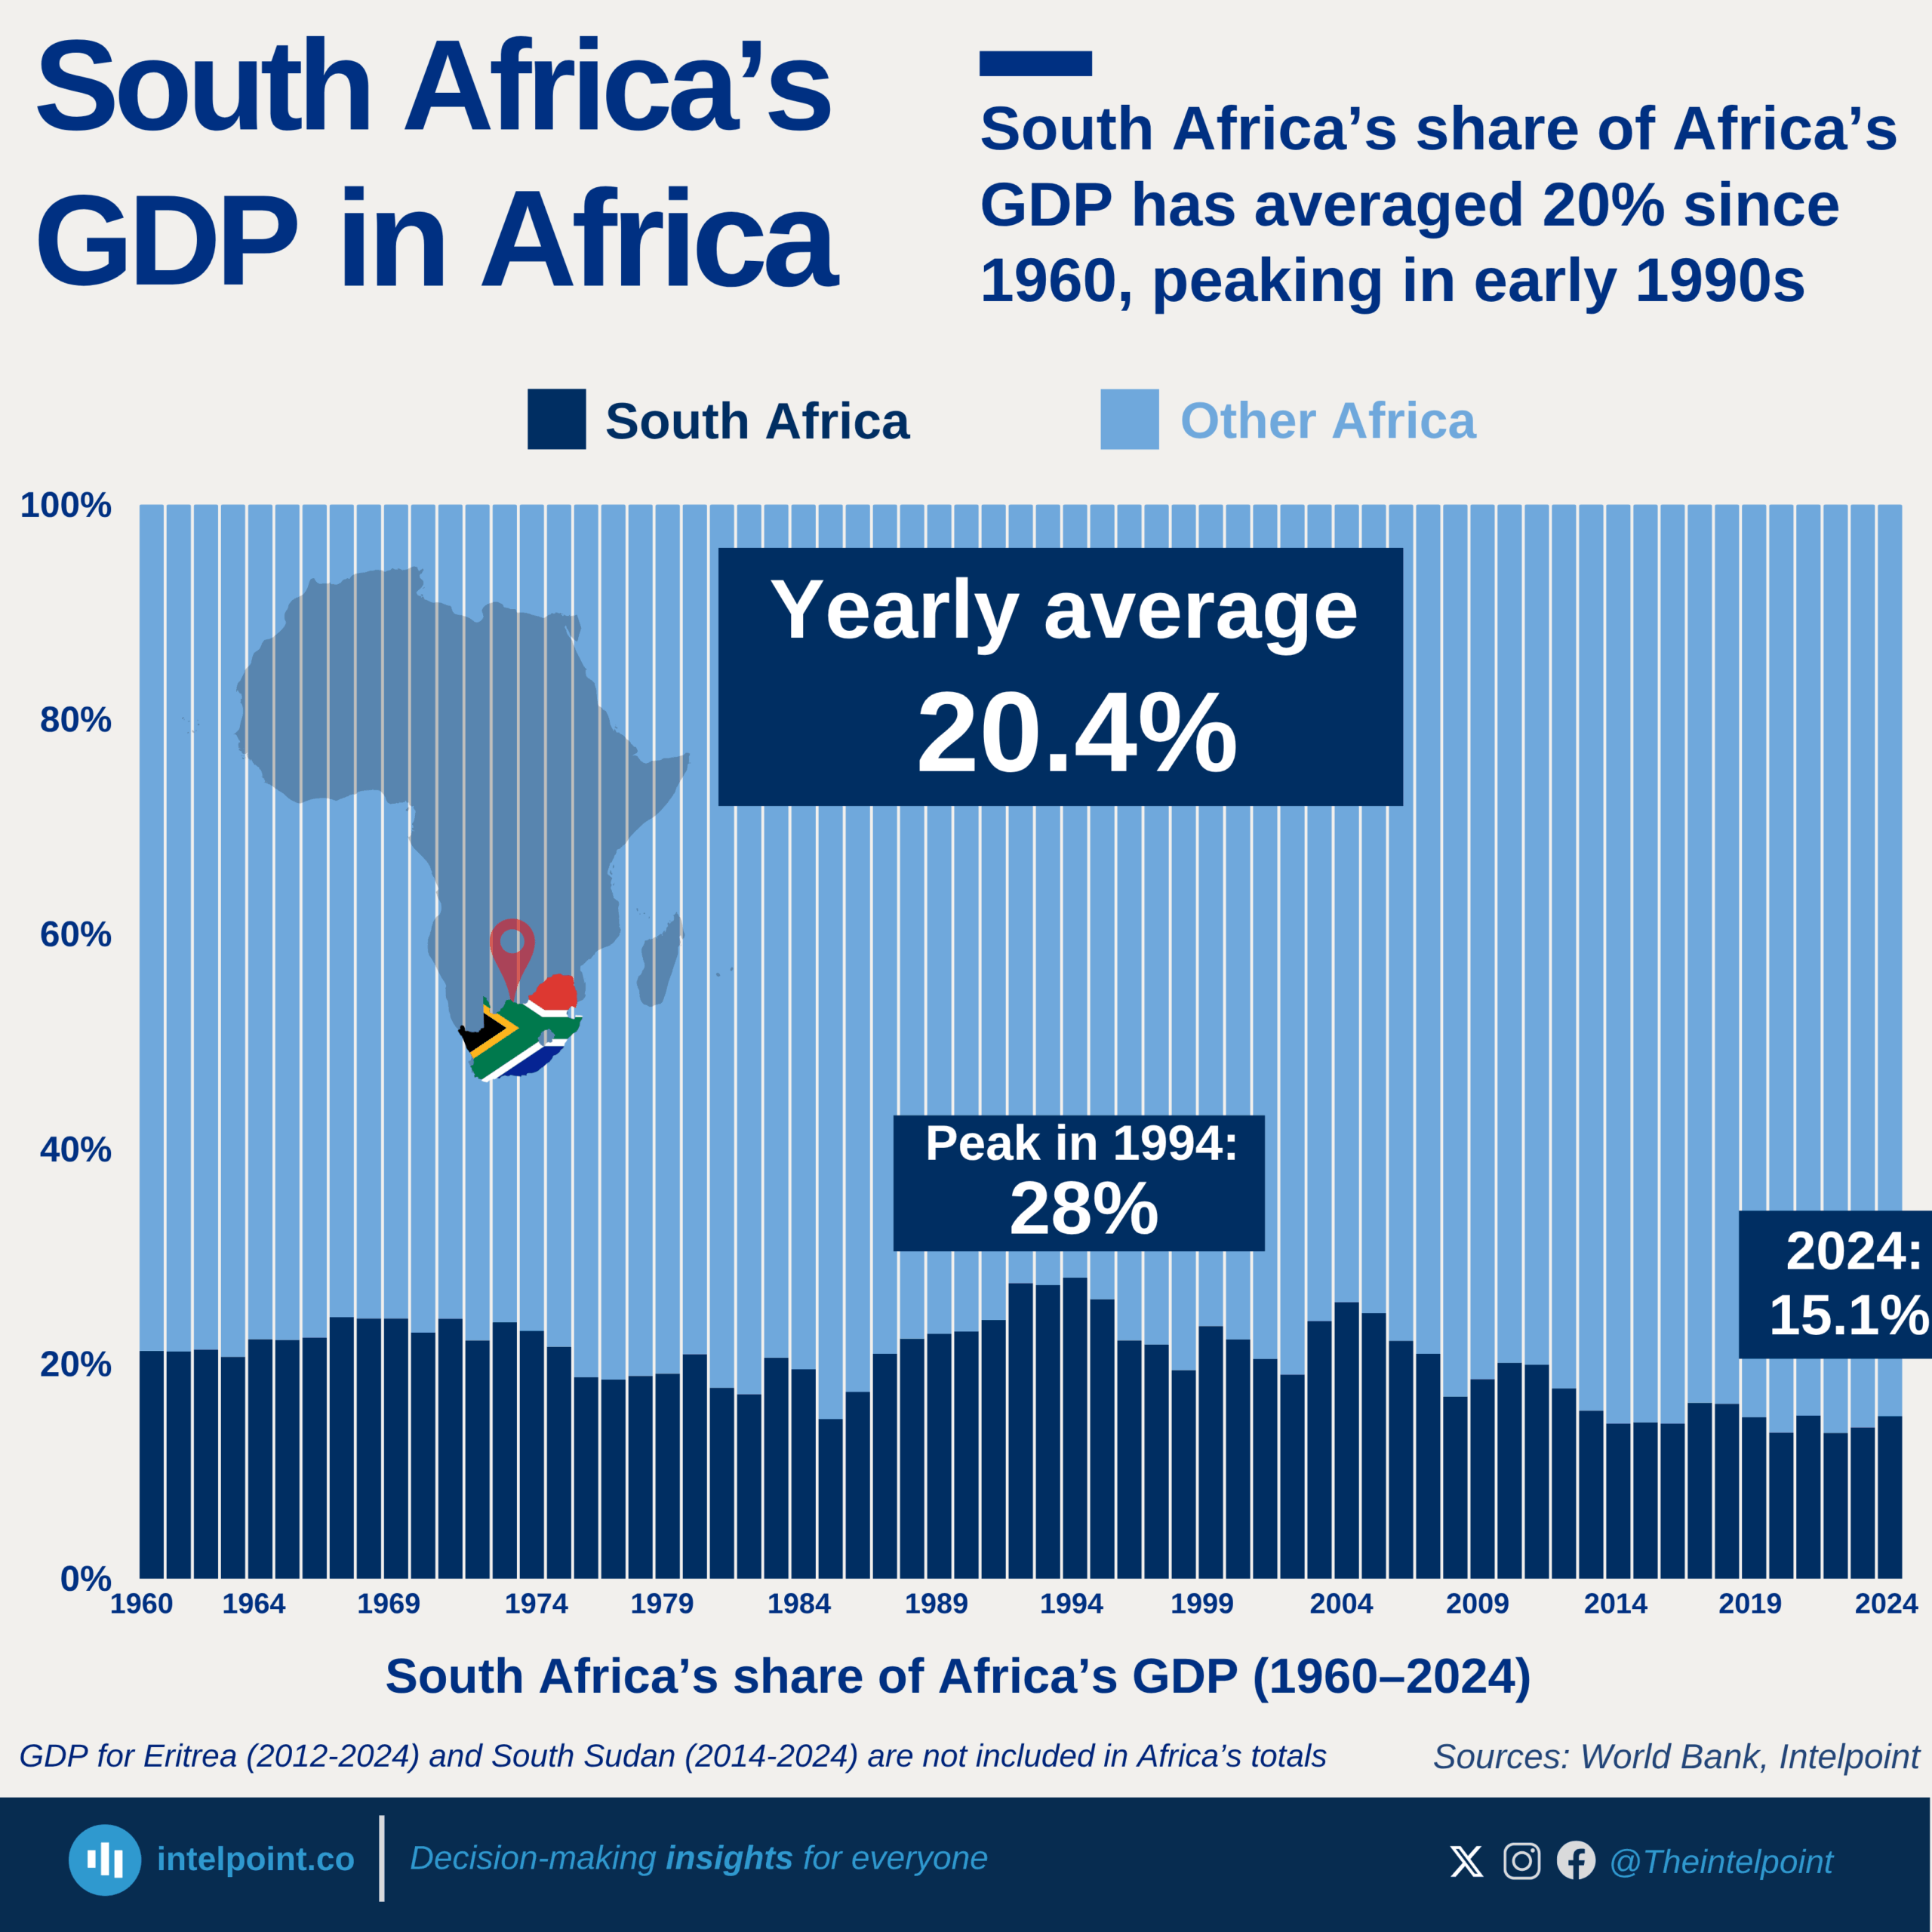
South Africa’s share of Africa’s GDP has averaged 20% since 1960, peaking in early 1990s
  • South Africa’s share of Africa’s GDP has averaged around 20% since 1960.
  • The country’s relative dominance peaked in the early 1990s at nearly 28% of continental GDP.
  • Nominal GDP grew steadily from $8.7 billion in 1960 to over $400 billion in 2024.
  • South Africa’s share of Africa’s GDP has generally declined in recent decades as other African economies expanded faster.
  • Despite the relative decline, South Africa remains one of Africa’s largest and most influential economies.

POPULAR TOPICS
SIGN UP TO OUR NEWSLETTER
Get periodic updates about the African startup space, access to our reports, among others.
Subscribe Here
Subscription Form

A product of Techpoint Africa. All rights reserved