After the 2020 crash, US-Nigeria trade value climbed to $10B+ in 2024

Key Takeaways: 

  • The US' trade deficit with Nigeria narrowed significantly, shifting from a $5.14 billion deficit in 2017 to a $1.69 billion surplus in 2024.
  • US goods exports to Nigeria reached $4.2 billion in 2024, representing a 92% increase from the $2.2 billion recorded in 2017.
  • US goods imports from Nigeria totalled $5.9 billion in 2024, a 20% decrease from the $7.3 billion recorded in 2017.
  • The COVID-19 pandemic severely disrupted bilateral trade in 2020, but both imports and exports began recovering steadily from 2021 onwards.
  • By 2024, trade had rebounded substantially, with US imports from Nigeria reaching $5.87 billion and exports to Nigeria reaching $4.17 billion.
  • Despite experiencing persistent trade deficits from 2017 through most of the period, the US achieved trade surpluses with Nigeria in 2020 and 2021.
  • Total goods trade between the US and Nigeria ranged from $4 billion to approximately $10 billion.

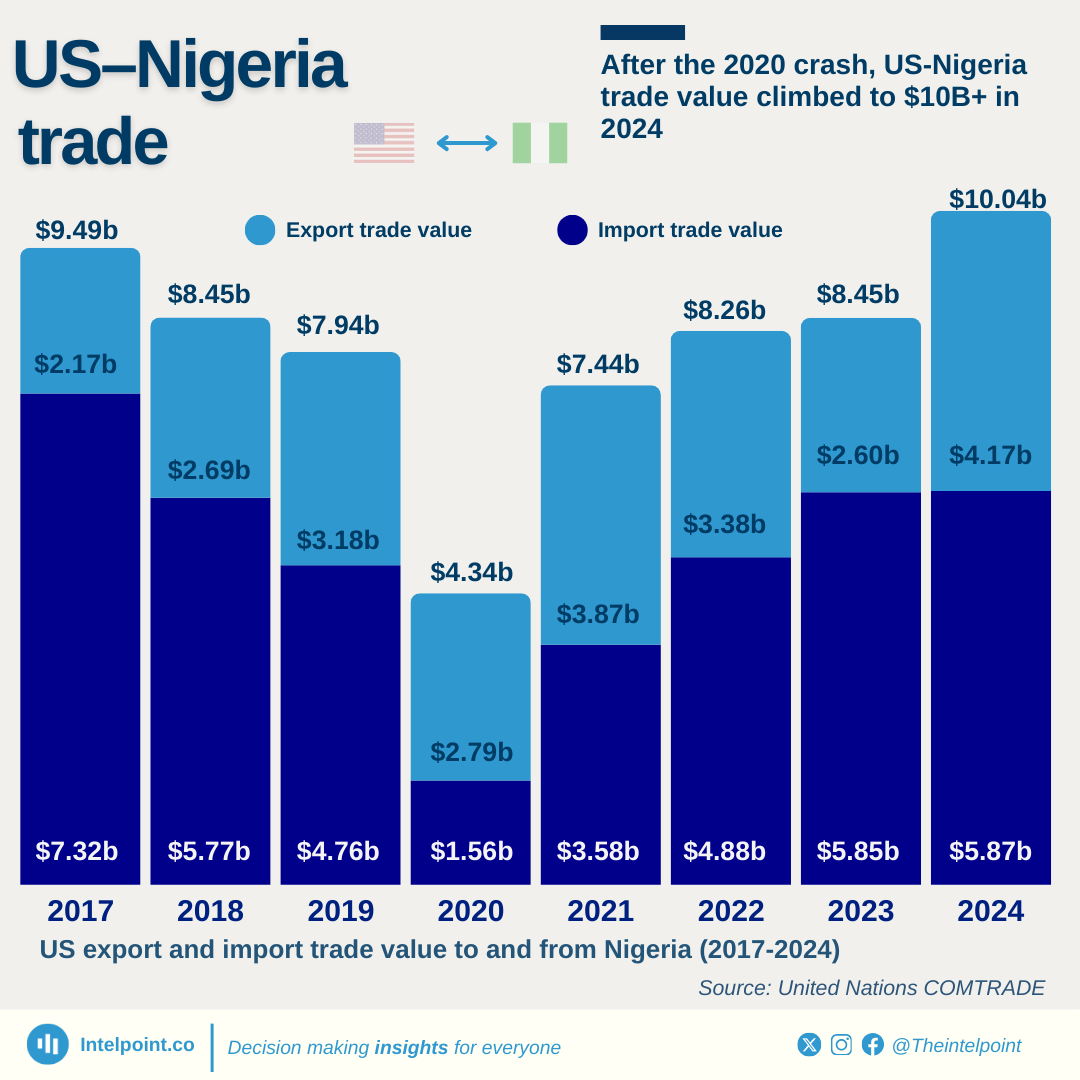
Between 2017 and 2024, US–Nigeria trade relations underwent notable changes shaped by global economic shifts, most prominently the COVID-19 pandemic. In 2017, the US' imports from Nigeria stood at a peak of $7.3 billion but plummeted to just $1.55 billion by 2020 due to pandemic-related disruptions.

The US' imports from Nigeria have steadily increased, reaching $5.87 billion by 2024. Simultaneously, its exports to Nigeria have demonstrated exceptional resilience and growth, expanding from $2.17 billion in 2017 to $4.17 billion in 2024.

Overall, total goods trade between the two nations ranged from $4 billion during the pandemic's peak to nearly $10 billion by 2024. The trade balance has shifted dramatically in the United States' favour during this period. The trade balance that began as a substantial $5.14 billion deficit for the US in 2017 narrowed to just $1.7 billion by 2024, with the US even achieving trade surpluses in 2020 and 2021.

Source:

United Nations COMTRADE

Period:

2017-2024
HTML code to embed chart
Want a bespoke report?
Reach out
Tags
Related Insights

Soybeans led the US' agricultural exports with $24.58 billion in 2024, accounting for 14% of the total export value
Key Takeaways:
  • Soybeans topped the US' agricultural exports in 2024, followed by corn and beef.
  • The top 10 agricultural commodities made up 56.6% of the total value of the US' agricultural exports.
  • Plant-based exports (soybeans, corn, tree nuts, soybean meal, wheat) contributed over 34% of the total agricultural export value.
  • The combined value of the top 10 exports exceeded $99.73 billion.
  • Animal proteins (beef, pork, and poultry) together represented 13.9% of total US agricultural exports.

Netherlands dominated with 18.6% of South African citrus exports in 2023, outpacing other countries
  • The Netherlands led with 18.6% of South Africa’s citrus exports in 2023.
  • The U.S. accounted for 5.8% of South Africa’s citrus exports, a small share compared to Europe and UAE.
  • South African citrus exports to the U.S. in 2023 was valued at $141 million.
  • Other markets, like the UK and UAE, played a larger role in South Africa’s citrus trade.
  • Market diversity may reduce the impact of the trending U.S. tariff on South Africa’s overall citrus export.

Djibouti's inflation peaked at 5.18% in 2022, its highest in a decade
  • Djibouti’s inflation reached a peak in 2022, with 5.18%, the highest in the past decade.
  • The lowest inflation rate occurred in 2015, with a negative value of -0.85%.
  • From 2014 to 2023, Djibouti experienced fluctuating inflation, with increases in 2016, 2019, and 2022.
  • Between 2022 and 2023, inflation decreased from 5.18% to 1.50%.
  • The year 2018 saw the lowest inflation among positive rates, with a modest 0.15%.
  • The overall trend shows periodic inflation spikes, particularly in 2016, 2019, and 2022, while other years maintained relatively stable or lower inflation.

88% of Nigeria's 2024 exports came from crude oil and co., 5.73% from agriculture
Key Takeaways:
  • Petroleum products (crude oil and other oil products) dominated Nigeria's export landscape in 2024, accounting for 88.26% of total export value.
  • Agricultural exports contributed 5.73% to export value, despite Nigeria's significant agricultural potential.
  • The manufacturing sector made up just 2.95% of the total export value.
  • Nigeria’s total export value reached ₦77.44 trillion in 2024 from ₦35.96 trillion in 2023.
  • Non-oil sectors collectively made up less than 12% of export value.

Crude oil leads Nigeria’s global exports with 68.87% share, while refined petroleum products (motor spirit, gas oil) top its imports at over 27%
Key Takeaways:
  • Crude oil remains Nigeria’s largest export, while refined petroleum products lead imports.
  • Natural gas ranks as the second-largest export, contributing 9.71% of the total export value.
  • The top five imported products account for 32.28% of Nigeria’s global imports.
  • The top ten exports represent over 95% of Nigeria’s total export value.

In Q4 2024, more than 98% of exports and 90% of imports were transported through maritime
Key Takeaways:
  • Maritime transport dominated Nigeria’s international trade in Q4 2024, accounting for 98.79% of total exports and 90.15% of total imports.
  • Air transport contributed significantly to imports (9.03%) but played a minimal role in exports (0.64%).
  • Road and other transport modes made negligible contributions to both imports and exports.
  • Total trade across all transport modes reached ₦36.6 trillion, resulting in a positive trade balance.

POPULAR TOPICS
SIGN UP TO OUR NEWSLETTER
Get periodic updates about the African startup space, access to our reports, among others.
Subscribe Here
Subscription Form

A product of Techpoint Africa. All rights reserved