46 African countries get more than 60% of their export earnings from raw goods, with South Sudan leading with 99.5%

  • More than 60% of the countries in Africa are commodity-dependent.
  • South Sudan leads the list with 99.5%.
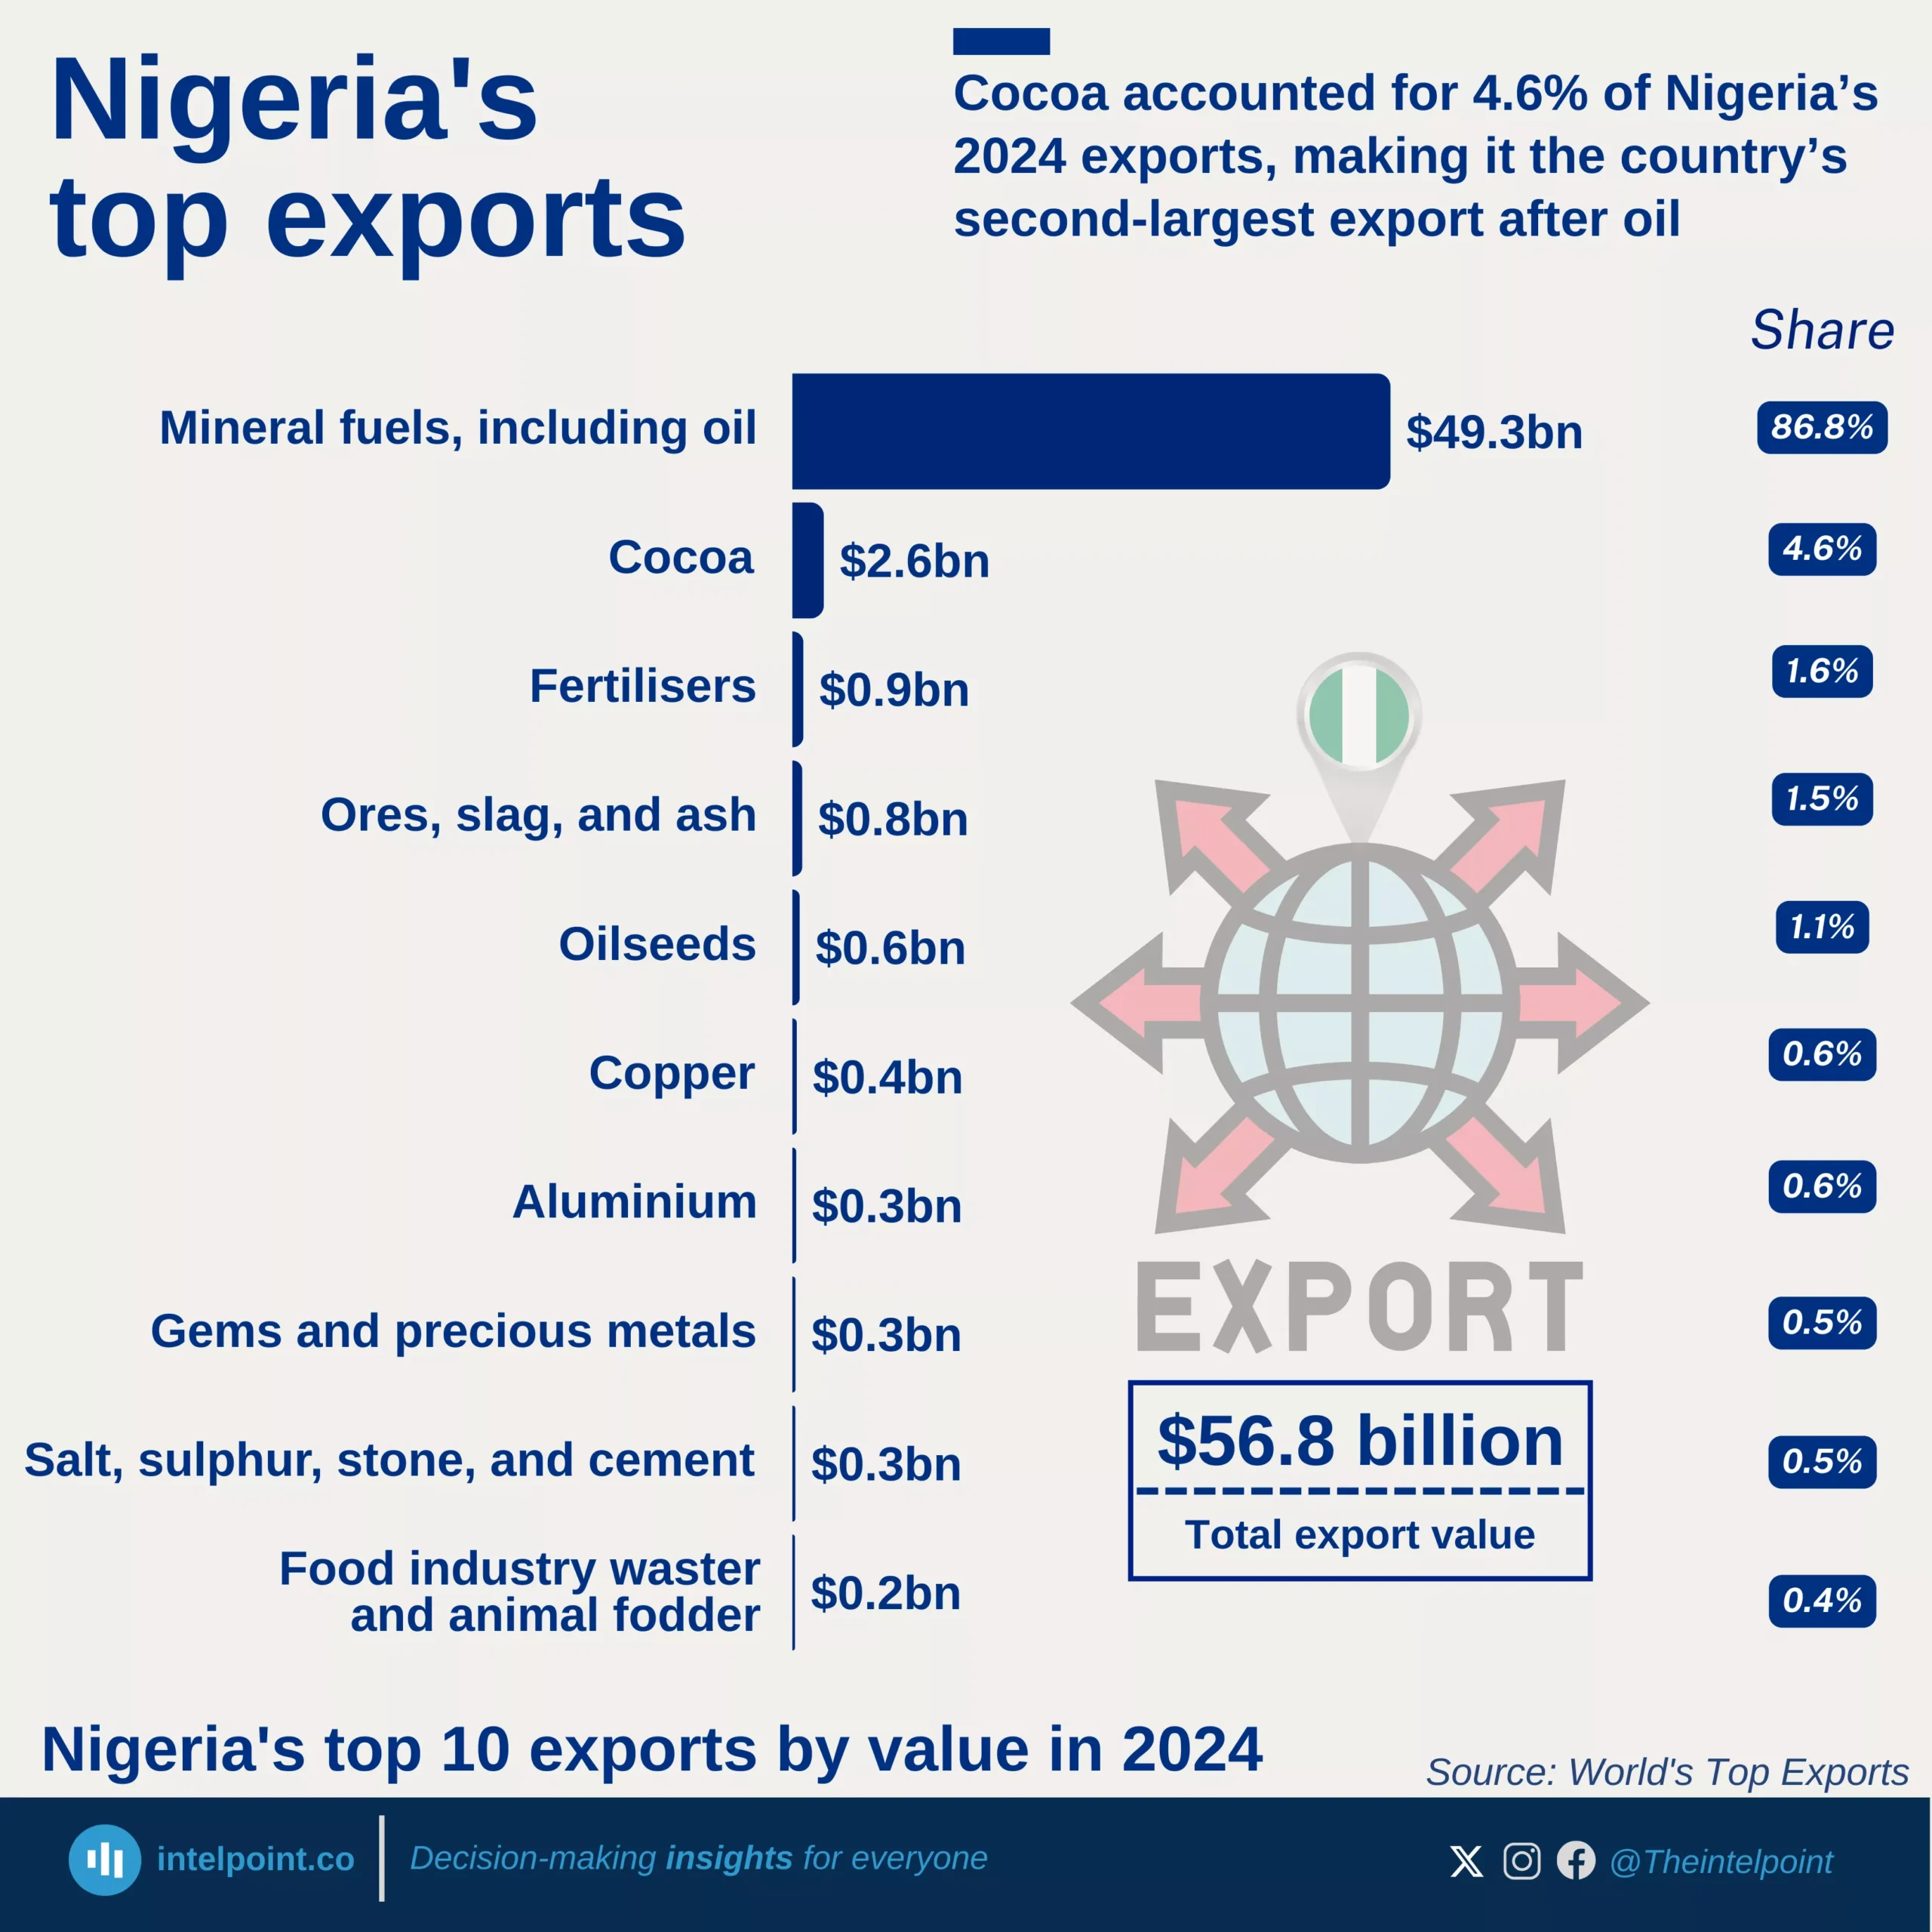
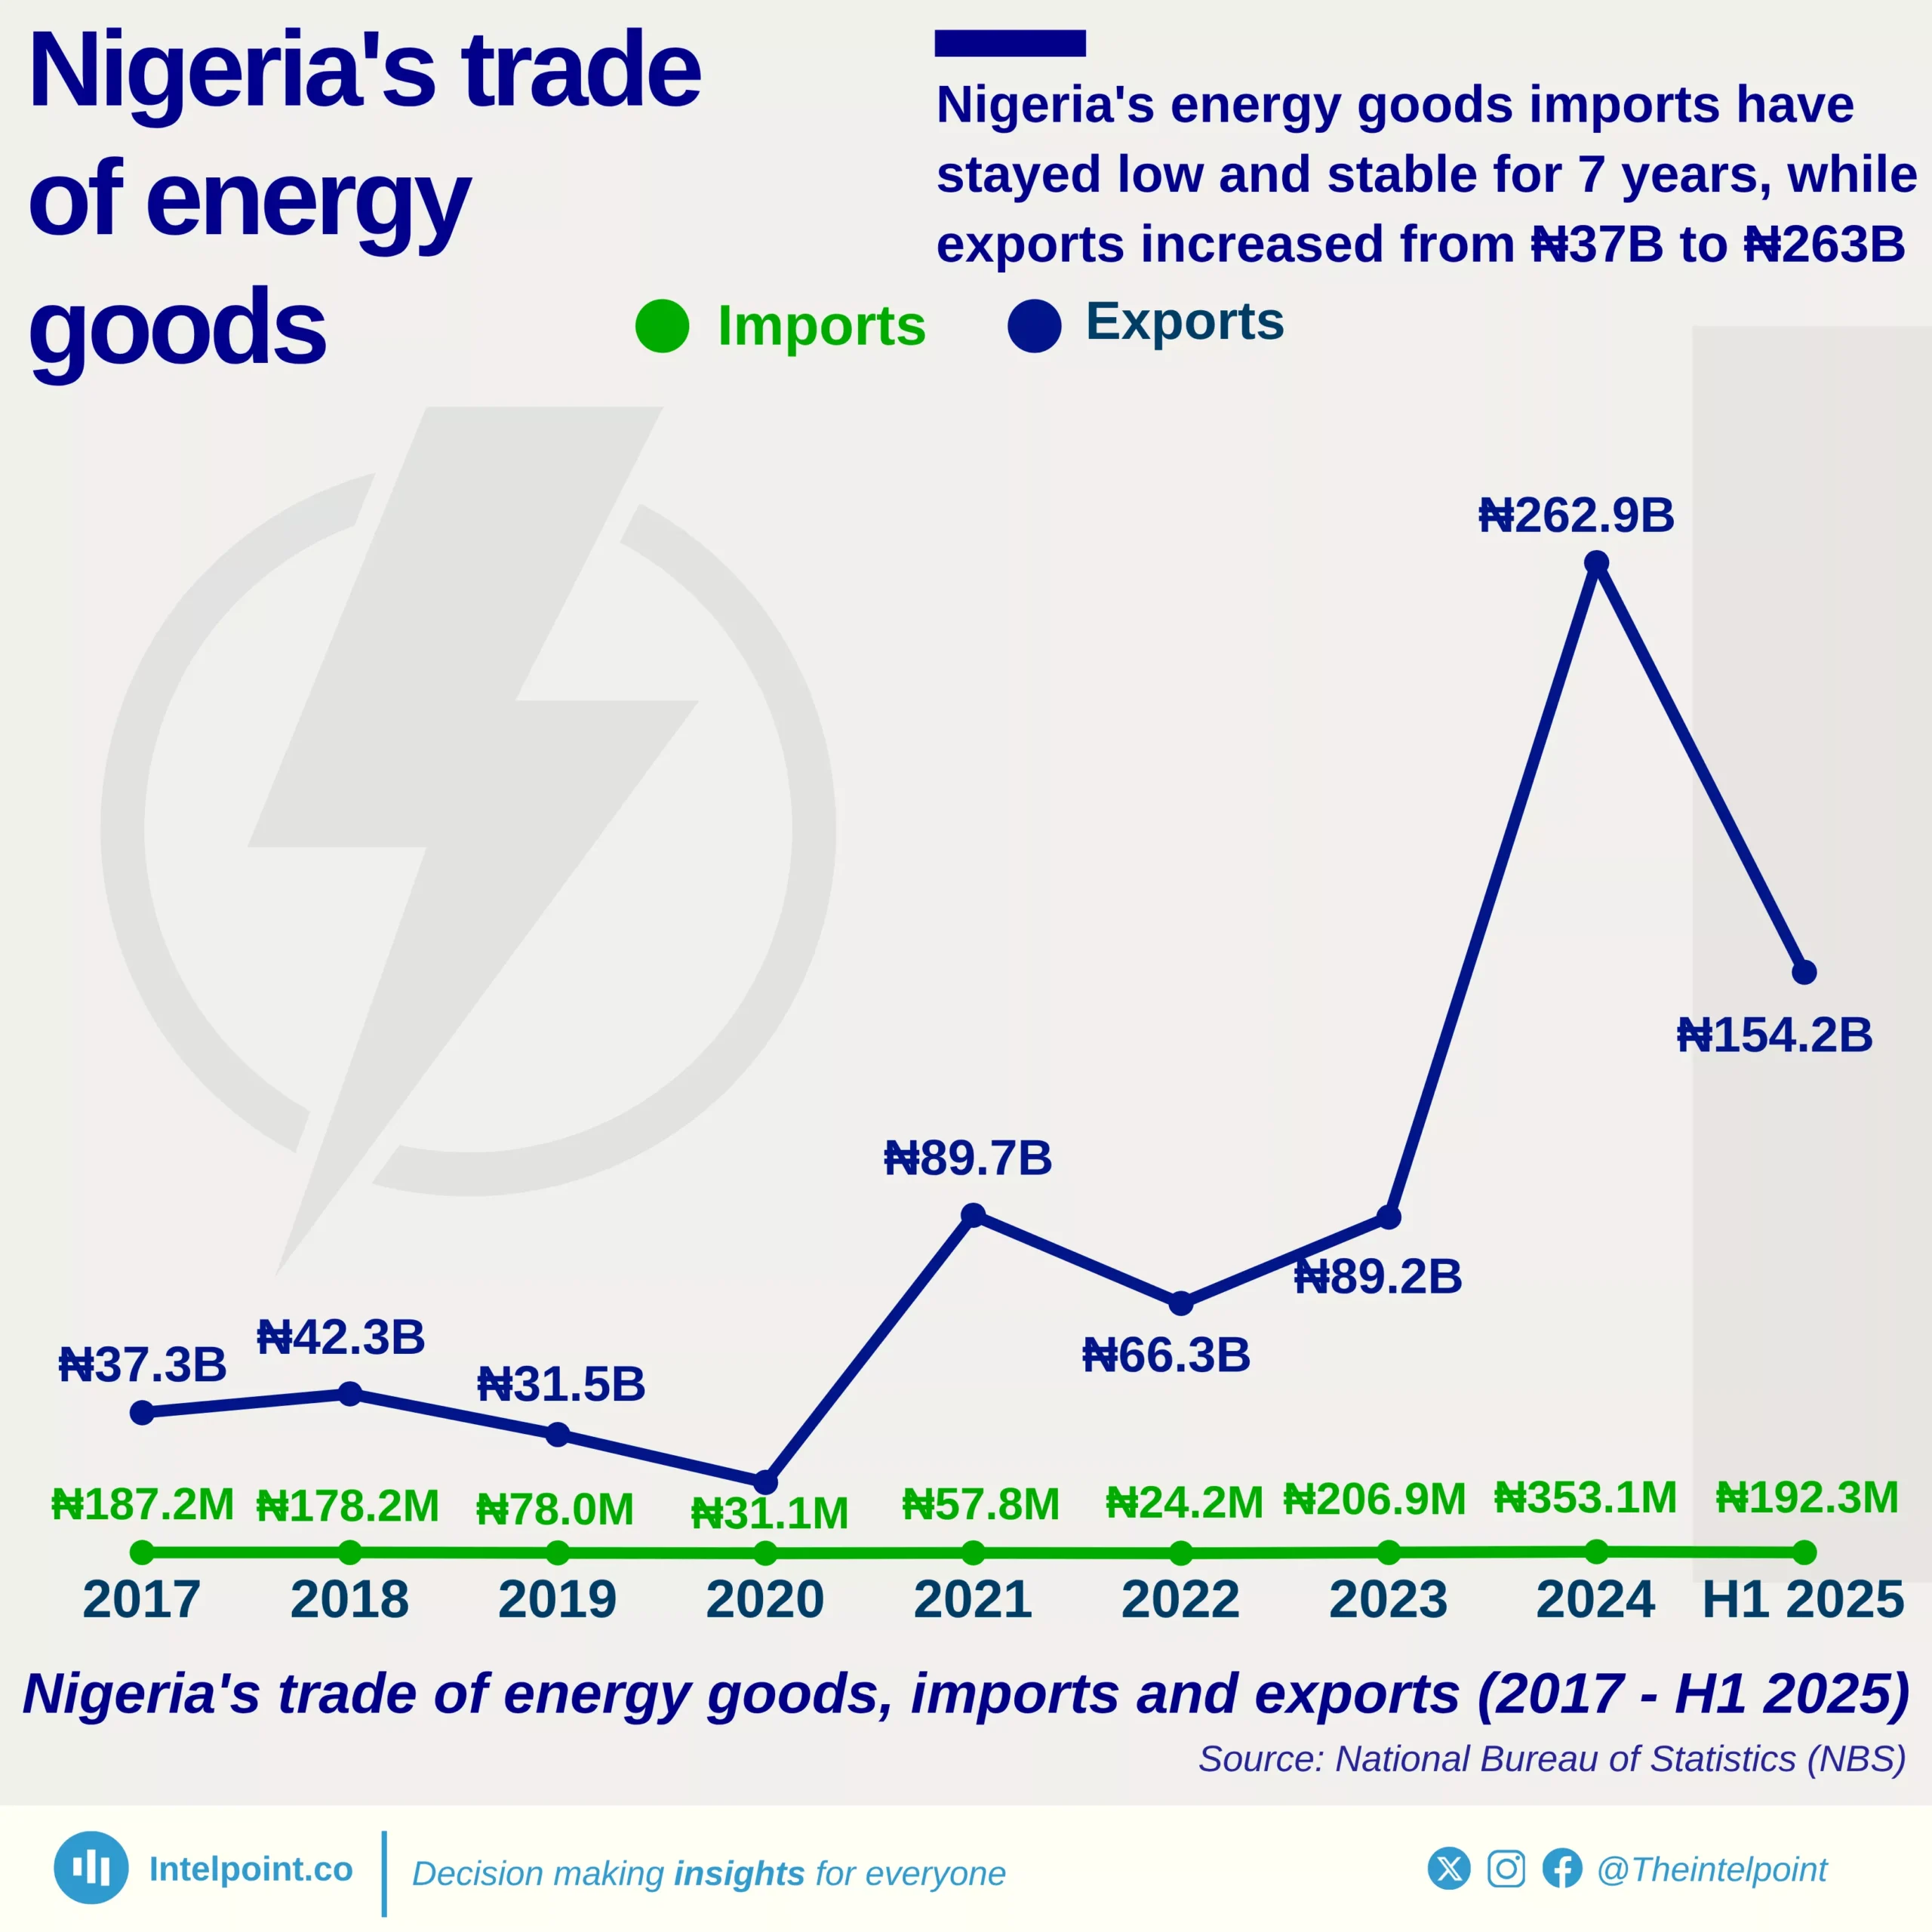
  • Nigeria’s commodity export dependence is 96.3%, dominated by energy (89.7%), followed by agriculture (4.0%) and mining (2.6%).
  • Africa alone accounts for nearly 47% of all commodity dependent countries globally.

According to UNCTAD, a country is classified as commodity-dependent if over 60% of its merchandise exports come from commodities such as energy, agriculture, or mining. Over 60% of the countries in Africa are commodity-dependent, underscoring the prevalence of reliance on primary exports.

Notably, South Sudan leads the list, with 99.5% of its export revenues derived from commodities, primarily oil (energy/oil - 89.9%, agriculture - 4.6%, mining - 5.0%). Meanwhile, Nigeria’s commodity export dependence is 96.3%, dominated by energy/oil (89.7%), followed by agriculture (4.0%) and mining (2.6%). With energy exports claiming almost nine‑tenths of Nigeria’s trade earnings, the economy remains highly vulnerable to oil price swings. Nigeria’s limited export diversification reflects deep structural challenges, including insufficient value addition in agriculture and mining.

Africa alone accounts for nearly 47% of all commodity-dependent countries globally, highlighting the disproportionate burden borne by the continent. This entrenched dependence undermines resilience, making economies susceptible to external shocks and volatile global markets.

UNCTAD emphasises that value addition and processing raw materials domestically is key to transforming commodity wealth into sustainable development.
Source:

UN Trade and Development (UNCTAD)

Period:

2021-2023
HTML code to embed chart
Want a bespoke report?
Reach out
Tags
Related Insights

Only 8 African countries get less than 60% of their export earnings from raw goods, with Tunisia leading at 21.5%
  • Of the 54 African countries, 46 earn more than 60% of export revenues from raw goods.
  • Algeria, Morocco, Eswatini, Lesotho, Djibouti, Mauritius, Comoros, and Egypt stand out with less than 60%.
  • Algeria and Morocco are the least dependent, pointing to stronger industrial and trade sectors.
  • Lower dependence means greater economic stability, while high reliance exposes countries to volatile global commodity markets.

Ghana’s exports
  • Gold bullion dominates exports, contributing ¢163.0B (55.3%) of total exports.

  • Petroleum oils follow distantly at ¢52.6B (17.8%).

  • Cocoa (beans, paste, butter) remains a vital sector, collectively worth ¢24.7B (8.4%).

  • Manganese, cashew, tuna, iron/steel, and shea oil are niche contributors, each under 2% of exports.

  • All other products still make up a significant 14.4% (¢42.4B), showing potential for export diversification.

Apapa Port accounted for 71.6% of Nigeria’s total trade value in Q1 2025 and 86.12% of total exports
  • Apapa Port accounted for 71.6% of Nigeria’s total trade value in Q1 2025 and 82.12% of total exports
  • Apapa Port handled ₦25.79 trillion worth of goods in Q1 2025, representing 71.6% of total trade. It remains the country’s primary trade hub, far surpassing all other ports combined.
  •  Apapa alone facilitated ₦17.74 trillion or 86.1% of Nigeria’s total exports, showing a high dependency on a single location for outbound goods.
  • Tin Can Island is the only meaningful secondary hub With ₦3.44 trillion (9.5%) in total trade, ranking a distant second. It’s the only other port contributing more than ₦1 trillion each to imports and exports.
  • Lekki has limited export impact, despite handling ₦1.70 trillion in imports. Lekki contributed only ₦0.30 trillion (1.5%) in exports, indicating underutilization for outbound trade.
  • Murtala Muhammed International Airport processed just ₦647.91 billion (1.8%) of total trade, reinforcing that Nigeria’s international trade remains heavily maritime-focused.

Nigeria’s foreign trade
  • Total Trade Volume in Q1 2025 stood at ₦36.02 trillion, with exports totalling ₦20.6 trillion and imports at ₦15.4 trillion, resulting in a surplus of ₦5.17 trillion.
  • Crude oil dominates Nigeria’s export trade, accounting for the largest share of export revenue. -
  • Other petroleum oil products are also a major export item, reflecting the significance of both raw and refined oil-based commodities in Nigeria’s trade portfolio. -
  • On the import side, manufactured goods dominate, showing Nigeria’s continued reliance on foreign machinery, technology, and consumer goods.
  • While Nigeria exports mostly raw and oil-based products, it imports refined, processed, or industrial goods, indicating a structural trade gap and limited local industrial capacity. -
  • Agricultural and raw material goods feature on both sides of trade, but their value is significantly less than petroleum-related trade.

China topped Nigeria’s import sources with ₦4.66 trillion, while India led the export destinations with ₦2.84 trillion in Q1 2025
  • India is Nigeria’s largest export destination Nigeria exported ₦2.84 trillion worth of goods to India in Q1 2025, driven largely by crude oil.
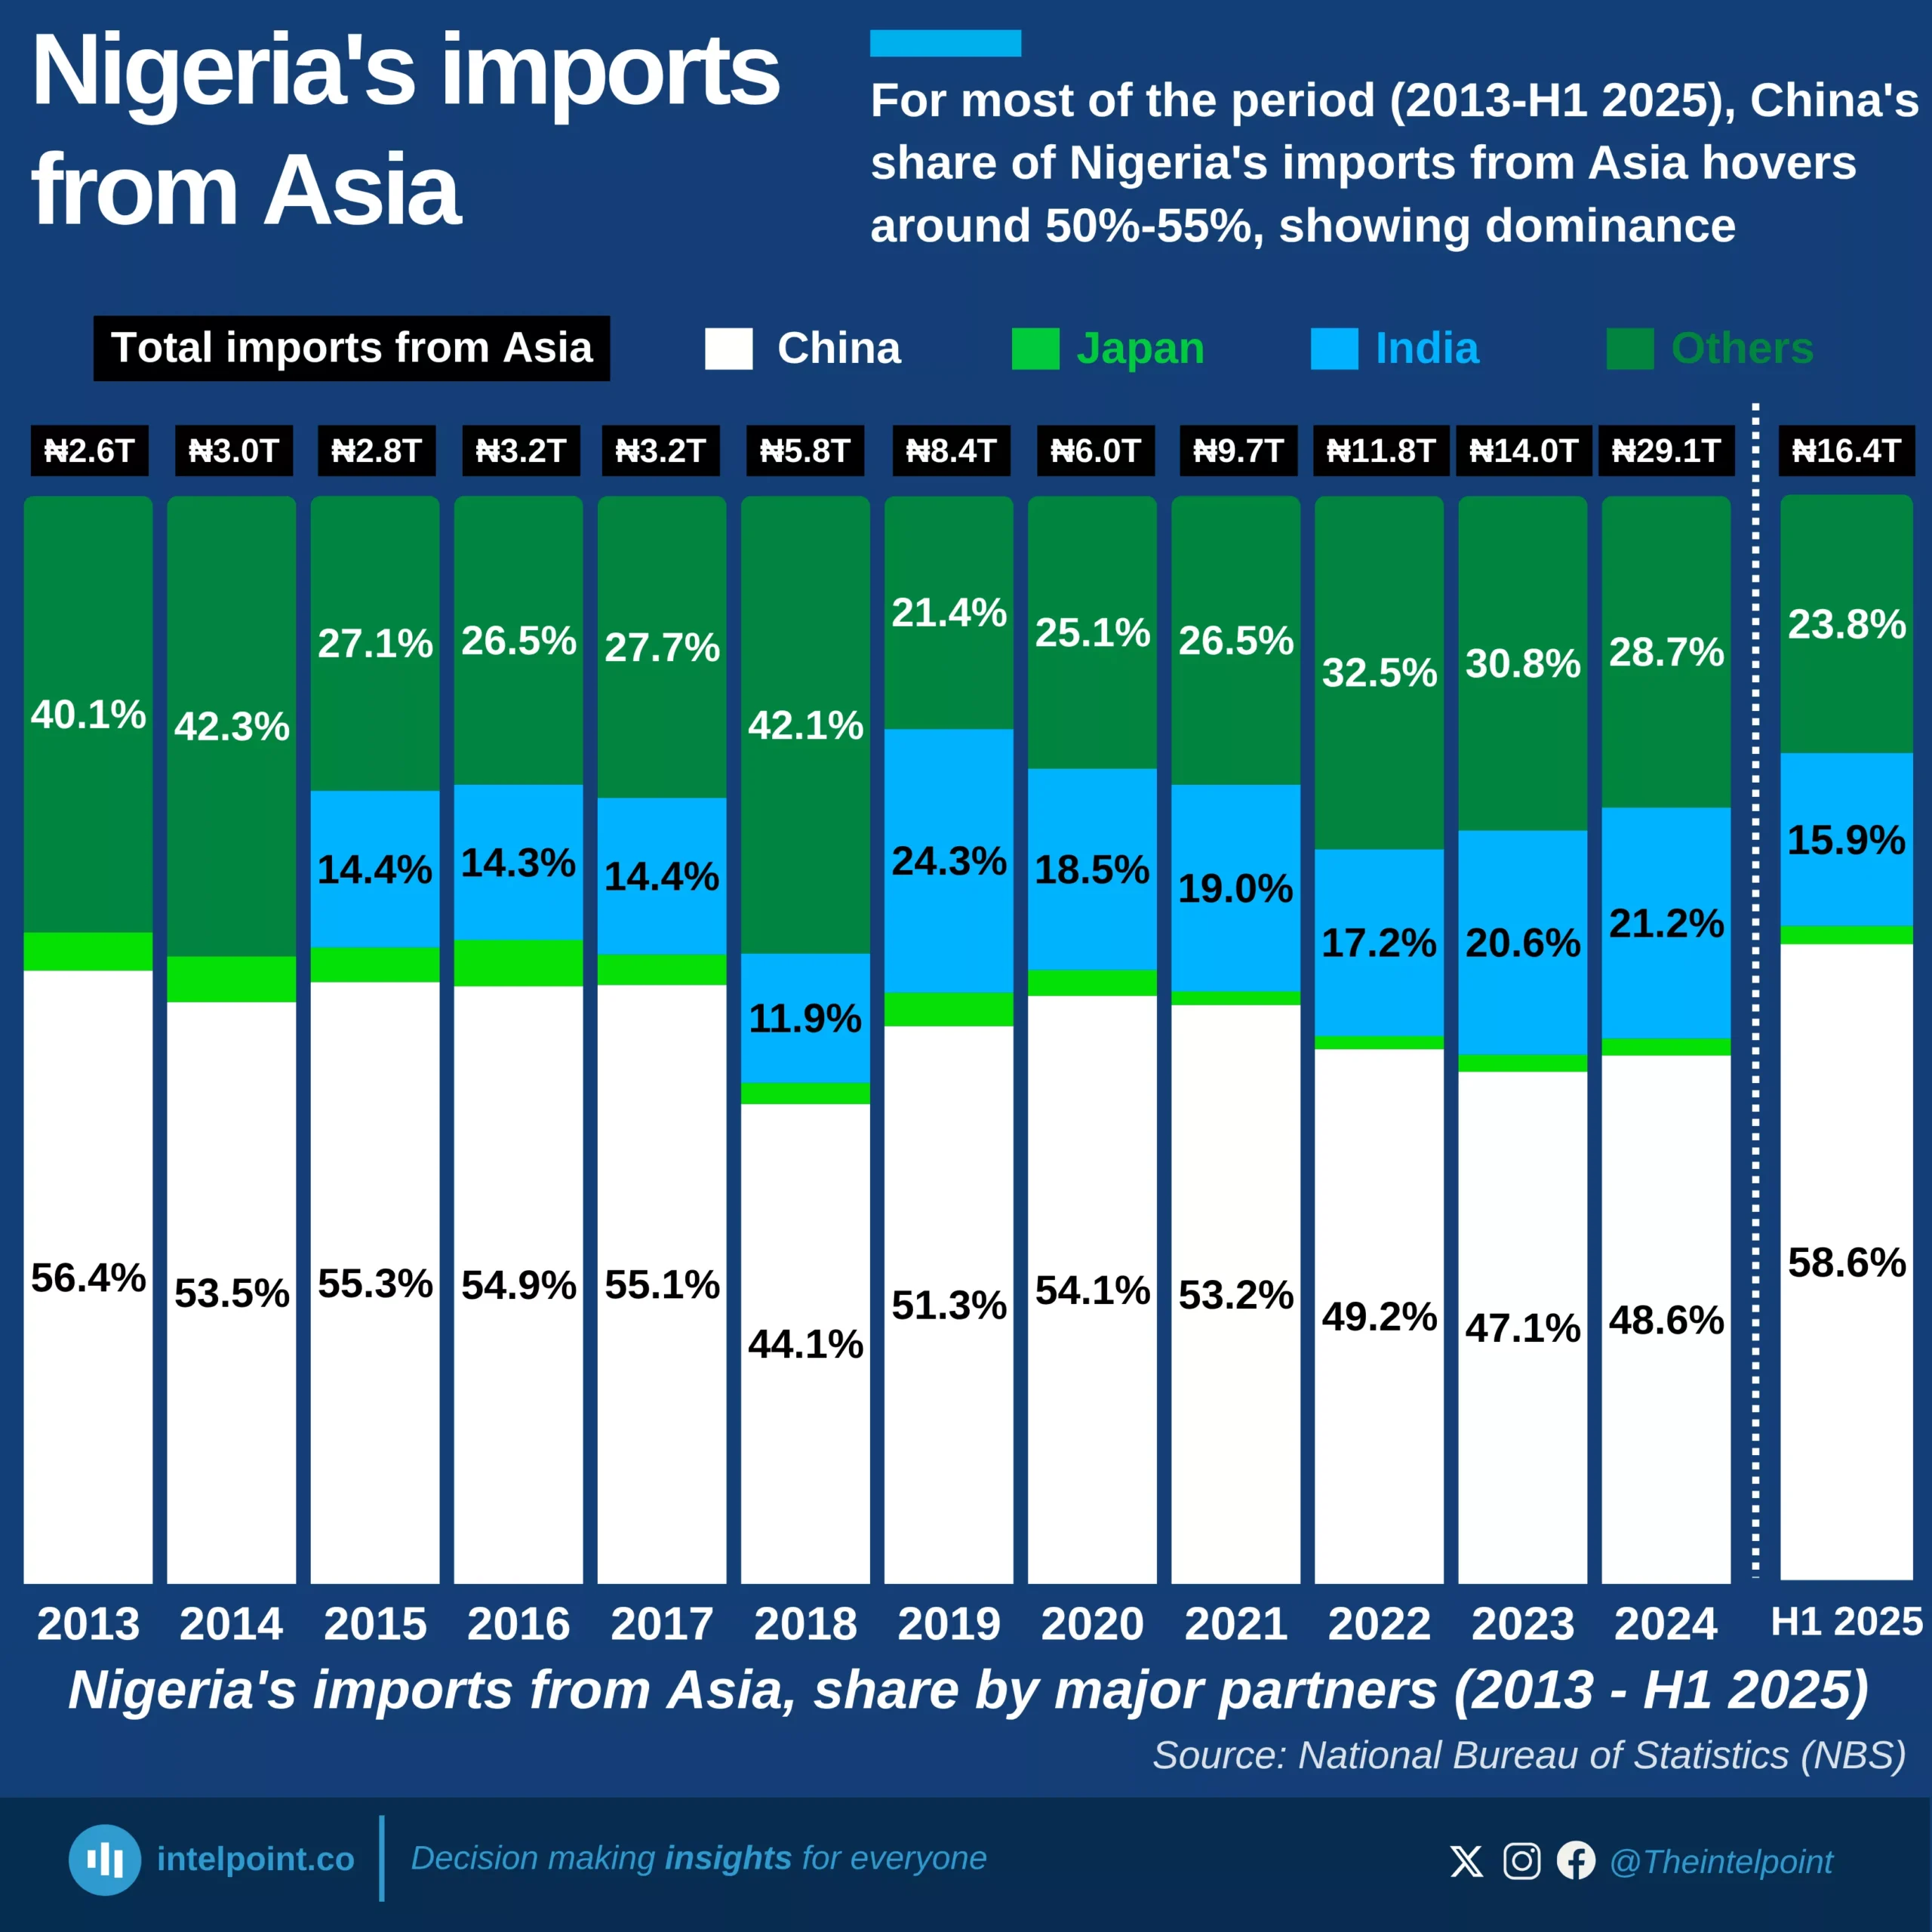
  • China dominates imports into Nigeria China supplied ₦4.66 trillion worth of goods, far outpacing all other countries. Likely dominated by electronics, machinery, and manufactured goods.
  • The United States appears on both sides. Nigeria exports ₦1.54 trillion to the US and imports ₦1.42 trillion, showing a relatively balanced trade relationship.
  • European countries are major export Partners Netherlands (₦2.30T), France (₦1.44T), and Spain (₦1.44T) are prominent export destinations, indicating strong demand for Nigerian crude oil and other commodities in Europe.
  • UAE barely makes the import list. The UAE closes out the top import list at ₦0.61 trillion, showing relatively lower trade volume compared to others, but still significant enough to be in the top 5.

Cocoa led Nigeria’s agricultural exports by value in Q1 2025, with over ₦1.2B
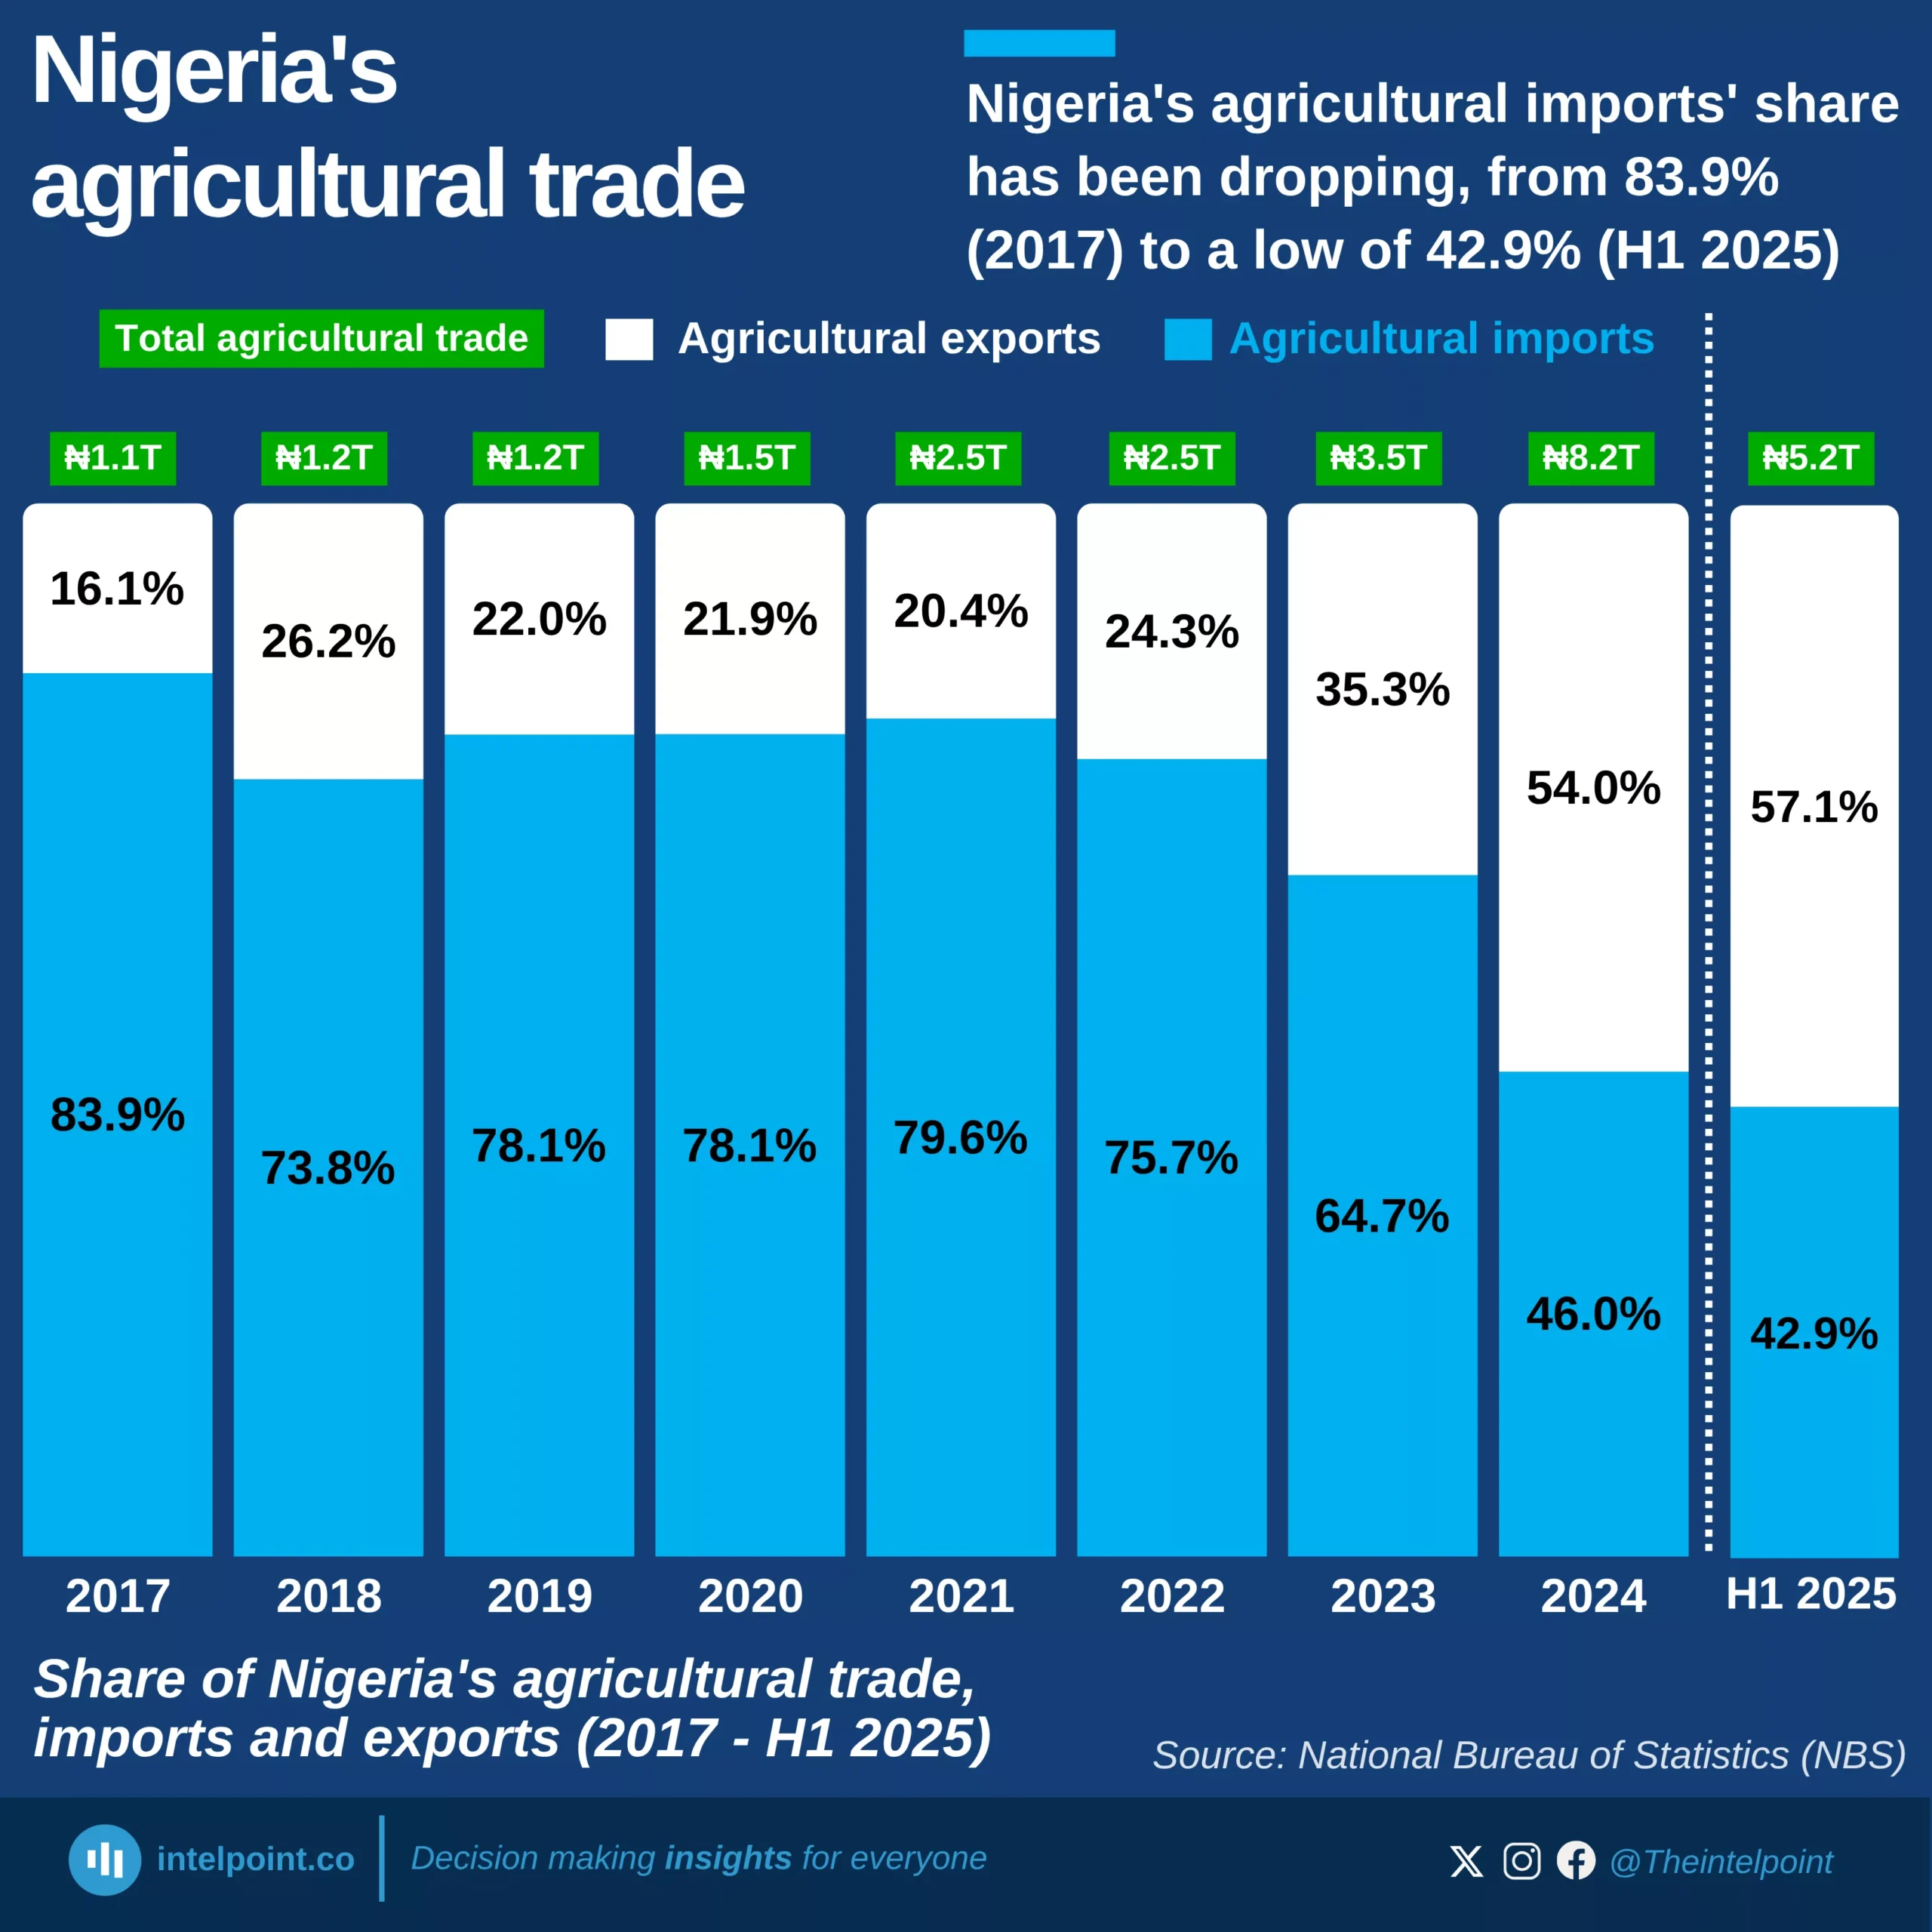
  • The value of agricultural goods exported in Q1 2025 rose to ₦1.70 trillion, up 64.65% year-on-year and 10.63% quarter-on-quarter, highlighting continued growth in the sector.
  • Standard and superior cocoa beans led the chart, contributing a combined ₦1.23 trillion, with major buyers being The Netherlands (₦344.17B) and Belgium (₦203.17B).
  • Cashew nuts in shell earned ₦157.63B, mostly exported to India (₦87.56B) and Vietnam (₦69.74B), while sesamum seeds brought in ₦128.18B.
  • Soya bean flours and ornamental flowers fetched ₦27B and ₦18B respectively, showing Nigeria's export mix is broadening.

POPULAR TOPICS
SIGN UP TO OUR NEWSLETTER
Get periodic updates about the African startup space, access to our reports, among others.
Subscribe Here
Subscription Form

A product of Techpoint Africa. All rights reserved