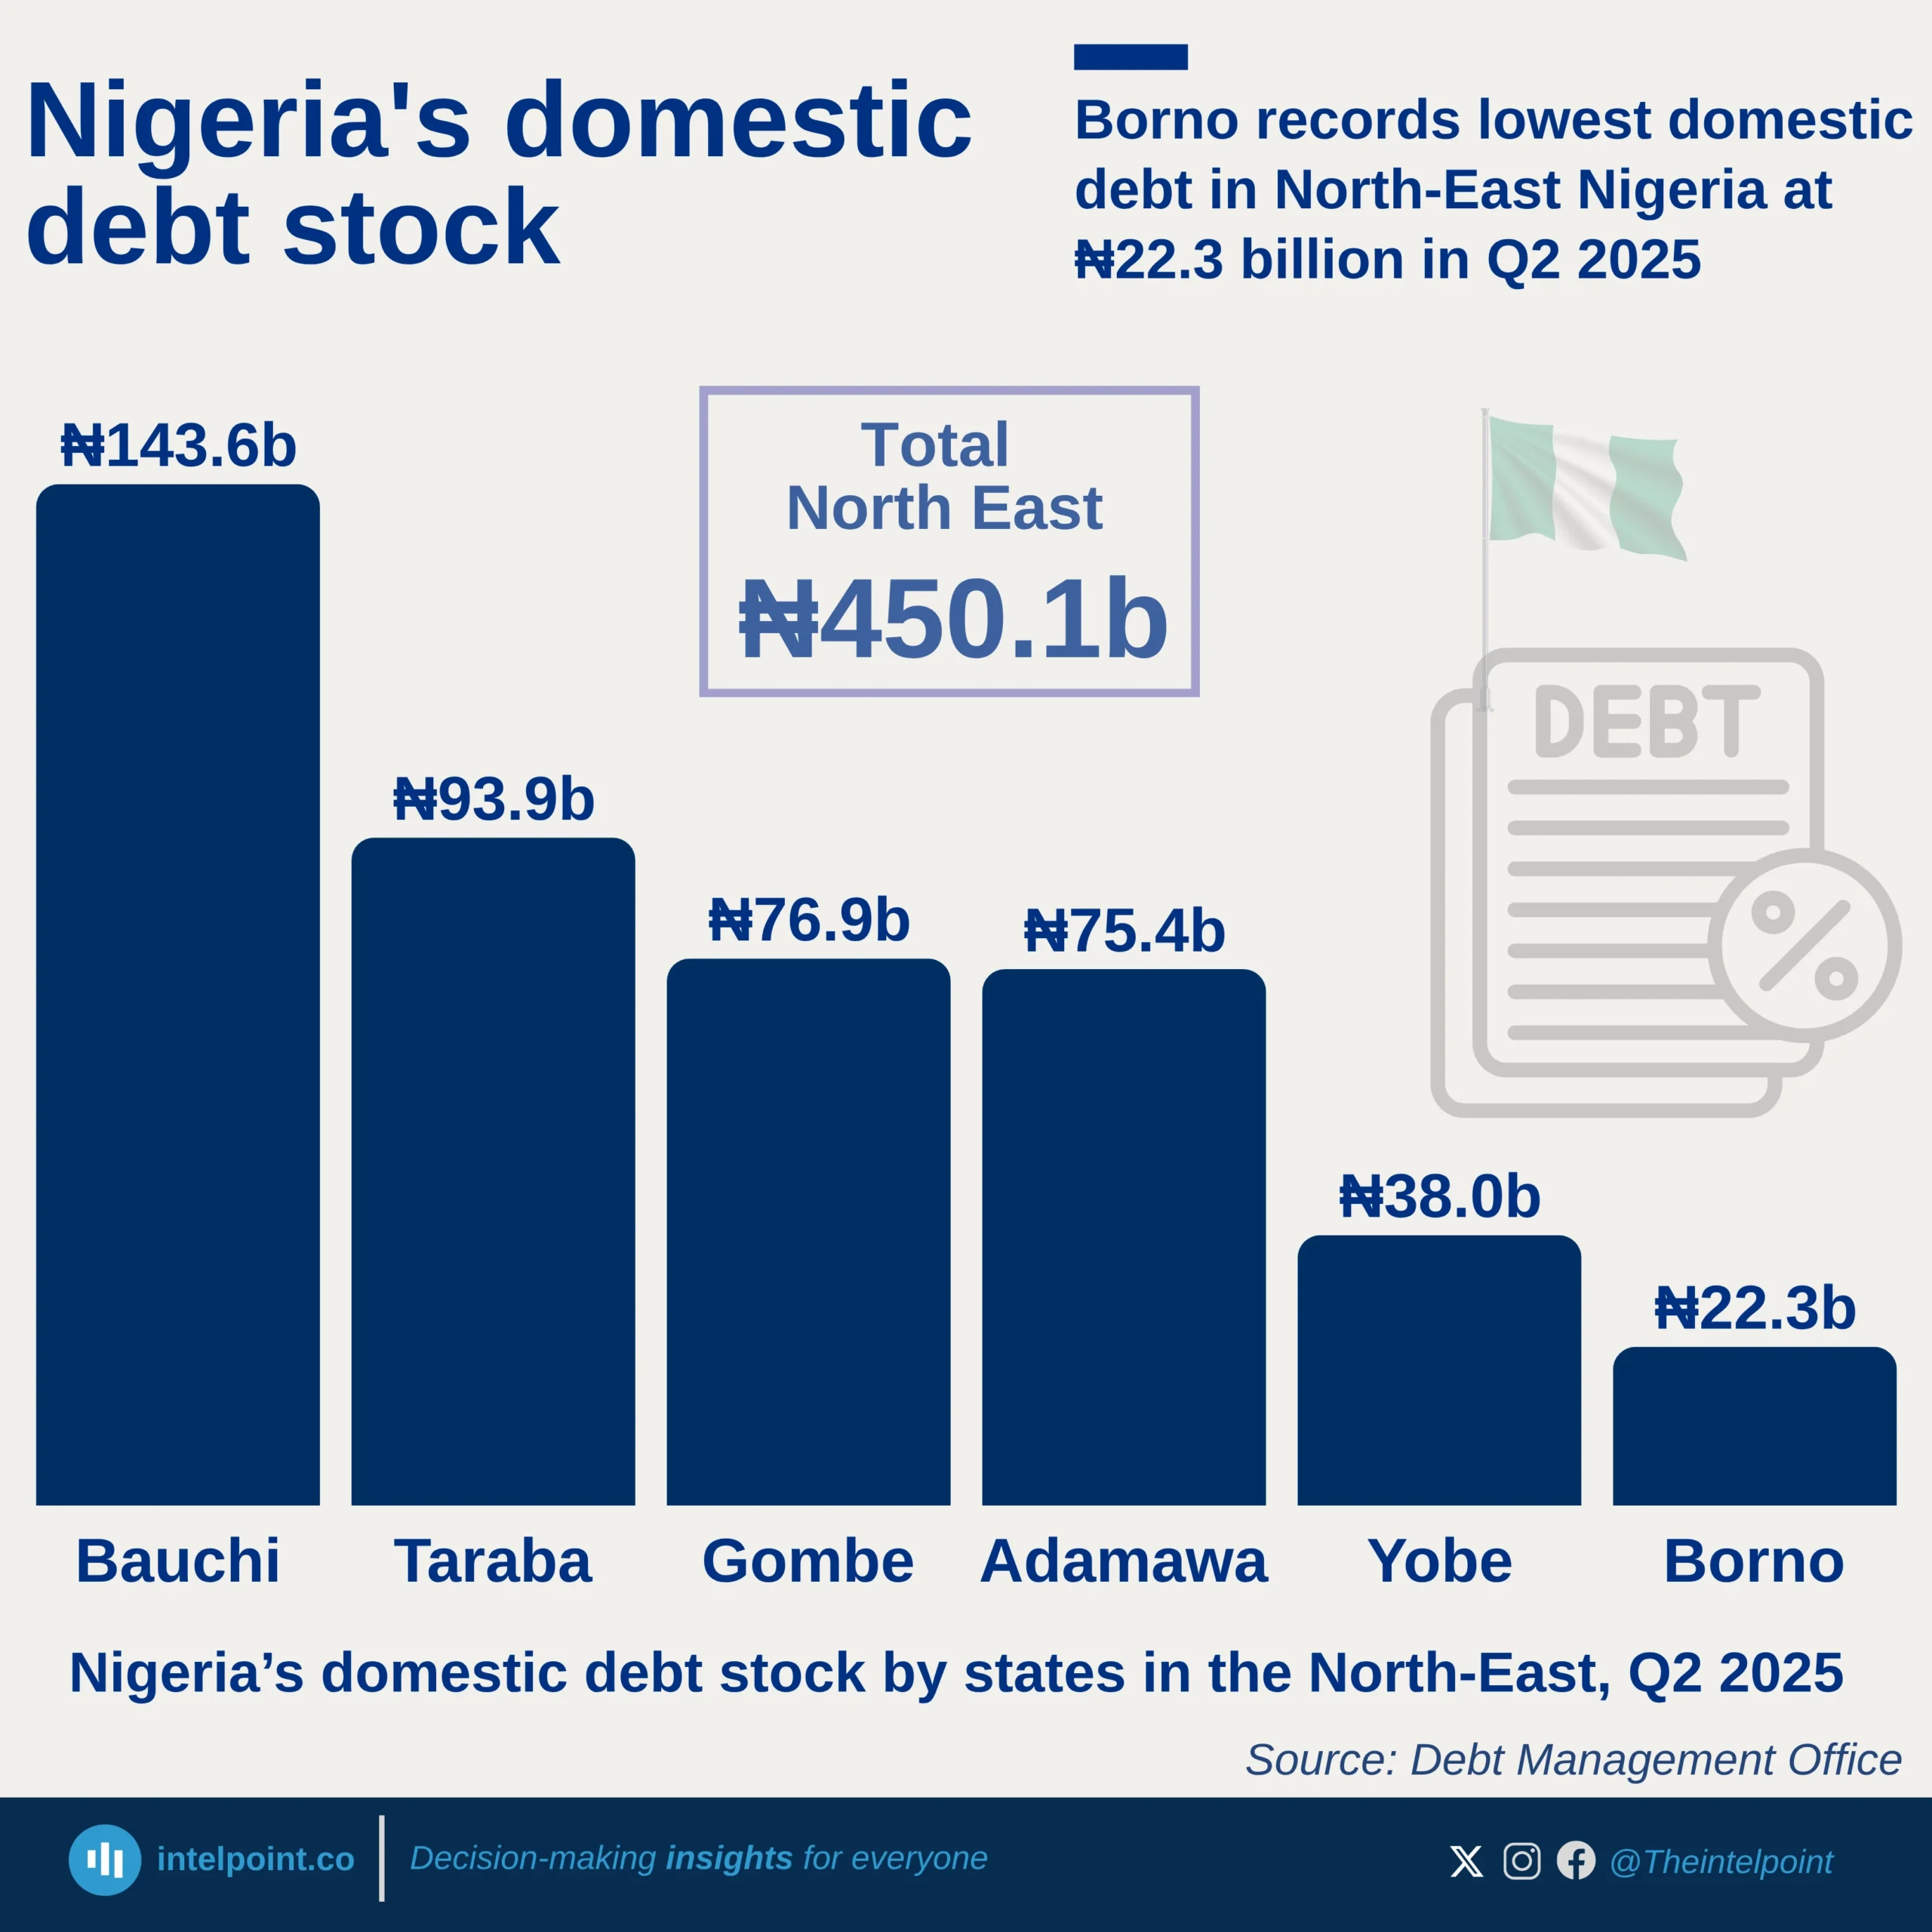
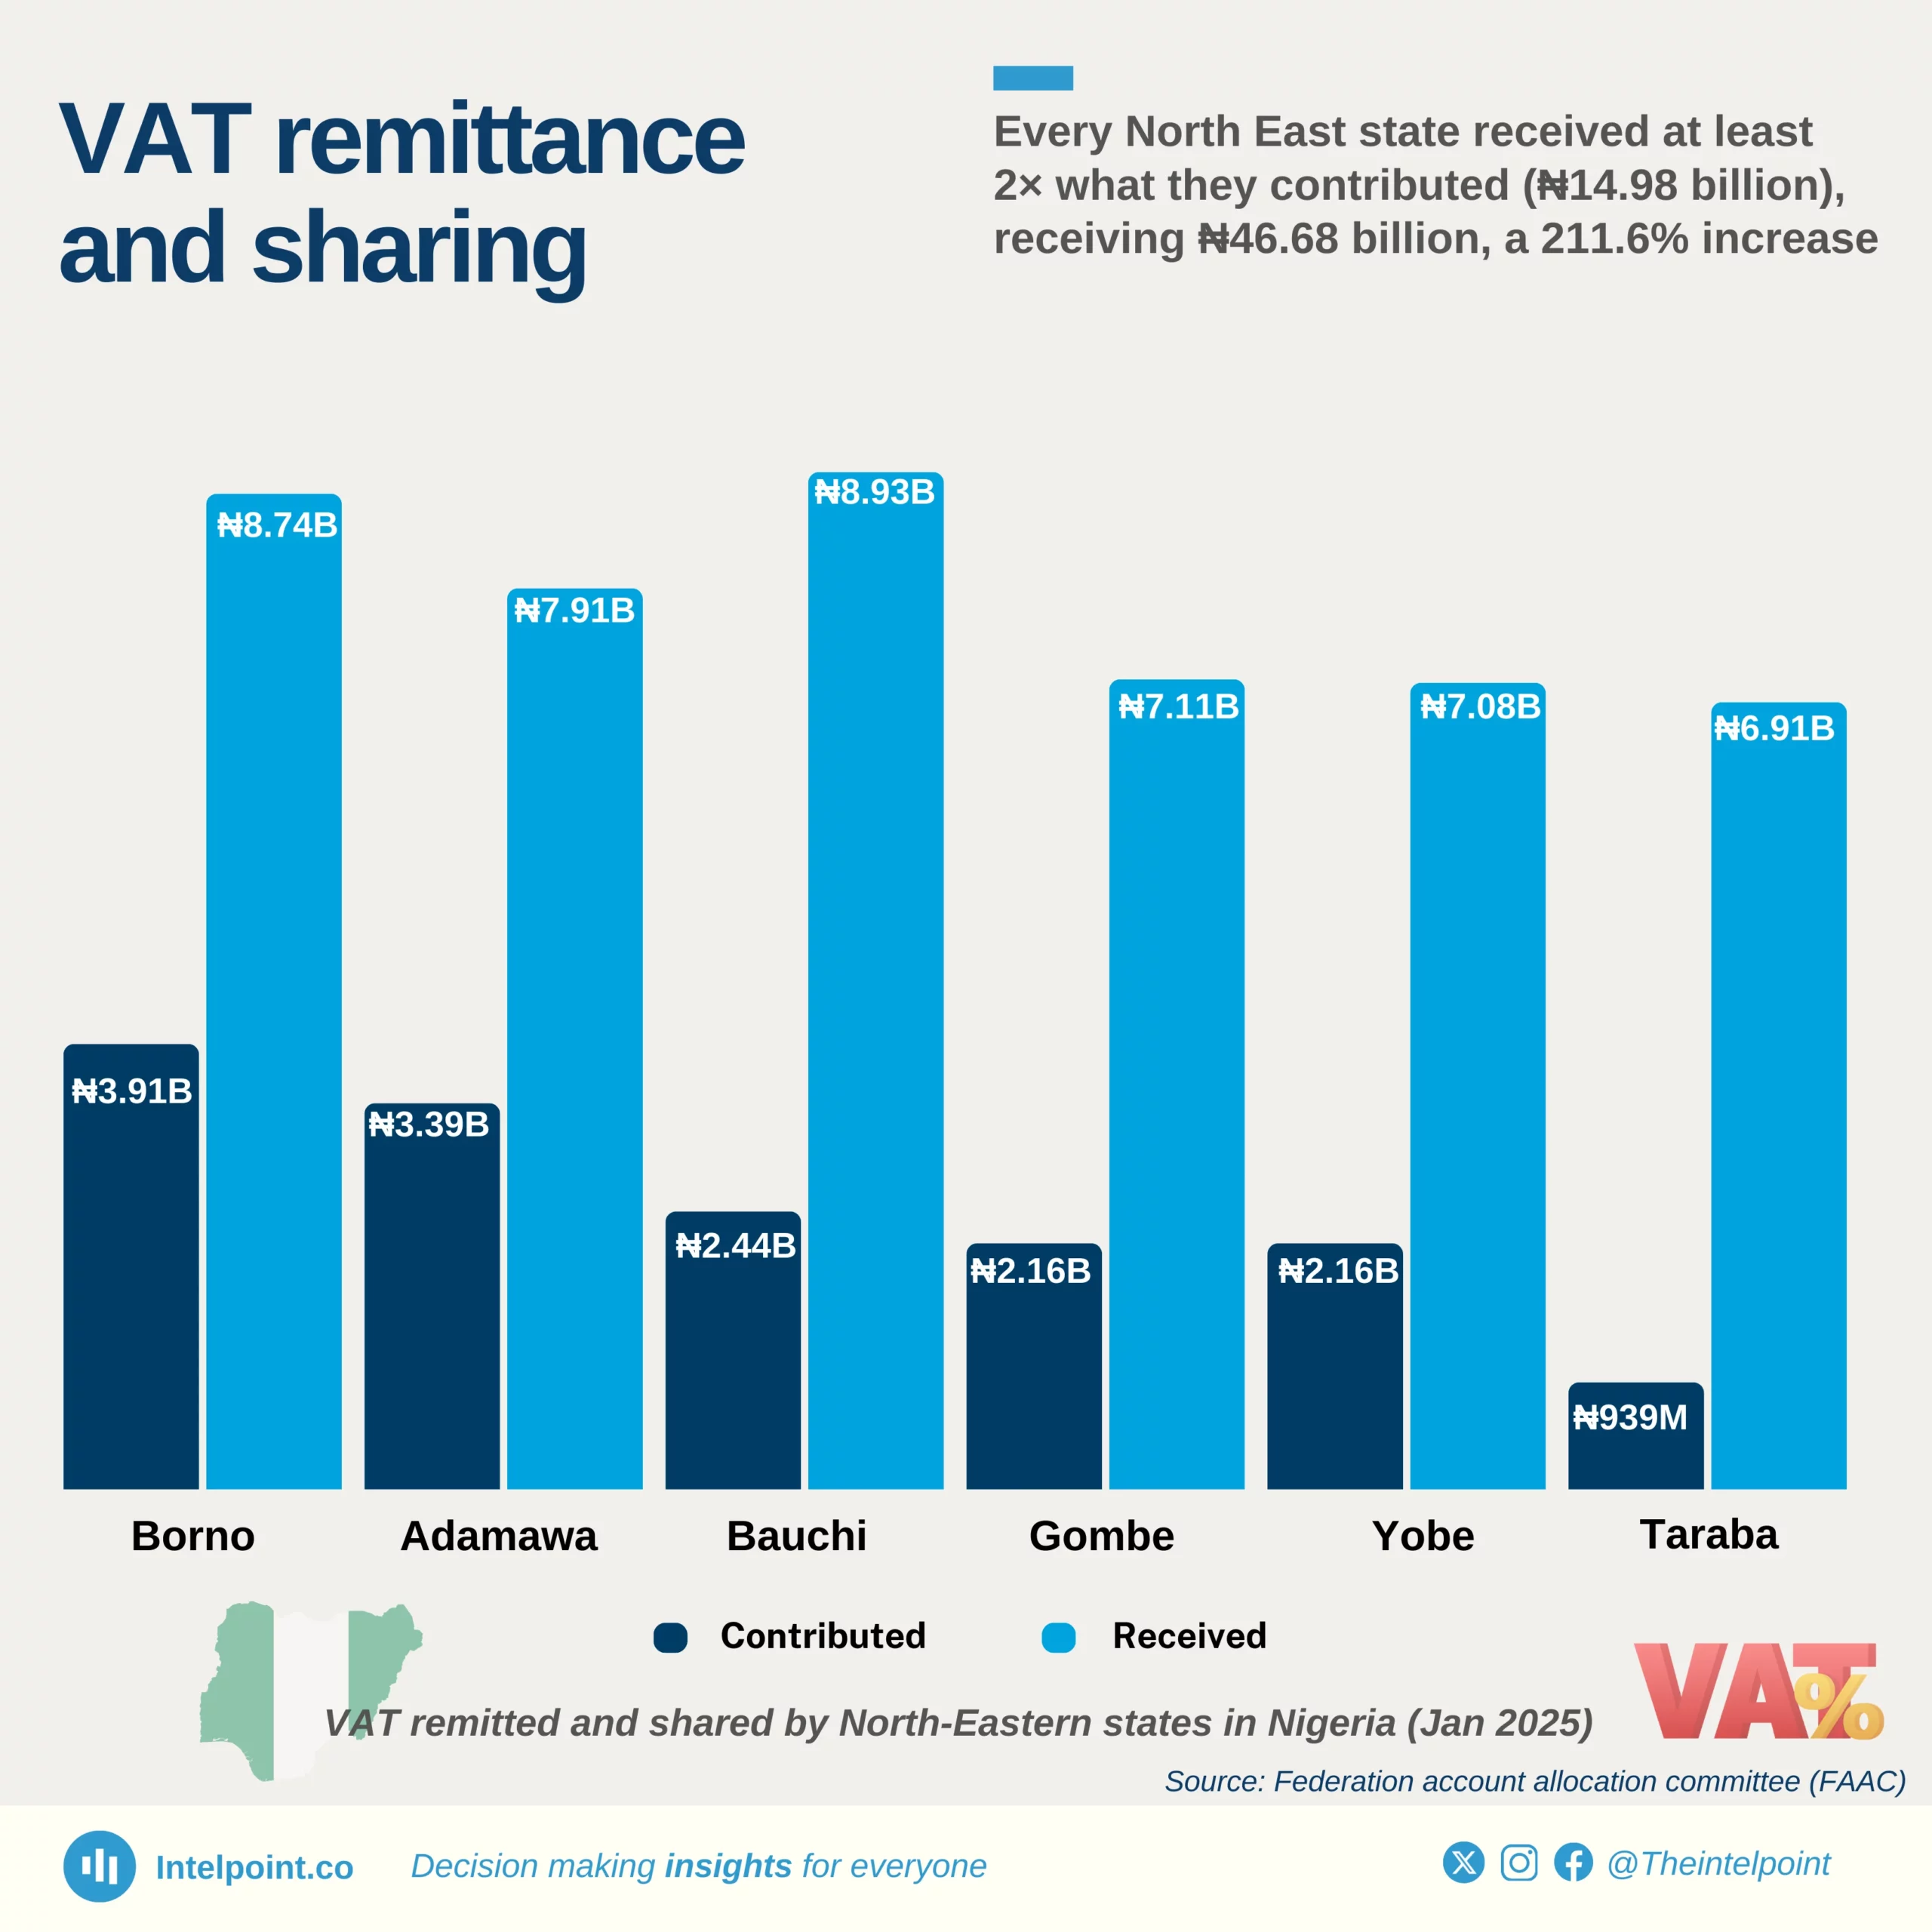
The North-East remitted only ₦14.98 billion but received ₦46.68 billion, showing a 211.6% gain due to sharing.
Taraba, the lowest contributor (₦0.94 billion), saw the highest percentage gain (635%) with an allocation of ₦6.91 billion, reinforcing that smaller economies benefit the most from VAT sharing.
Bauchi, despite remitting just ₦2.44 billion, received the highest allocation (₦8.93 billion), a 266% increase, illustrating how VAT is shared based on equality and population, not economic activity.
Every state in the region received at least 2× what they remitted, highlighting the North East’s reliance on VAT sharing and fuelling the fiscal federalism debate on whether VAT should be retained at the state level.
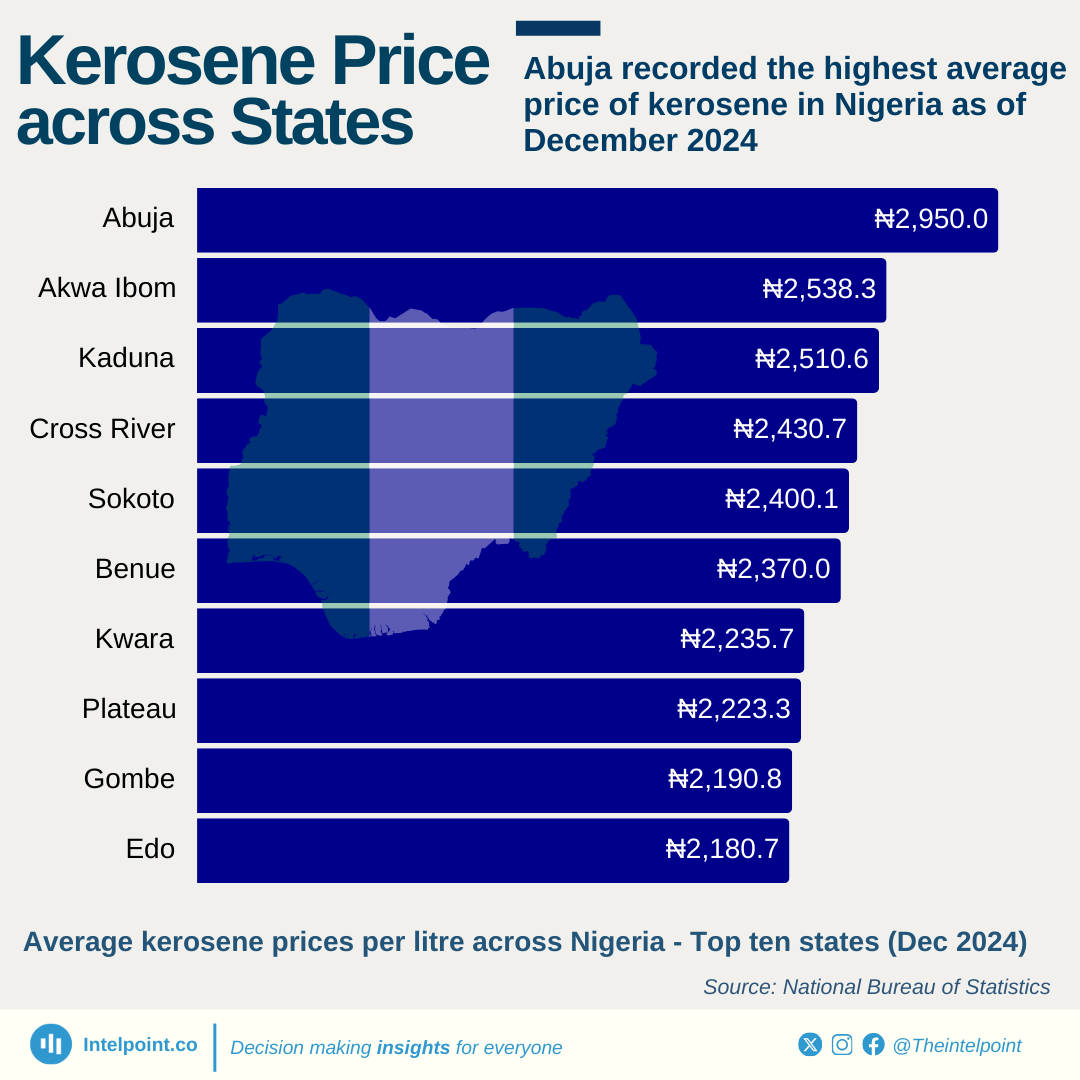
In December 2024, the top five states with the highest average kerosene prices were: Abuja (₦2,950.0), Akwa Ibom (₦2,538.3), Kaduna (₦2,510.6), Cross River (₦2,430.7), and Sokoto (₦2,400.1).
Abuja recorded the highest average price of kerosene in December 2024, while Borno state recorded the lowest price.
The price of kerosene per litre ranged from ₦1,520.4 to ₦2,950 across Nigerian states in December 2024.
The percentage difference in the price of kerosene across Nigeria states in December 2024 is approximately 63.9%.
Lagos led Nigerian states with ₦815.9 billion in Internally Generated Revenue for 2023, followed by the FCT with ₦211.1 billion.
Despite only a 25% growth, Lagos’ IGR confirms its economic dominance. The FCT, meanwhile, recorded an impressive 70% increase.
Ebonyi, though with lower revenue, achieved an astonishing 148% growth.
Taraba generated the least revenue, increasing by 6%.