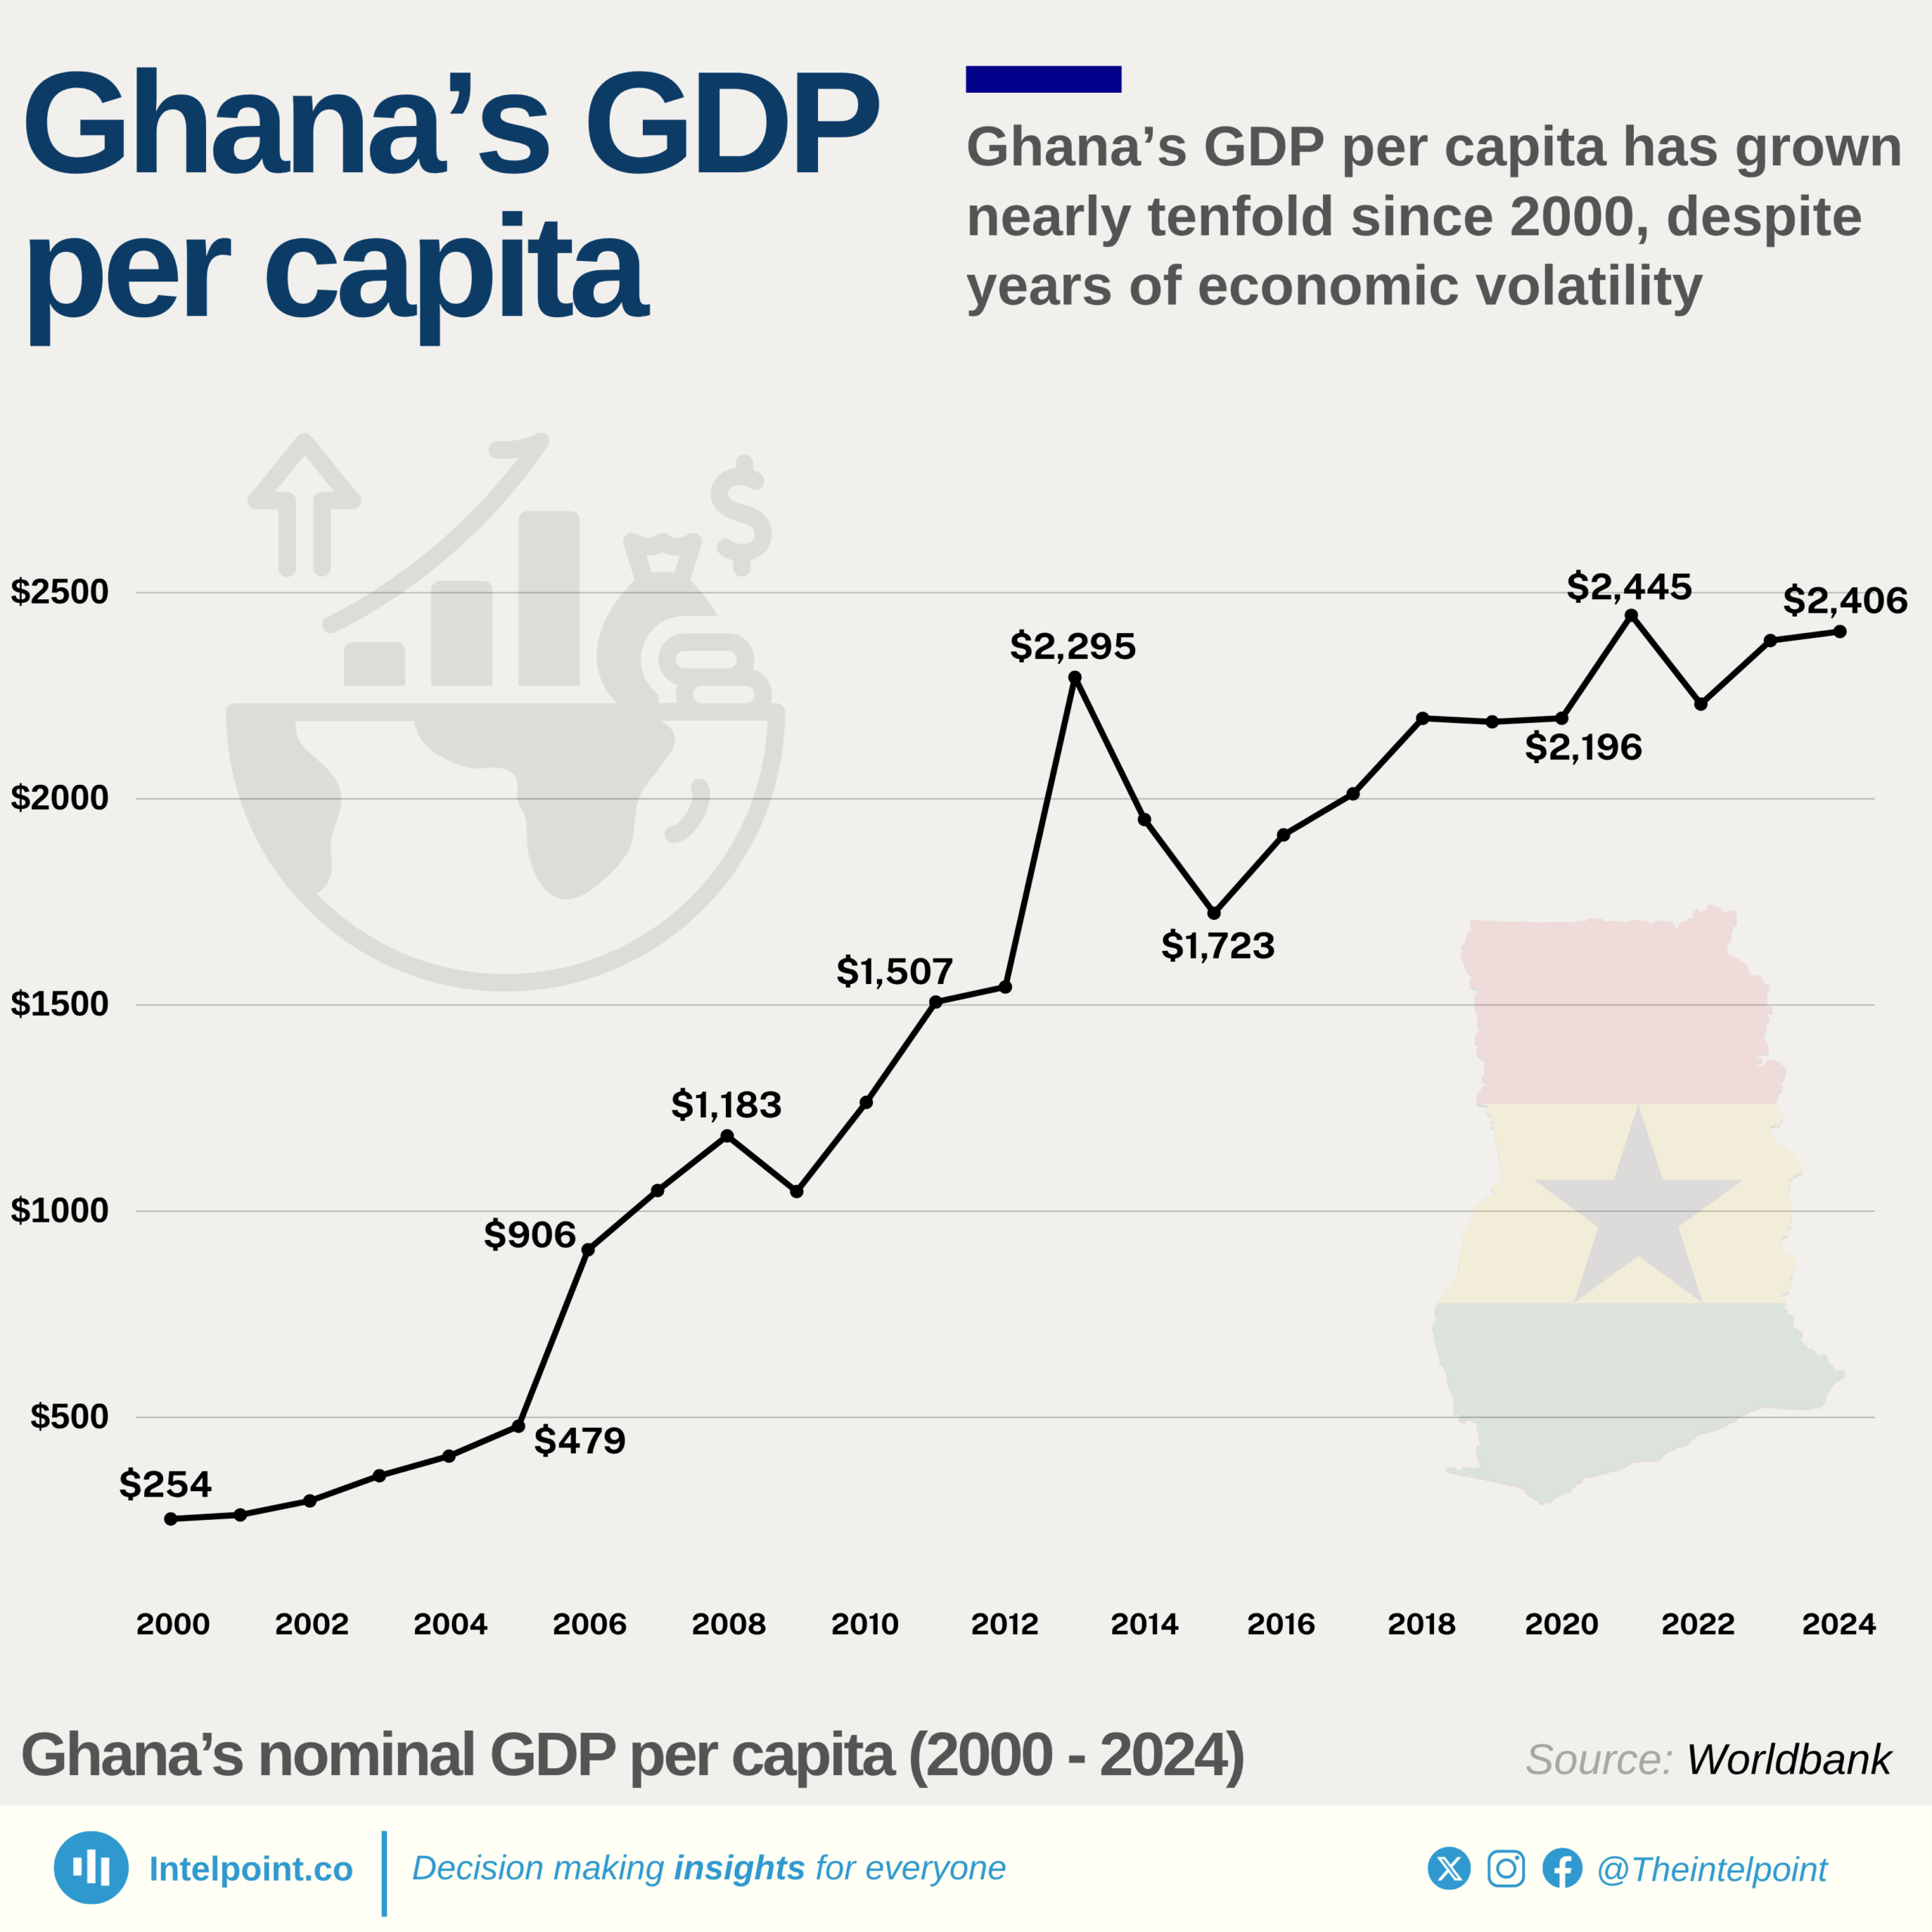
Between 2000 and 2008, Ghana’s GDP per capita rose from $253.7 to $1,182.7, more than quadrupling in just nine years.
It peaked in 2013 at $2,294.8 but declined sharply after 2014.
After a dip in 2022, it rebounded to $2,405.8 in 2024, nearly 10 times higher than the figure in 2000.
The declines seen in 2009, 2015, and 2022 mirror global and local crises, including the 2008 financial crash, commodity shocks, and post-COVID disruptions.
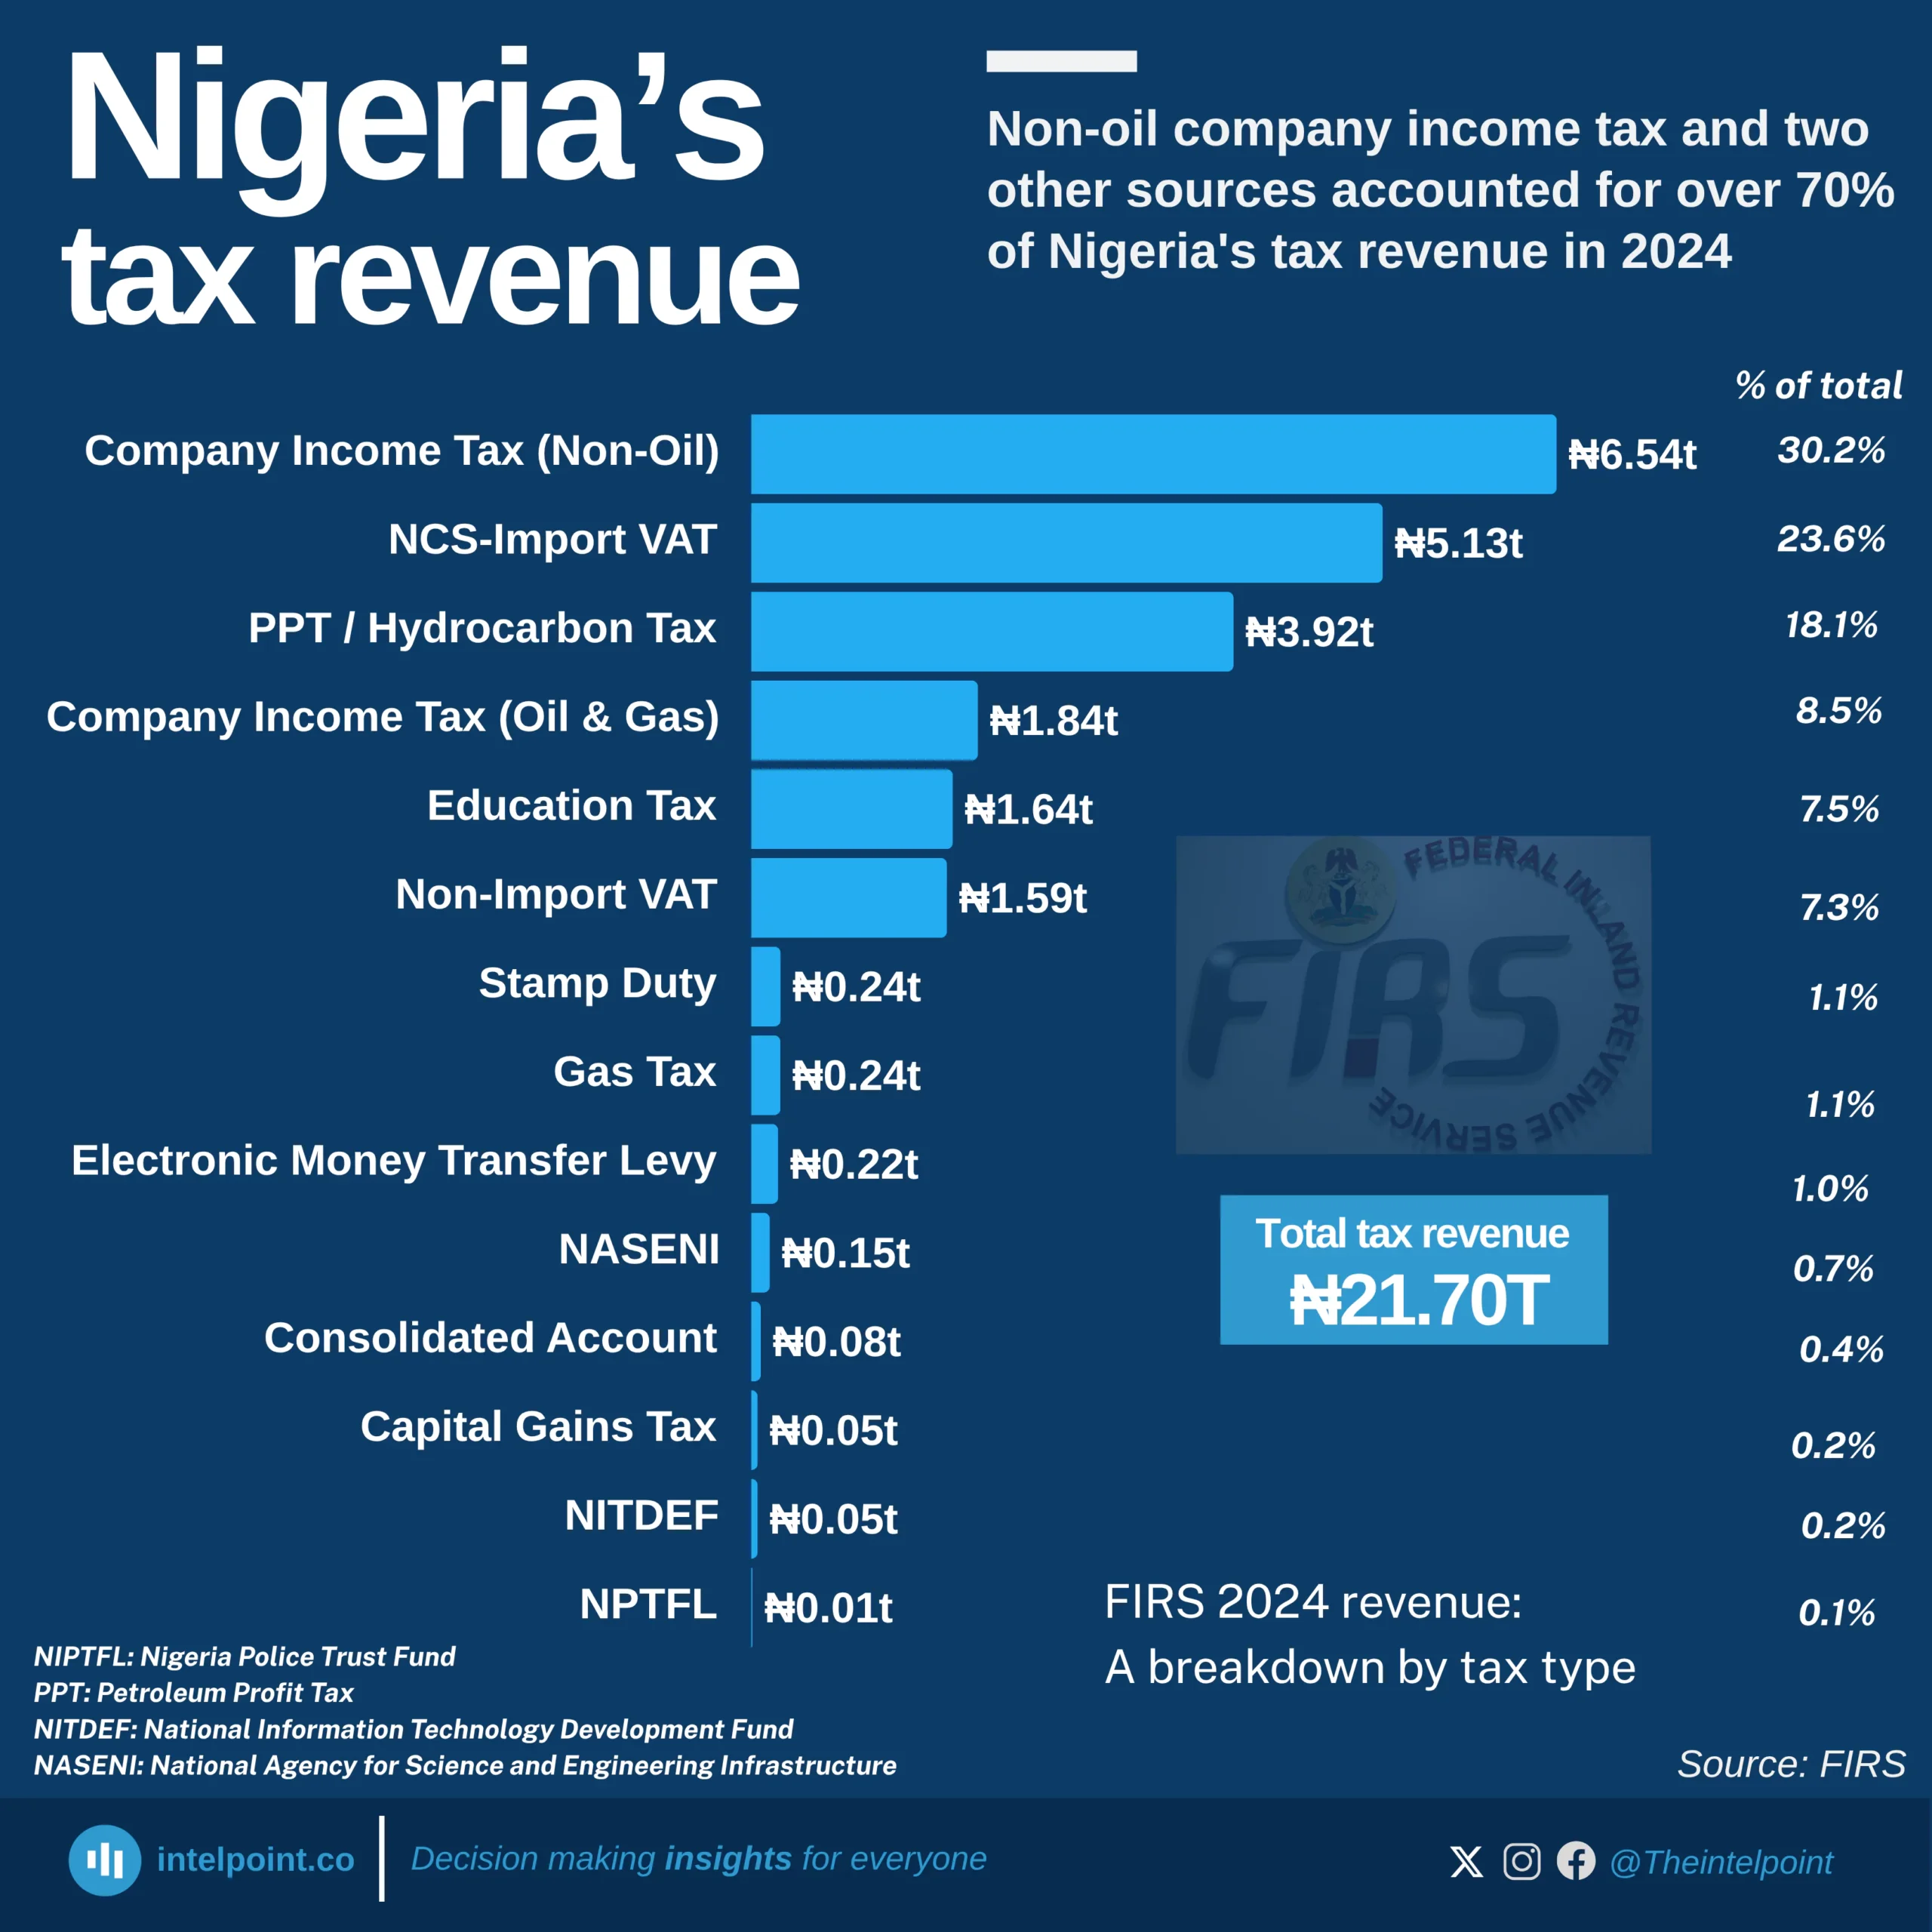
Company Income Tax (Non-Oil) emerged as the largest contributor, accounting for over 30% of total tax revenue.
NCS-Import VAT followed closely, contributing 23.63%, emphasising the significance of import-related taxes to Nigeria's revenue.
Traditional oil-based taxes such as Petroleum Profit Tax/Hydrocarbon Tax and CIT (Oil & Gas) jointly contributed over 26%, showing that oil remains a vital but declining pillar.
Newer tax streams like the Electronic Money Transfer Levy and NASENI (National Agency for Science and Engineering Infrastructure) funding have emerged, but still make up less than 2% of total revenue.
Minor tax categories like Capital Gains Tax, NITDEF (National Information Technology Development Fund), and NPTFL (Nigeria Police Trust Fund) had negligible impact, each contributing less than 0.5%
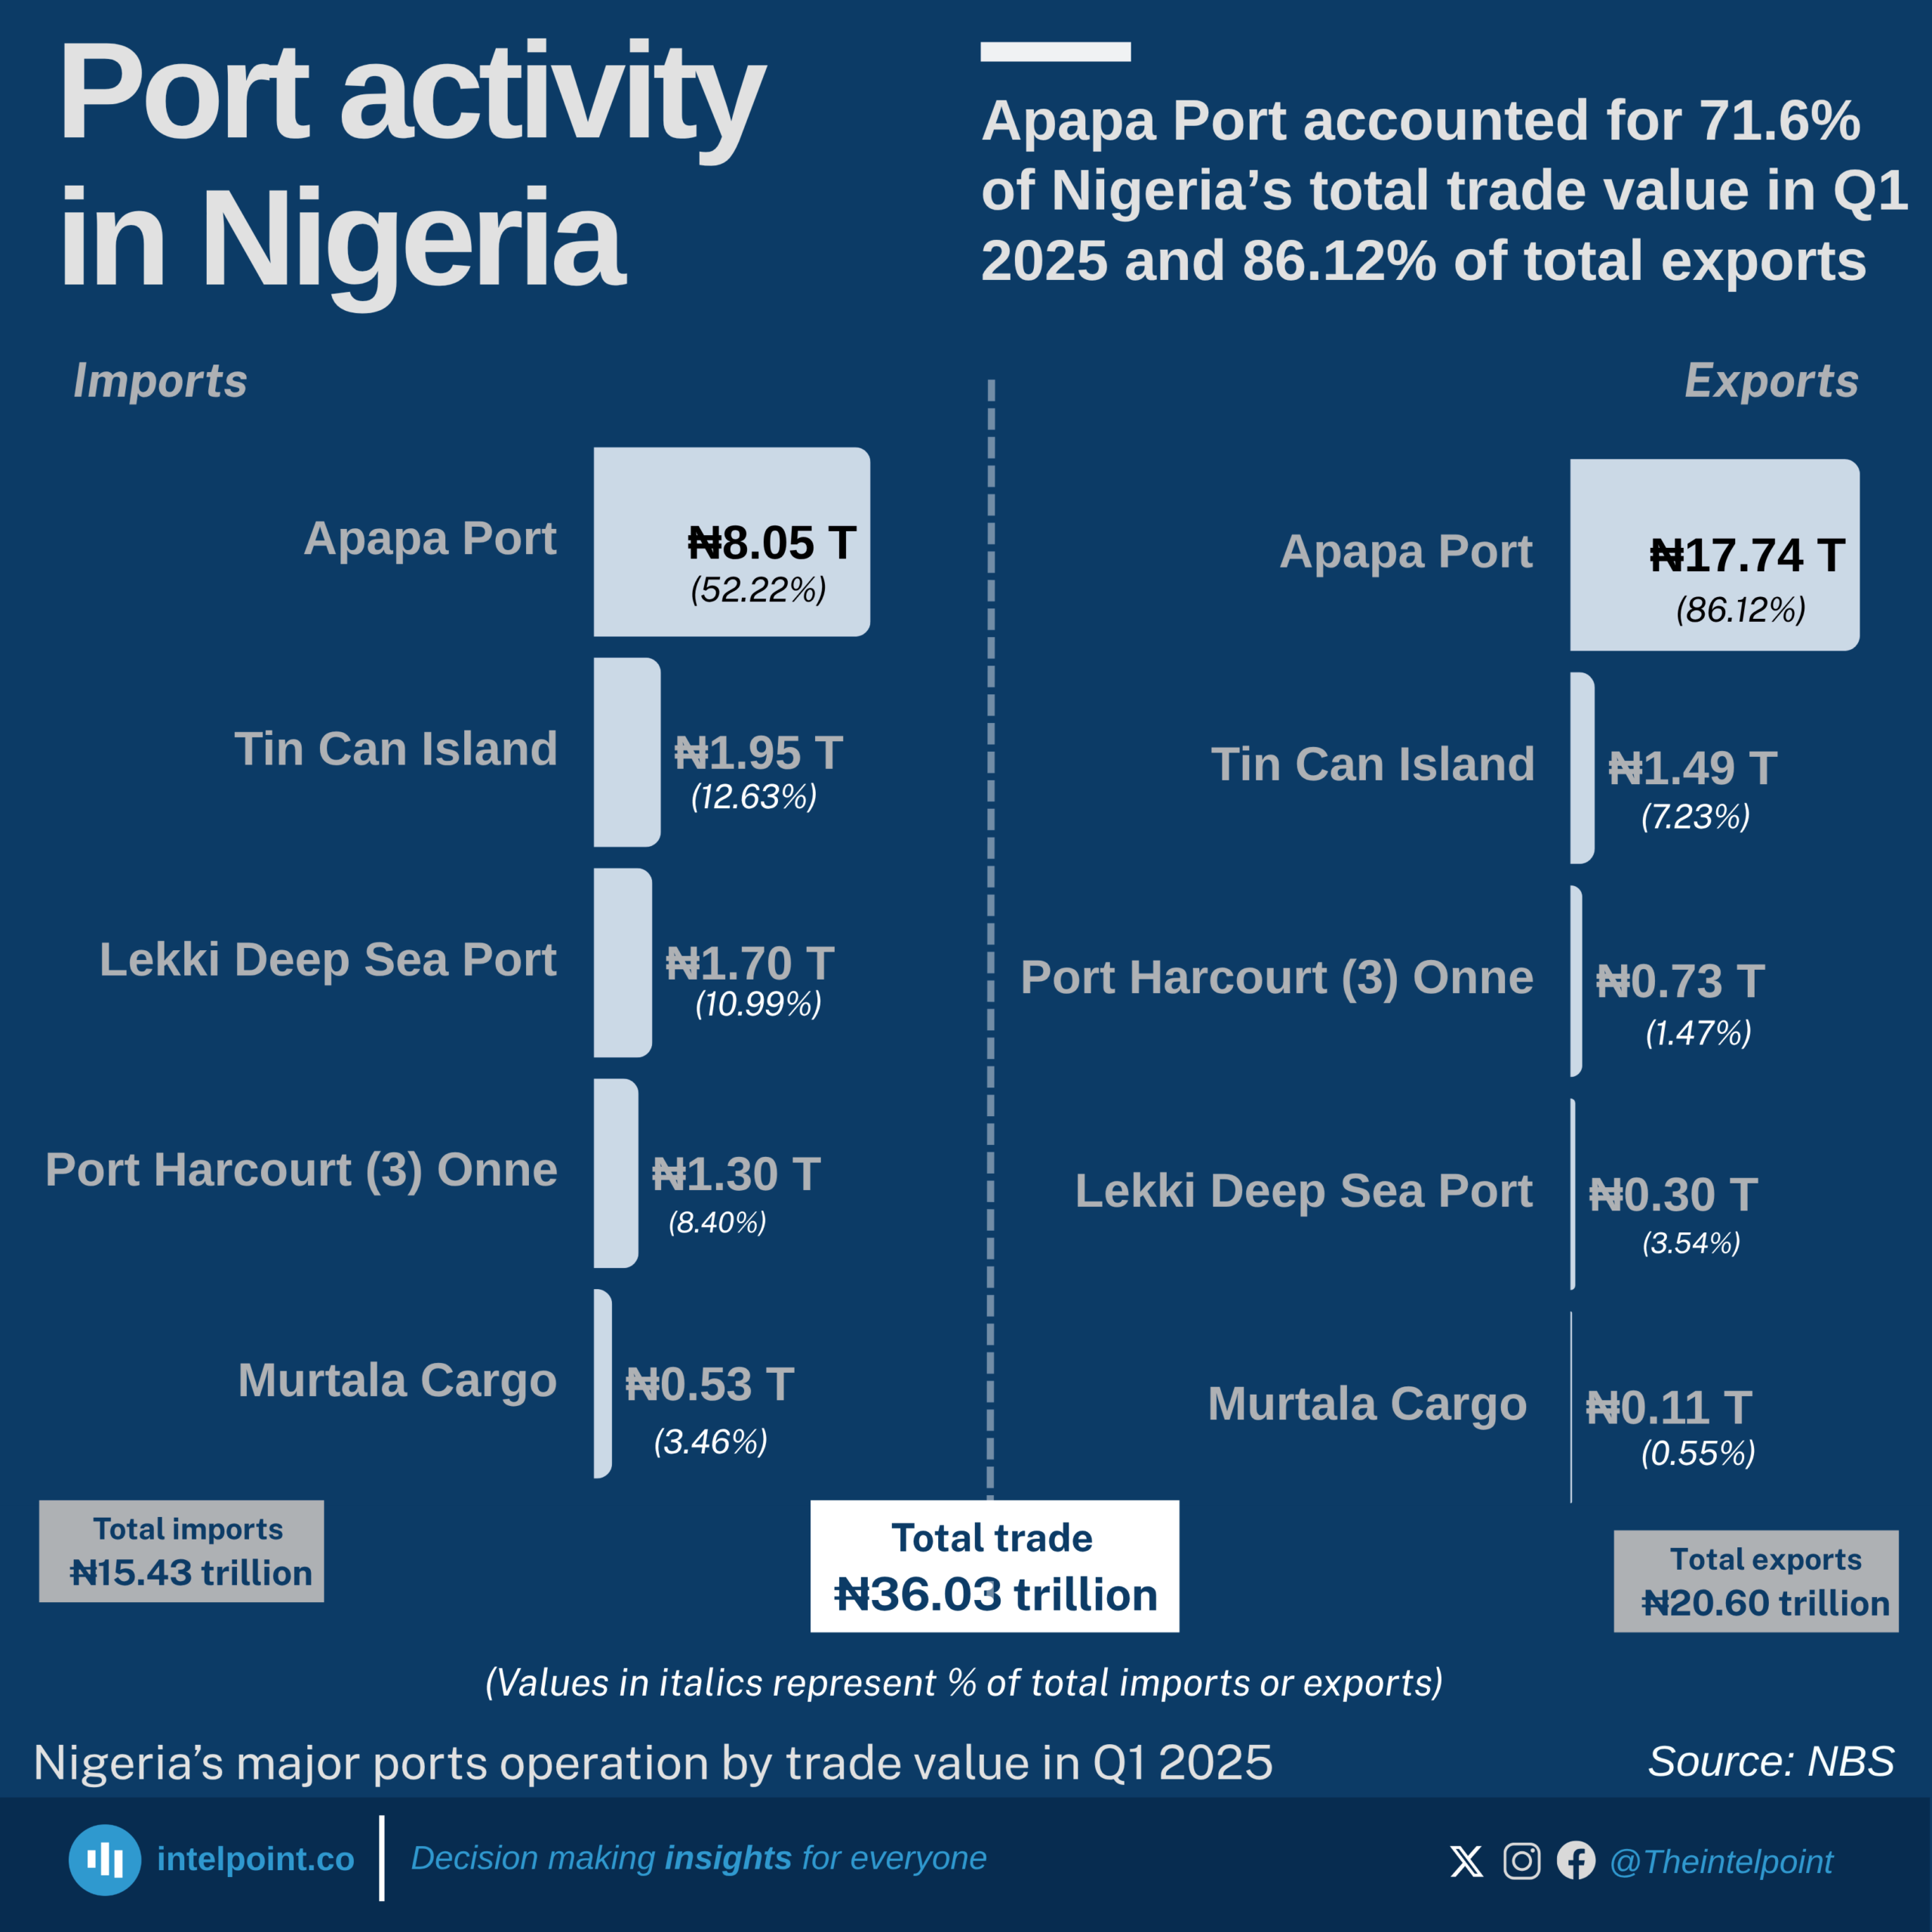
Apapa Port accounted for 71.6% of Nigeria’s total trade value in Q1 2025 and 82.12% of total exports
Apapa Port handled ₦25.79 trillion worth of goods in Q1 2025, representing 71.6% of total trade. It remains the country’s primary trade hub, far surpassing all other ports combined.
Apapa alone facilitated ₦17.74 trillion or 86.1% of Nigeria’s total exports, showing a high dependency on a single location for outbound goods.
Tin Can Island is the only meaningful secondary hub With ₦3.44 trillion (9.5%) in total trade, ranking a distant second. It’s the only other port contributing more than ₦1 trillion each to imports and exports.
Lekki has limited export impact, despite handling ₦1.70 trillion in imports. Lekki contributed only ₦0.30 trillion (1.5%) in exports, indicating underutilization for outbound trade.
Murtala Muhammed International Airport processed just ₦647.91 billion (1.8%) of total trade, reinforcing that Nigeria’s international trade remains heavily maritime-focused.
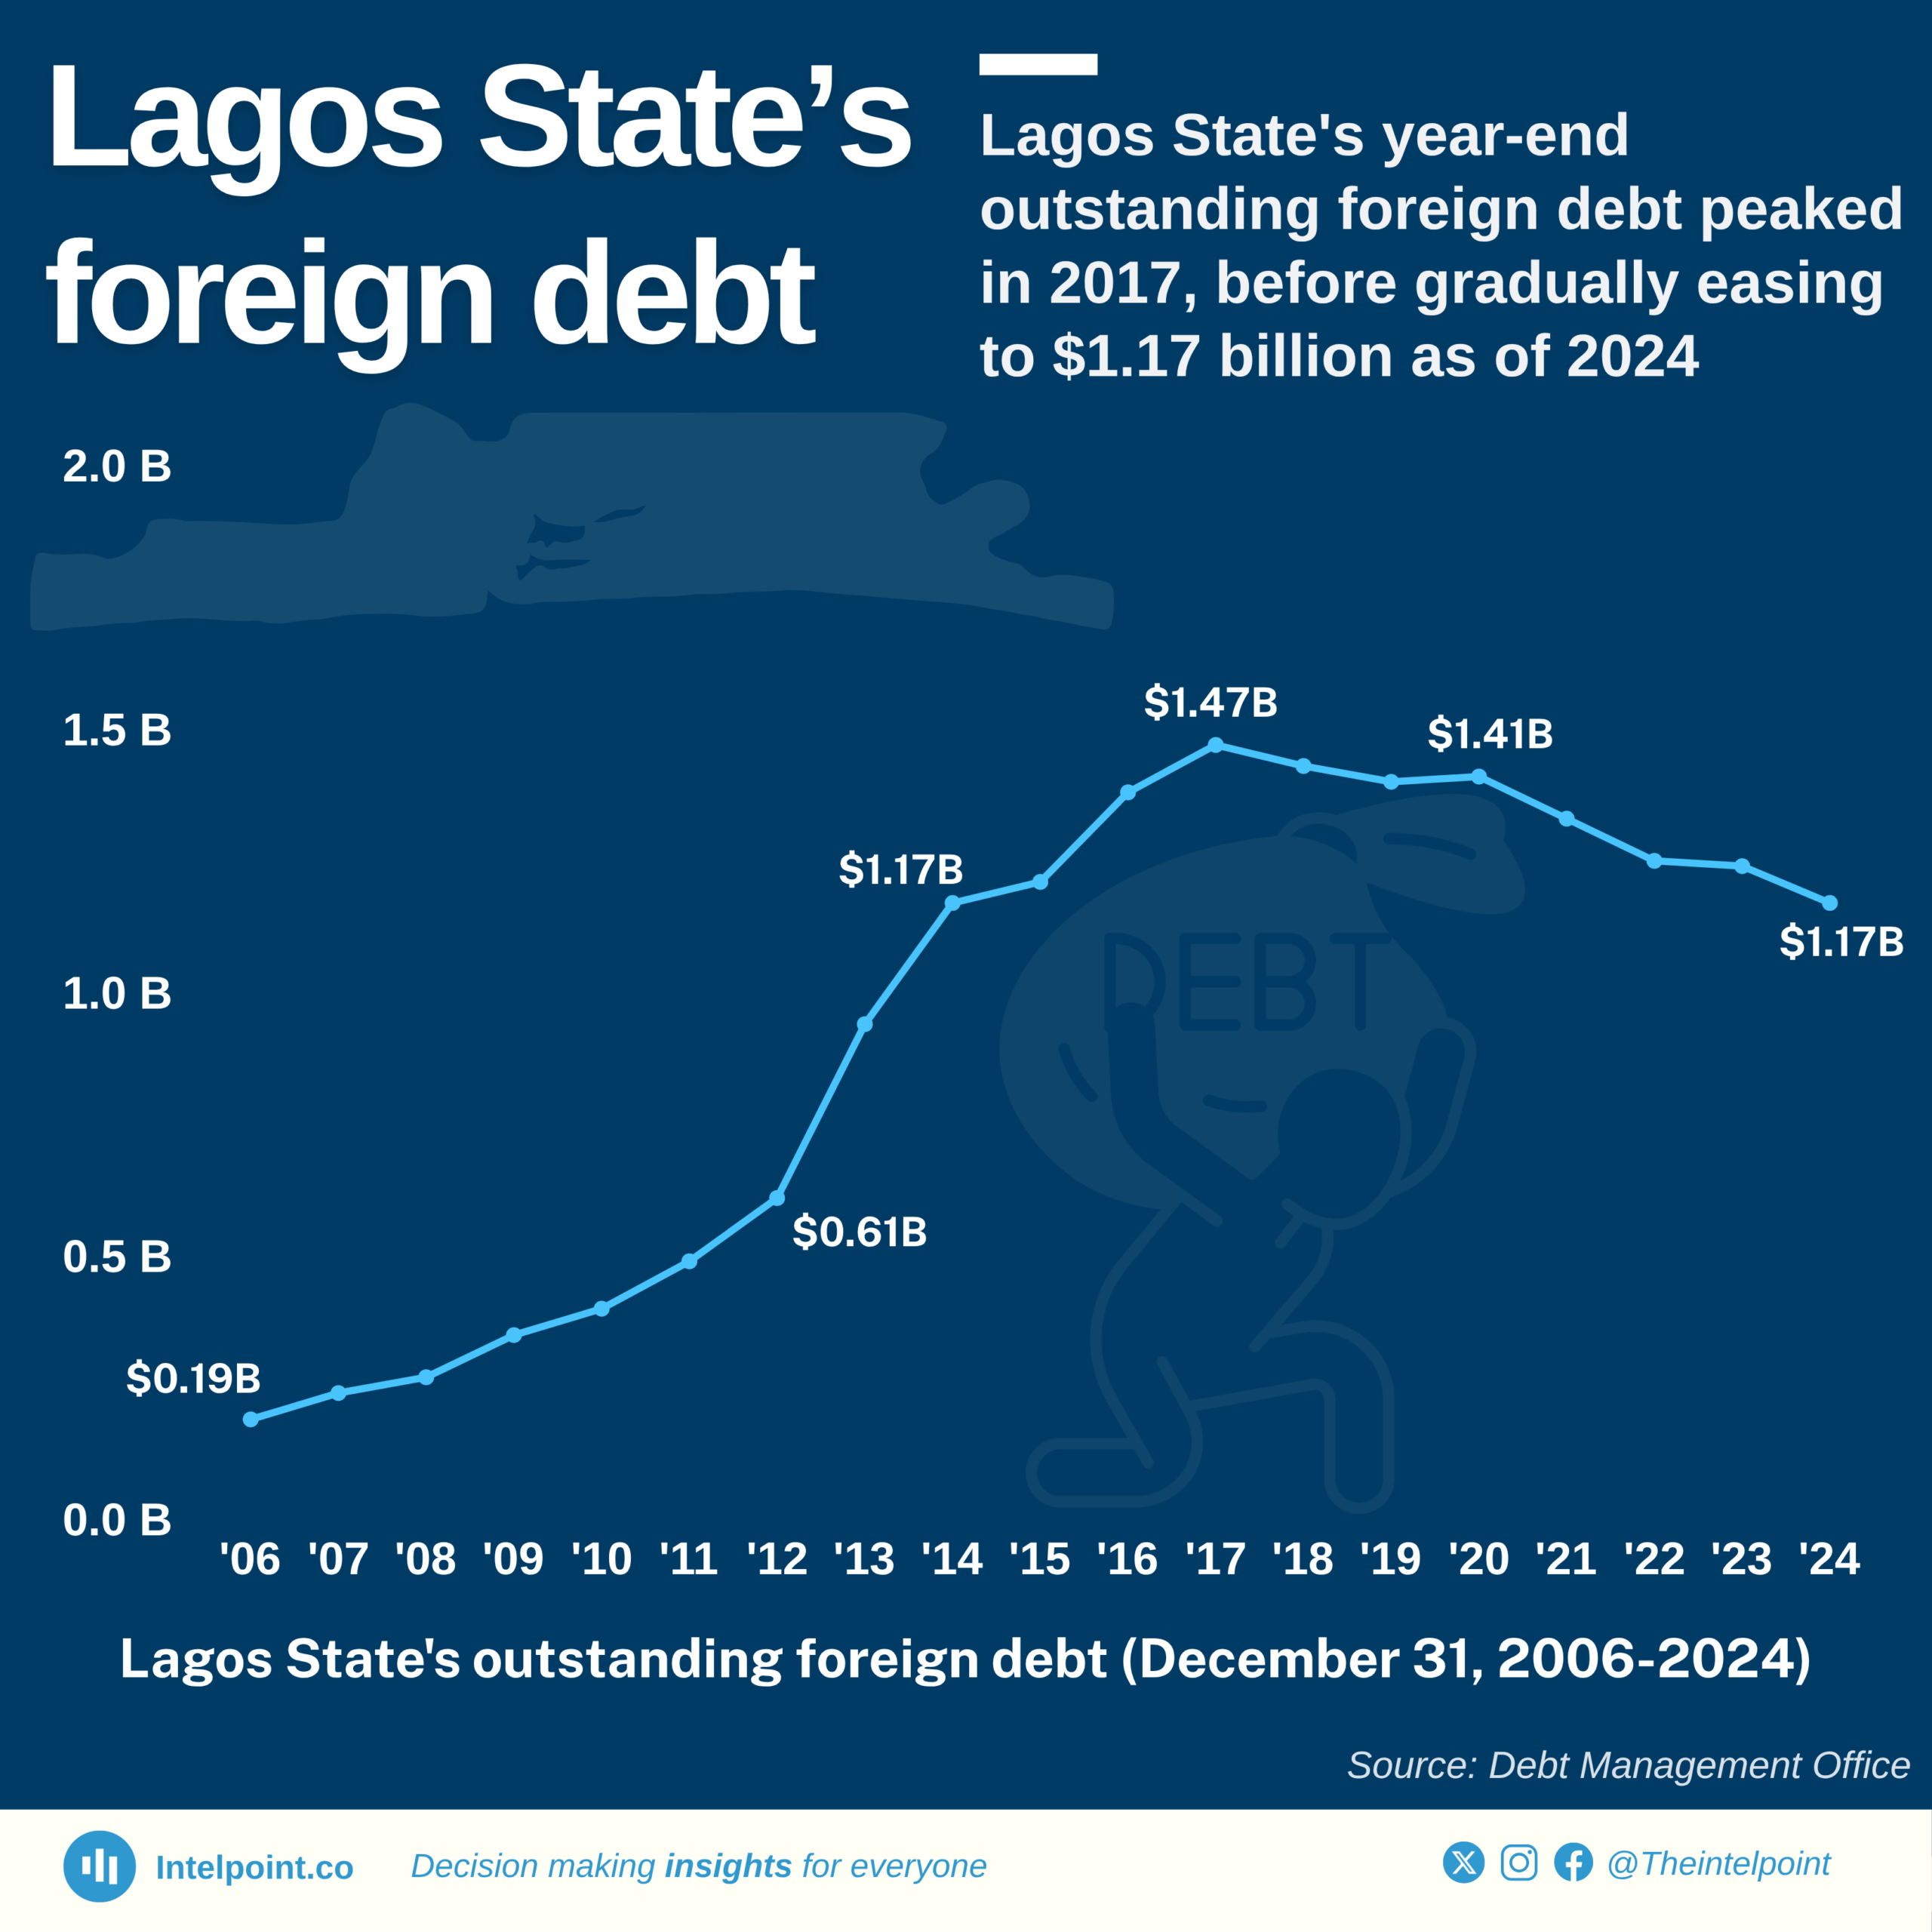
From just $190 million in 2006, Lagos State's year-end external debt rose significantly to over $1.1 billion by 2024, a more than 500% increase over 19 years.
The highest year-end debt was recorded in 2017 at $1.47 billion, with a gradual decline afterwards, except for a brief rise again in 2022–2023.
By 2024, Lagos State's external debt dipped slightly to $1.17 billion, suggesting some debt service or currency gain effects.
If Lagos State paid off or borrowed funds in a given year, only the remaining unpaid amount by year-end is shown in the data.