
Africa’s imports increased from approximately $27.6 billion in 2000 to over $600 billion by 2023, with Asia accounting for over 40%. Chinese trade with Africa increased from $11.67 billion in 2000 to $257.67 billion by 2022, making China Africa’s largest partner country by 2022. Intra-African trade increased to $192 billion by 2023, accounting for approximately 15% of total African trade compared to 13.6% by 2022.
Here's a detailed table summarizing key trends in top African countries imports from 2000 to 2024:
| Year | Top Countries by Import Volume | Key Trends |
| 2000-2005 | South Africa, Egypt, Nigeria | South Africa and Egypt led imports; Nigeria's imports rose due to increasing oil revenues. |
| 2006-2010 | South Africa, Nigeria, Egypt | Nigeria surpassed Egypt, becoming the second-largest importer, driven by economic growth and consumer demand. |
| 2011-2015 | South Africa, Nigeria, Egypt | South Africa maintained the lead; Nigeria and Egypt continued significant import activities amid economic diversification. |
| 2016-2020 | South Africa, Nigeria, Egypt | Despite economic challenges, South Africa remained the top importer; Nigeria and Egypt sustained high import volumes. |
| 2021-2024 | South Africa, Nigeria, Egypt | South Africa continues to lead; Nigeria and Egypt maintain substantial import volumes, reflecting ongoing demand. |
Key takeaways
- 2000-2005: Africa’s importation of Asian and Western goods surged, led by South Africa’s $23.6 billion.
- 2006-2010: China is Africa’s biggest trading partner, increasing its trade from $55.5 billion to $114.81 billion.
- 2011-2015: India’s exports to Africa have expanded by 20%, focusing on machinery and chemicals.
- 2016-2020: Consumer goods importation increased by 12%, whereas the Middle East’s proportion of trade increased by 5%.
- 2021-2024: Medical supplies importation also increased by 20%, followed by a 15% increase in the importation of consumer electronics from China, India, and the Middle East.
Top African countries import from 2000 to 2024
Here is an overview of the top African importers, their import volumes, and the primary products they imported from 2000 to 2024:
| Rank | Country | Import Volume (USD) | Top Imported Products |
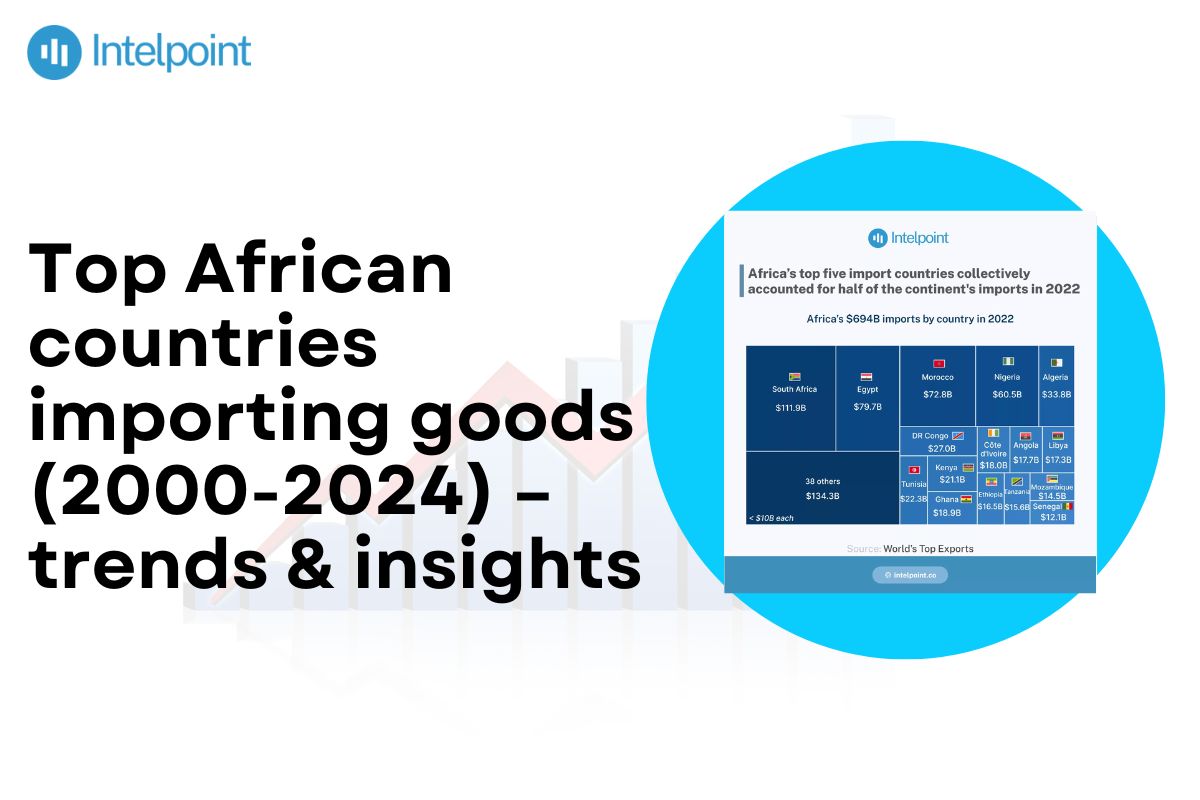
| 1 | South Africa | $111.9 billion (2022) | Machinery, mineral products, vehicles, aircraft vessels, chemicals, equipment components, and iron and steel products. |
| 2 | Egypt | $79.7 billion (2022) | Mineral and chemical products, agricultural products, machinery and electrical equipment, and base metals. |
| 3 | Nigeria | $55.1 billion (2022) | Premium motor spirits, industrial supplies, capital goods, food and beverages, fuel and lubricants, transport equipment and parts, and telecommunication devices. |
| 4 | Morocco | $51.3 billion (2022) | Mineral fuels and oils, machinery, vehicles, electrical machinery and equipment, plastics, cereals, aircraft and spacecraft, iron and steel. |
| 5 | Algeria | $49.0 billion (2022) | Machinery, vehicles, electrical machinery and equipment, mineral fuels and oils, cereals, plastics, pharmaceutical products, iron and steel articles. |
| 6 | Tunisia | $36.5 billion (2022) | Mineral fuels, electrical machinery and equipment, plastics, vehicles, iron and steel, cereals, pharmaceutical products, cotton, optical and medical equipment. |
| 7 | Kenya | $21.1 billion (2022) | Medium oils and preparations, crude palm oil, wheat, flat-rolled products of iron or non-alloy steel, semi-milled or wholly milled rice, and motor cars. |
| 8 | Angola | $17.4 billion (2022) | Mineral fuels, oils, machinery, ships, boats and floating structures, electrical machinery and equipment, meat, and vehicles. |
| 9 | Ghana | $11.9 billion (2022) | Motor cars, broken rice, cement clinkers, refined sugar, milled rice, and trucks. |
| 10 | Togo | $12.9 billion (2022) | Medium oils and preparations, light oils and preparations, motorcycles, motorcars, palm oil, coal, and wheat. |
2000-2005: Traditional Imports
Africa’s imports also increased considerably, with its main partners including South Africa, Germany, America, France, and Britain. The importation of consumer goods increased from $20.8 billion (30.76% of total importation) in 2000 to $41.1 billion (31.84%) in 2005. Due to infrastructural development and industrialization, the importation of capital goods increased from $18.8 billion (27.69%) to $37.3 billion (28.86%).
2006-2010: The Rise of China
China became Africa’s largest trading partner, with trade volume growing from $55.5 billion in 2006 to $114.81 billion by November 2010. China’s exports included machinery, electronics, construction materials, and vehicles. By 2007, China-Africa trade reached $73.3 billion, accounting for 9.6% of Africa’s imports.
2011-2015: Diversification and India's Growing Role
Africa diversified its imports, and India's increased substantially. Between 2005 and 2011, India's imports of goods to Africa grew by 23.1% annually, reaching $25.6 billion by 2015. Importing goods from Africa to India grew from $4.4 billion in 2005 to $27.1 billion by 2015, with fuels accounting for around 77% of the total. Importing goods from India to Africa was projected to reach $90 billion by 2015.
2016-2020: Economic Growth and Increased Imports
Africa experienced 3.4% GDP annually on average. South Africa's GDP averaged 1.2% during this period, reaching its peak of 1.52% in 2018. The Middle East region, particularly the UAE, also became a prominent partner, investing $23.8 billion in Africa from 2016 to 2020. UAE-Africa business reached nearly $70 billion by 2021. The merchandise trade deficit of Africa totaled approximately $33.1 billion in 2019.
2021-2024: Post-Pandemic Trade Dynamics
Intra-African imports fell from 12.81% in 2021 to 12.09% in 2022, while consumer electronics imports increased by 15%. China and India remained key suppliers, but the Middle East’s energy and construction materials share increased by 8%. By 2023, intra-African trade reached $192 billion, accounting for 15% of African trade.
Conclusion
From 2000 to 2024, Africa’s top importers—South Africa, Nigeria, and Kenya—drove economic growth through strategic investments. In 2022, South Africa’s imports were $111.9 billion, Nigeria’s $55.1 billion, and Kenya’s $21.1 billion. Asia contributed significantly to this growth, with China accounting for over 16% of Africa’s imports by 2023.
FAQs
What Asian country is now Africa’s largest trading partner?
For 15 consecutive years, China has maintained its position as Africa's leading trading partner; in 2023 alone, trade rose to a record $282.1 billion.
Which African countries import the most?
Africa's top importers, in order of rank, include South Africa, Egypt, Nigeria, Algeria, and Morocco. South Africa leads the continent.
Which African country will have the highest GDP in 2024?
South Africa had the largest GDP in Africa in 2024, estimated at a little over $373 billion.
What is the most developed country in Africa 2024?
Seychelles has Africa's highest GDP per capita in 2024, indicating a high development level.