With a shared border stretching 5,525 miles, Canada and the United States (U.S.) are often compared, especially in terms of landmass.
Canada’s immense northern wilderness certainly overshadows the spread-out states of the U.S., but size alone doesn’t tell the whole story. On the population front, the U.S. far outnumbers Canada.
This report examines the implications of landmass, population, economy, density, and diversity between Canada and the U.S.
Key takeaways
- With a 9,984,670 km² total land size, Canada tops the U.S.’s 9,833,517 km² in 2025. However, when it comes to land area, the U.S. has the upper hand at 9,147,593 km² compared to Canada’s 9,093,510 km².
- In 2025, the U.S. population stands at 347.4 million, outnumbering Canada’s 40.1 million.
- Canada’s low density of 4 people/km² is nearly a tenth of the U.S.’s 38 people/km², influencing both urban and rural life.
- The U.S. boasts a $29.35 trillion GDP, topping Canada’s $2.24 trillion and showcasing its broader economic influence.
Map showing Canada and the United States. Source: Britannica
Landmass Area Comparison
Canada spans 9,984,670 km², slightly larger than the U.S., which covers 9,833,517 km². This makes Canada the second-largest country in the world, according to the CIA World Factbook.
However, when you exclude the water bodies, the U.S. takes the lead with 9,147,593 km² of land compared to Canada’s 9,093,510 km².
The Mercator projection plays on the size of Canada’s north, making Nunavut, with an area of 2,038,722 km², look small next to Alaska's area of 1,723,337 km². For context, states like Texas (695,662 km²) are larger than most Canadian provinces, proving that size can be misleading.
The icy northern parts of Canada stand in stark contrast to the diverse deserts and plains of the U.S. While Canada may have a larger total area, the U.S. benefits from its variety of landscapes and land advantages, giving it a more substantial presence on the global stage.
Population Comparison
The current U.S. population is 347.4 million as of August 2025, with the 2025 mid-year estimate at 347,275,807. Canada follows far behind with 40.1 million, ranking 38th according to Worldometers, an independent provider of global statistics. That’s an 8.4 times difference.
Now think that California, alone, with its 39.1 million residents, is almost the same as the entire population of Canada. This demographic weight gives the U.S significant global influence, whereas Canada’s smaller population contributes to its more restrained presence on the world stage.
Between 2016 and 2021, Canada's population increased by 5.24%, with 66% of that growth attributed to immigration. In contrast, the U.S. has experienced a steadier and more balanced growth pattern.
Population Density and Urbanisation
Currently, Canada’s population density of just 4 people per square kilometre compares poorly to the U.S’s 38 people per square kilometre.
According to Worldometers, approximately 85% of Canadians reside in cities such as Toronto and Montreal, which are within 100 miles of the U.S. border, leaving large areas of the northern territory uninhabited.
The U.S., on the other hand, has a more evenly distributed population, from its lively coasts, such as Los Angeles, to the heartland towns of Ohio and Michigan, creating a variety of economic centers.
The urbanisation ratings tell a similar tale. Based on UN data,83.3% of Americans reside in cities, compared to 80.2% of Canadians. These factors, shaped by geography and economic opportunities, reflect the disparity between Canada’s densely populated southern regions and the U.S.’s densely packed urban-rural landscape.
Economic Comparison
Upon closer examination of the economic landscapes of the two countries, the U.S. economy is poised to outshine Canada’s significantly. It records a GDP of $29.35 trillion (as of Q3 2024) compared to Canada’s $2.24 trillion (2023).
Note: The U.S. GDP is projected to be $29.3 trillion by the end of 2025, from an estimated $28.5 trillion in 2024.
In the U.S., industries are flourishing, particularly in technology, finance, and healthcare. These sectors not only thrive but also drive innovation and create wealth. On the other hand, Canada’s economy relies heavily on real estate, mining (like gold and nickel), and oil and gas.
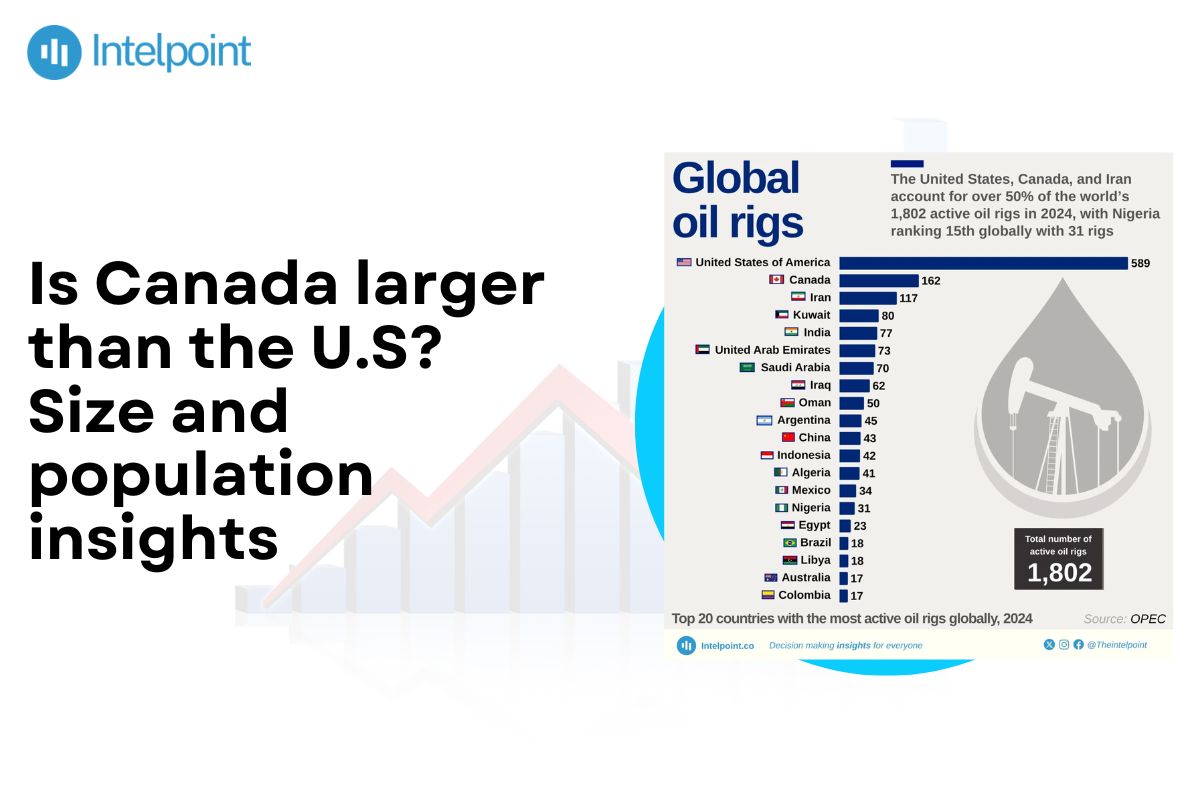
Meanwhile, data gathered by IntelPoint from the Organization of the Petroleum Exporting Countries (OPEC) showed that the United States remains the undisputed leader with 589 active oil rigs, accounting for nearly a third of all rigs worldwide in 2024.
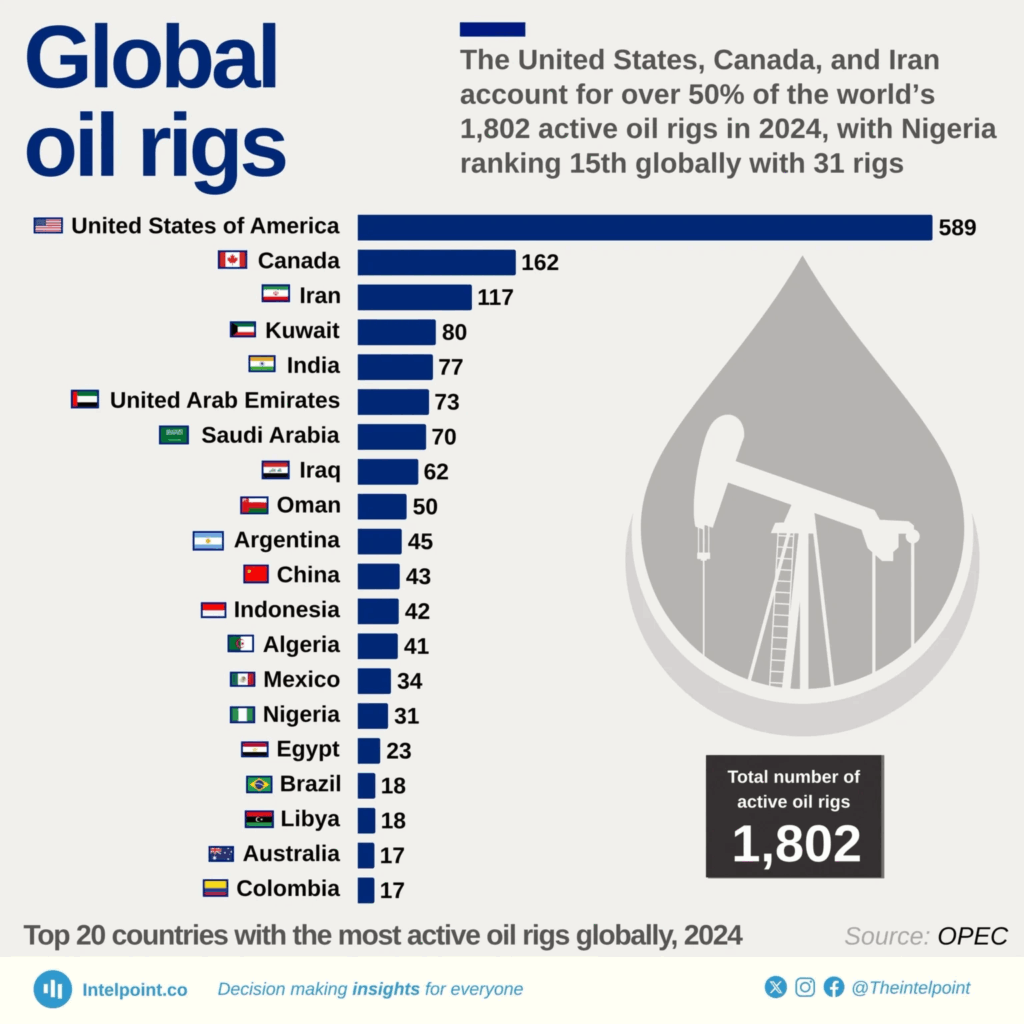
Canada (162 rigs) and Iran (117 rigs) followed as the second and third-highest contributors to global drilling activity, respectively.
Examining GDP per capita reveals a further difference. The U.S. stands at $87,000, while Canada is at $55,800. This indicates that the standard of living and purchasing power are notably higher in the U.S.
Cultural and Demographic diversity
Canada and the U.S. present unique cultural and demographic landscapes in 2025, influenced by language, ethnicity, and immigration policies. These factors play out differently in the two countries.
On language, Canada proudly embraces official bilingualism with English and French, while the U.S. leans towards an unofficial dominance of English; yet, both countries celebrate their diverse populations.
When it comes to linguistic and immigration diversity in Canada, its 23.2% higher immigration rate contributes to its vibrant multicultural mosaic, with 22% of its residents being foreign-born. The U.S., which doesn’t have an official language, showcases a rich ethnic makeup, including 18% Hispanic and 13% Black individuals.
Canada’s multiculturalism policy embraces and honours unique cultural identities, while the U.S.’s melting pot approach aims to blend various cultures into a single, cohesive society.
Examining Indigenous populations, Canada’s 4% First Nations demographic surpasses the U.S.’s 1.3% Native American population, indicating a deeper integration of Indigenous communities in Canada. These differences demonstrate how Canada is inclusive, while the U.S. tends to be assimilative towards diversity.
Other relevant factors
Canada and the U.S. have some other notable differences. These include life expectancy, education, conservation, and political systems, all of which play a role in shaping their unique strengths as of 2025.
- Education: With a literacy rate of 99%, Canada slightly outpaces the U.S, which stands at 98%. In terms of education spending, Canada allocates 5.3% of its GDP, while the U.S spends 5.0%, according to UNESCO.
- Conservation: When it comes to land protection, the U.S. safeguards 13% of its territory, while Canada protects 12.1%. This reflects their commitment to environmental policies.
- Political Systems: Canada’s parliamentary monarchy provides a sense of stability, whereas the U.S.’s federal republic emphasises decentralised governance, contributing to their distinct national identities.
The bottom line
Canada’s large landmass may surpass the U.S.’s in total area, but if you take away its lakes and rivers, the U.S. has more land that can be used for various purposes. Beyond size, the U.S. has a vast population to fuel its lively cities and prosperous economy, while Canada’s quieter northern regions cultivate a rich, multicultural vibe.
These differences shape the unique challenges and global roles of each country. Canada’s welcoming immigration policies attract various talents, while the U.S.’s economic centres encourage wealth creation.