Mining led South Africa’s 2024 exports with 18.7%, as gems and precious metals generated over $20 bn

  • Gems and precious metals were the largest single export category, contributing $20.6 billion.
  • Ores and industrial minerals followed closely with $17.2 billion, showing the country’s reliance on mining.
  • Vehicles and machinery were significant non-mineral exports, with a combined $18.3 billion.
  • Agricultural and light industry products like fruits, nuts, and beverages contributed modestly, strengthening mining and manufacturing’s position as the core export drivers.

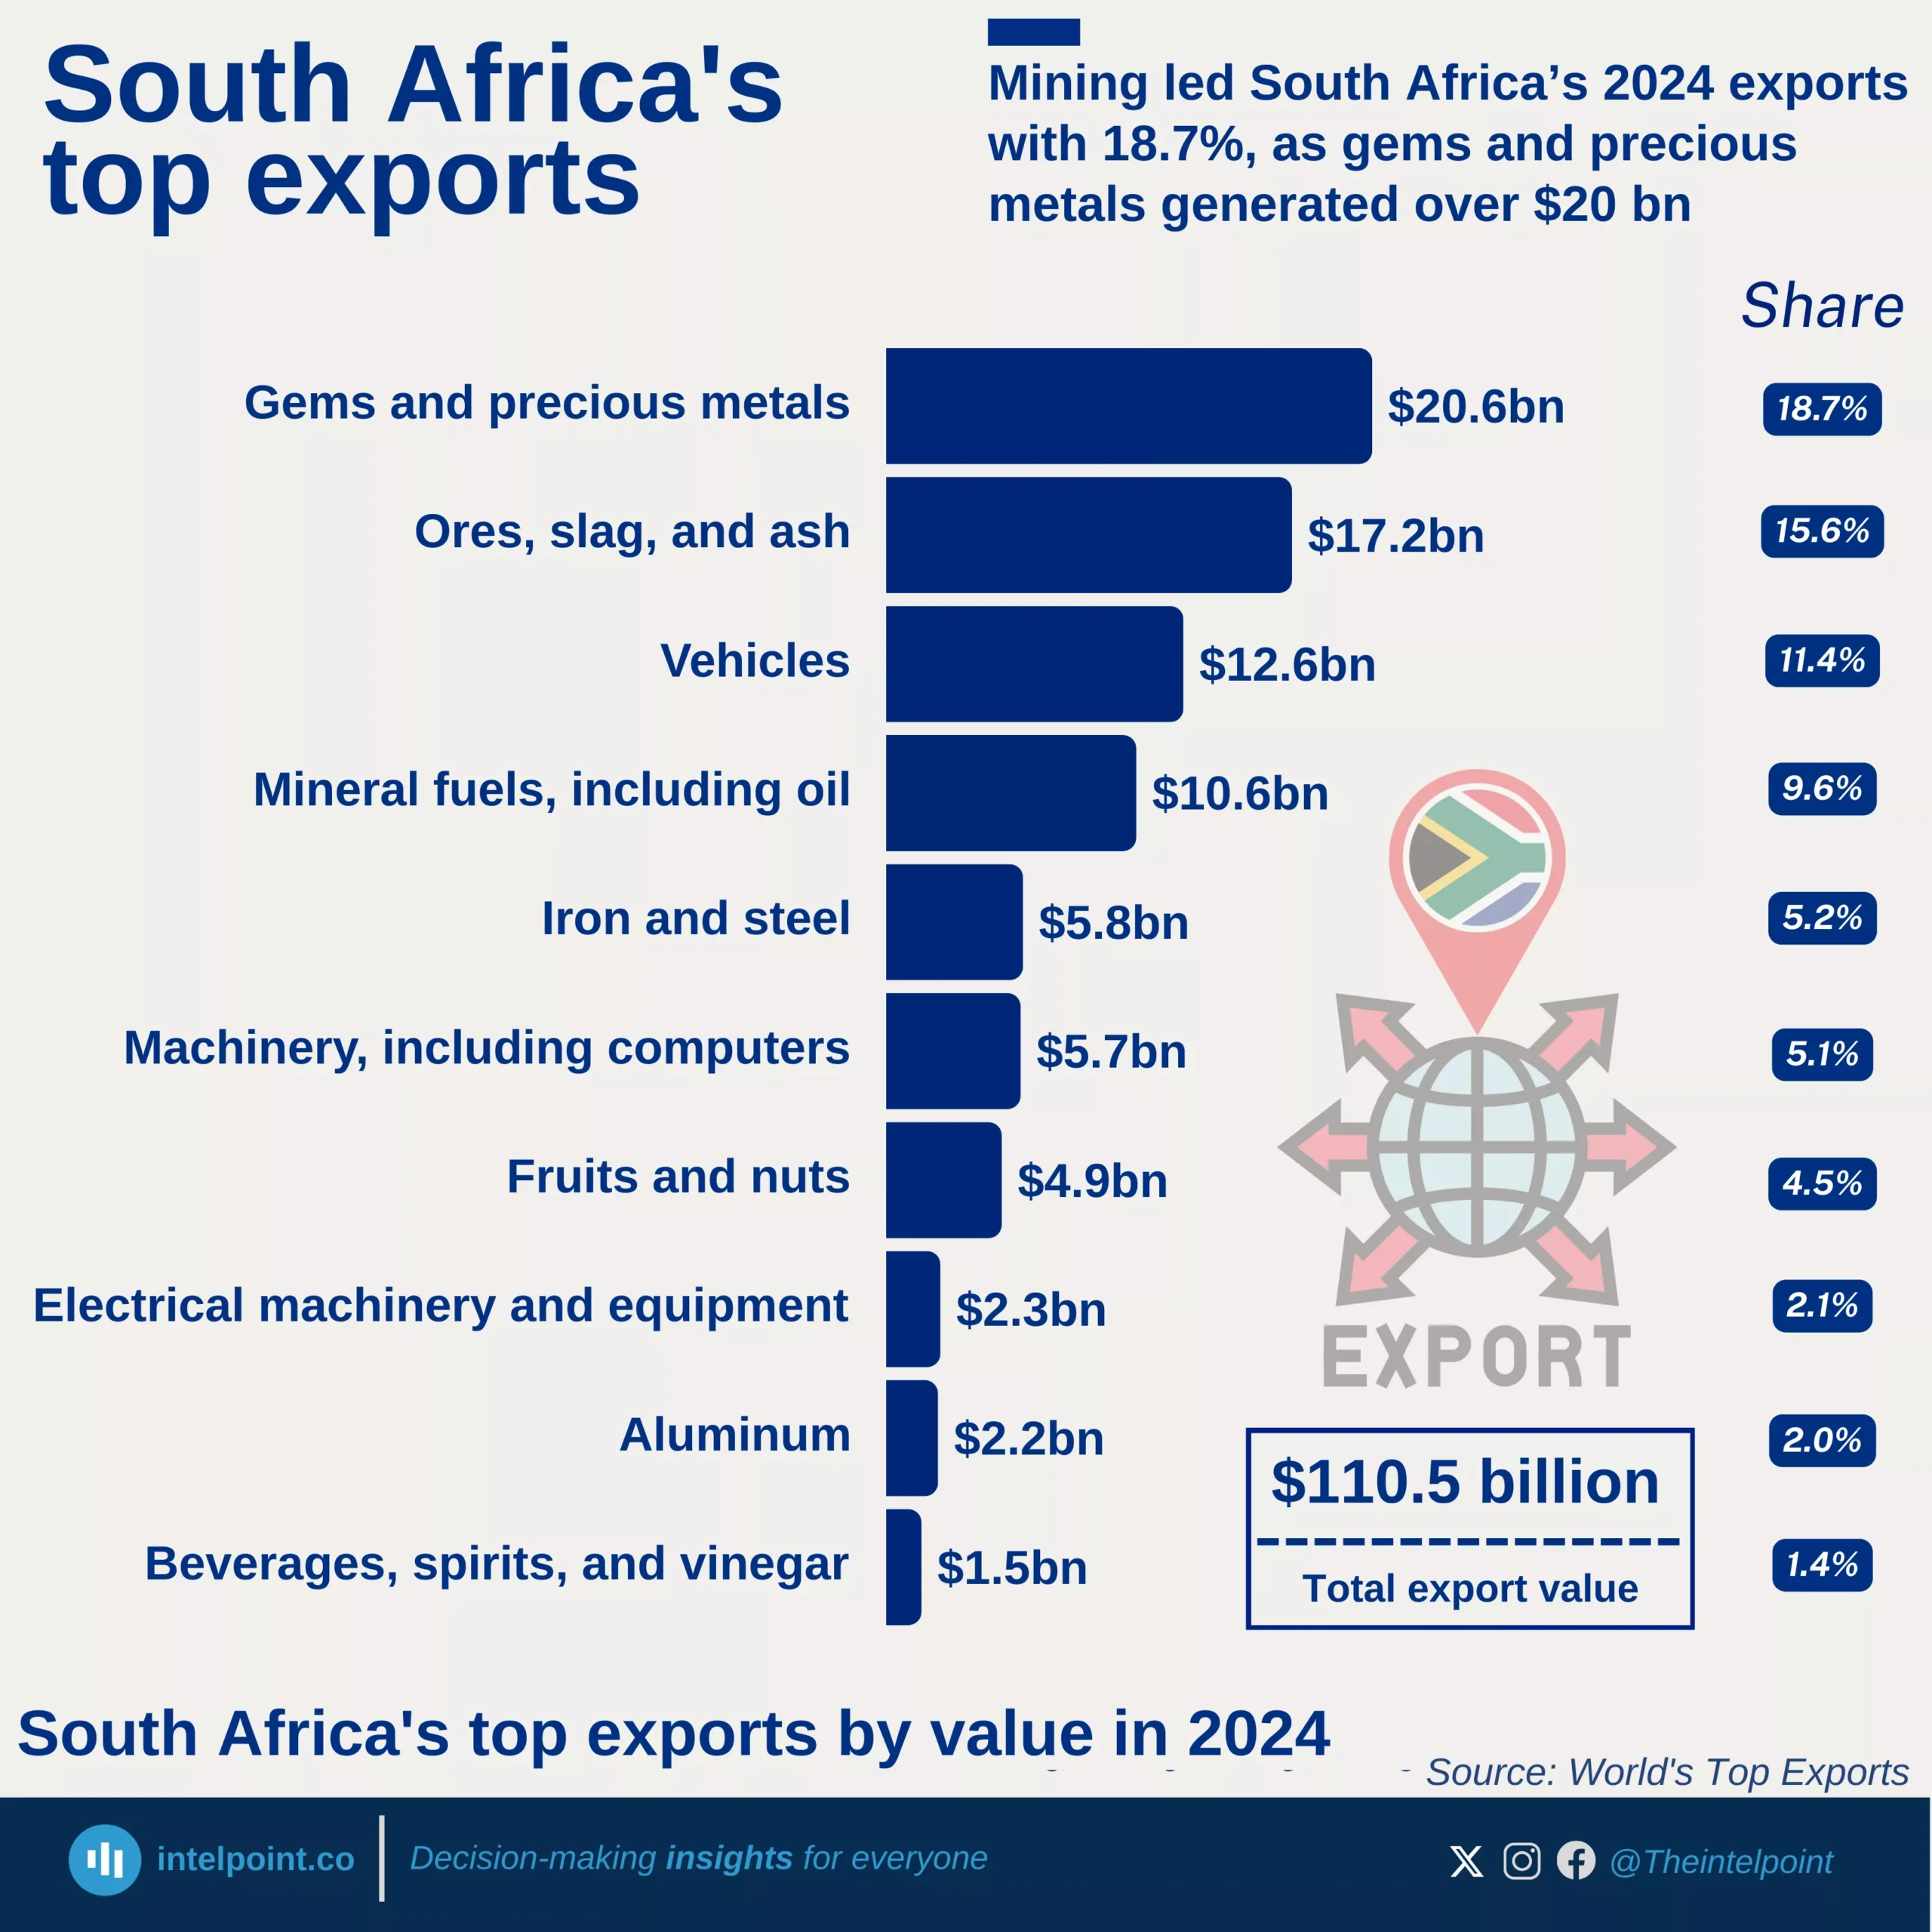
In 2024, South Africa’s export economy was overwhelmingly driven by mineral wealth and industrial output. Gems and precious metals ($20.6 billion) and ores, slag, and ash ($17.2 billion) accounted for nearly 50% of the top ten’s export value, reflecting the country’s strong mining sector.

Vehicles ($12.6 billion) and machinery ($5.7 billion) highlighted the role of manufacturing and industrial capability, while mineral fuels, iron, and steel further reinforced the resource-heavy export base.

Agricultural and consumer goods, including fruits and nuts ($4.9 billion) and beverages ($1.5 billion), played a smaller but strategic role, offering diversification beyond mining and industry.

Overall, this illustrates South Africa’s dual identity as a resource-rich mining hub and a growing industrial exporter, with mining remaining the cornerstone of foreign exchange earnings.

Source:

World's Top Exports

Period:

2024
HTML code to embed chart
Want a bespoke report?
Reach out
Tags
Related Insights

Cocoa accounted for 4.6% of Nigeria’s 2024 exports, making it the country’s second-largest export after oil
  • Mineral fuels (including crude oil) accounted for $49.3 billion, or 86.8% of total exports in 2024.
  • Non-oil exports remained marginal, with the second-largest item, cocoa, contributing only 4.6%.
  • Fertilisers, ores, slag, ash, and oilseeds collectively made up less than 5%, indicating limited diversification.
  • All other export categories each contributed 1% or less, underscoring Nigeria’s narrow export base.

Nigeria's energy goods imports have stayed low and stable for 7 years, while exports increased from ₦37B to ₦263B
  • Nigeria’s energy goods exports rose from ₦37.3B in 2017 to ₦262.9B in 2024, before falling to ₦154.2B in H1 2025.
  • Imports remained consistently low, ranging from ₦24.2M to ₦353.1M throughout the period.
  • Export growth outpaced imports, showing a widening trade surplus in energy goods.
  • The 2024 spike in exports represents the highest export value within the nine-year window.
  • Energy imports stayed below ₦400M yearly, indicating low dependency on foreign energy goods.

For most of the period (2013-H1 2025), China's share of Nigeria's imports from Asia hovers around 50%-55%, showing dominance
  • China has dominated Nigeria’s imports from Asia, maintaining a 50–55% share for most of the period.
  • China’s share reached its highest level at 58.6% in H1 2025.
  • India's import share remained volatile, ranging between 11% and 25%.
  • Total imports from Asia surged from ₦2.6 trillion in 2013 to ₦16.4 trillion in H1 2025.

Nigeria's agricultural imports' share has been dropping, from 83.9% (2017) to a low of 42.9% (H1 2025)
  • Agricultural imports fell from 83.9% in 2017 to 42.9% in H1 2025, indicating a significant decline in import dependency.
  • Agricultural exports grew from 16.1% in 2017 to 54.0% in 2024, surpassing imports for the first time since 2017.
  • Total agricultural trade increased from ₦1.1 trillion in 2017 to ₦8.2 trillion in 2024.
  • Between 2022 and 2024, the import share dropped significantly from 75.7% to 46.0%.

Crude oil imports in Nigeria emerged in H1 2025 (the first since 2017), capturing a 10.2% share of the total crude oil trade
  • Crude oil imports into Nigeria in H1 2025 marked the first occurrence since 2017.
  • Crude oil imports accounted for 10.2% of total crude oil trade.
  • From 2017 to 2024, exports made up 100% of crude oil trade annually.
  • Total crude oil trade peaked at ₦55.3 trillion in 2024.
  • The emergence of crude oil imports can be linked to domestic refinery operations, especially the Dangote Refinery.

Asia and Europe (combined) have consistently represented over 70% of Nigeria's total imports since 2013
  • Asia and Europe have consistently represented over 70% of Nigeria’s imports since 2013.
  • Asia’s share of imports reached a record 53.5% in H1 2025.
  • Europe contributed 23.1% of total imports in H1 2025.
  • Imports from the American region averaged between 10%–14% over the period.
  • Africa’s import share remained below 10%, showing limited regional trade.

POPULAR TOPICS
SIGN UP TO OUR NEWSLETTER
Get periodic updates about the African startup space, access to our reports, among others.
Subscribe Here
Subscription Form

A product of Techpoint Africa. All rights reserved