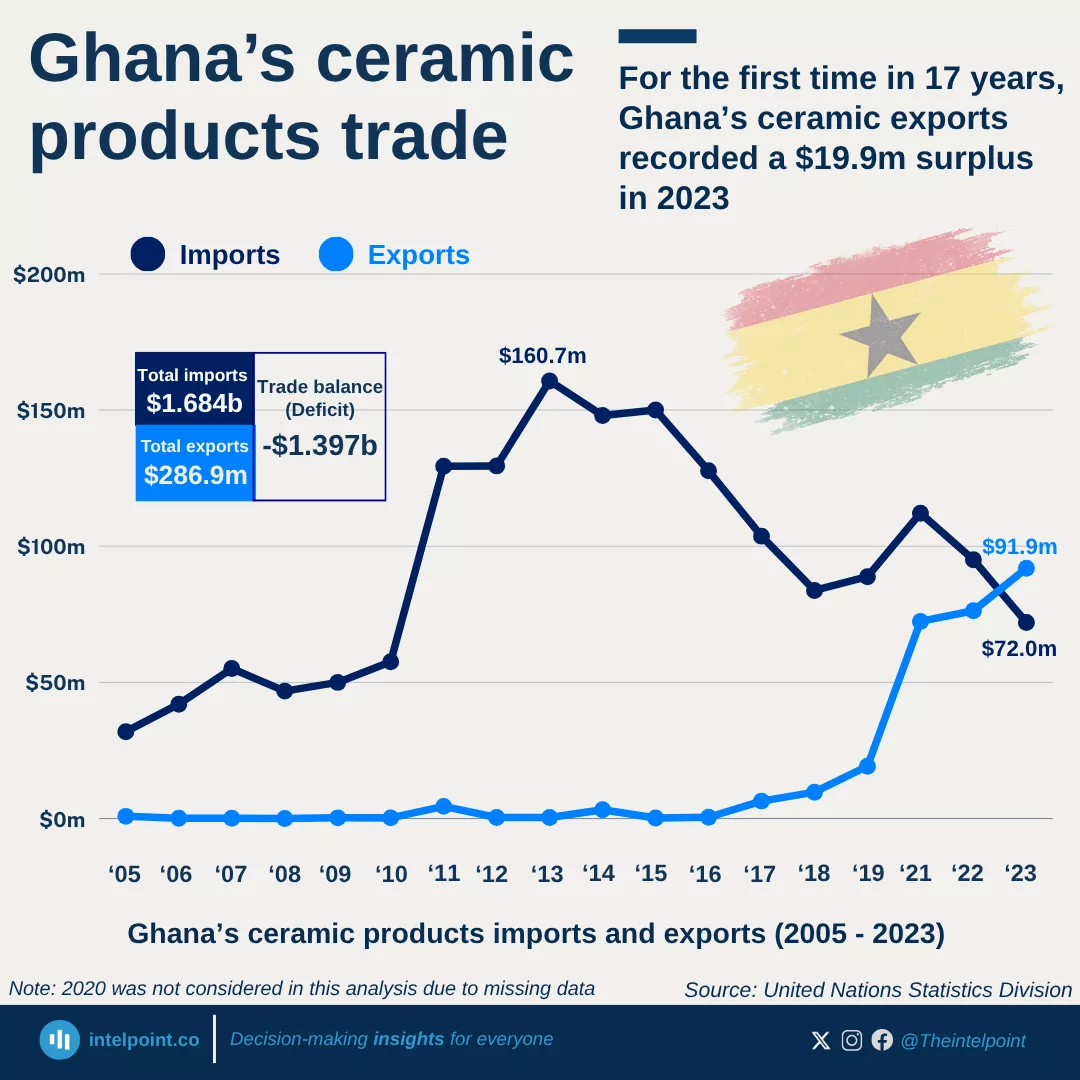
For the first time in 17 years, Ghana’s ceramic exports recorded a $19.9m surplus in 2023
Key takeaways:
In 2023, Ghana recorded $91.9m in ceramic exports, amassing $19.9m profit, after 17 years of consistent trade losses and heavy dependence on imported ceramic products.
For 17 years, Ghana’s ceramic market was largely import-driven, with local industries struggling to compete against foreign products.
Ghana's ceramic products trade recorded $1.397 billion in trade deficit in almost two decades.
Ghana's ceramic industry has finally moved from dependency to a driver of profit and progress.
After nearly two decades of persistent trade deficits, Ghana’s ceramic industry achieved a major economic milestone in 2023, exporting ceramics worth $91.9 million and securing a profit of $19.9 million. The development marks a remarkable turnaround for a sector that had long been overshadowed by heavy import reliance and uncompetitive local production.
For 17 years, Ghana’s ceramic market was largely import-driven, with local industries struggling to compete against foreign products. Between 2005 and 2019, the country consistently recorded massive trade losses, as annual imports outpaced exports. The 2023 figures signal that reforms are yielding tangible results. Increased access to key raw materials for ceramic production, combined with technological upgrades and local capacity building, has helped to boost output and reduce production costs. Ghana’s improved energy supply and strategic partnerships with investors also contributed to the surge in export competitiveness.
However, sustaining this growth will require continued investment in infrastructure, quality standards, and market diversification to avoid a relapse into past trade imbalances. Still, the 2023 data reflects a new chapter for Ghana’s industrial story, one where ceramics have finally moved from a symbol of dependency to a driver of profit and progress.

For 17 years, Ghana’s ceramic market was largely import-driven, with local industries struggling to compete against foreign products. Between 2005 and 2019, the country consistently recorded massive trade losses, as annual imports outpaced exports. The 2023 figures signal that reforms are yielding tangible results. Increased access to key raw materials for ceramic production, combined with technological upgrades and local capacity building, has helped to boost output and reduce production costs. Ghana’s improved energy supply and strategic partnerships with investors also contributed to the surge in export competitiveness.
However, sustaining this growth will require continued investment in infrastructure, quality standards, and market diversification to avoid a relapse into past trade imbalances. Still, the 2023 data reflects a new chapter for Ghana’s industrial story, one where ceramics have finally moved from a symbol of dependency to a driver of profit and progress.