46 African countries get more than 60% of their export earnings from raw goods, with South Sudan leading with 99.5%

  • More than 60% of the countries in Africa are commodity-dependent.
  • South Sudan leads the list with 99.5%.
  • Nigeria’s commodity export dependence is 96.3%, dominated by energy (89.7%), followed by agriculture (4.0%) and mining (2.6%).
  • Africa alone accounts for nearly 47% of all commodity dependent countries globally.

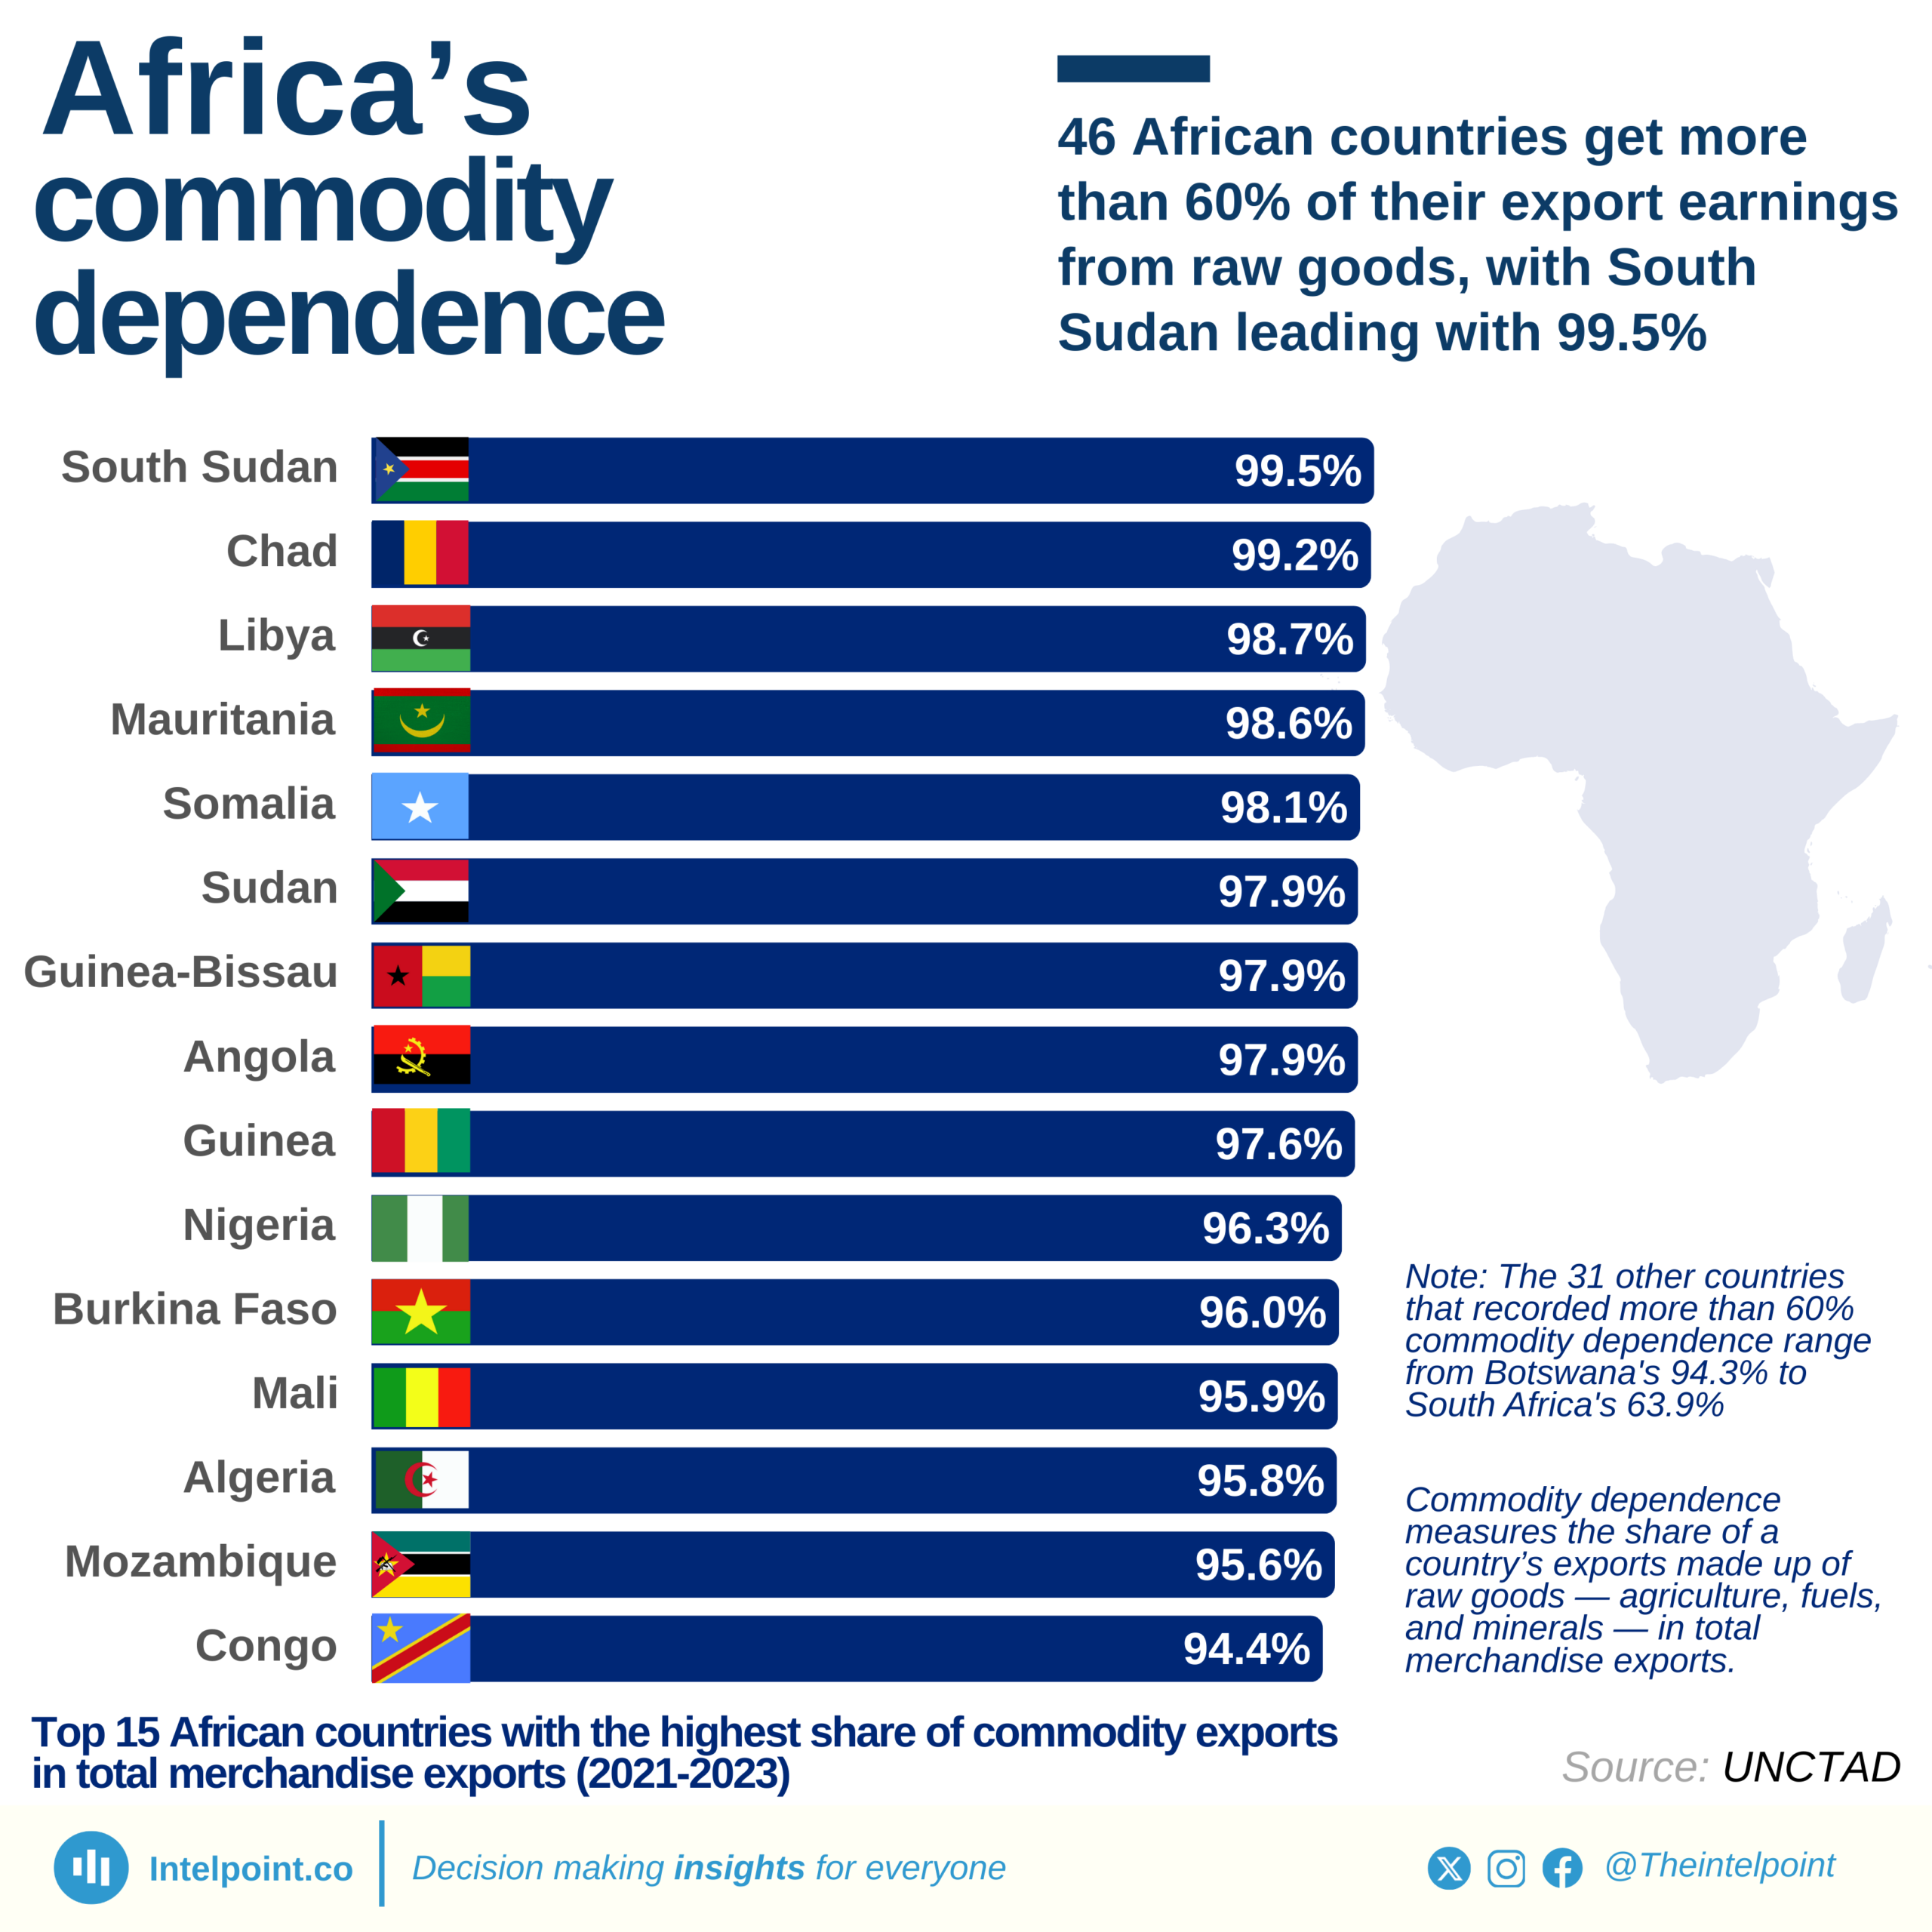
According to UNCTAD, a country is classified as commodity-dependent if over 60% of its merchandise exports come from commodities such as energy, agriculture, or mining. Over 60% of the countries in Africa are commodity-dependent, underscoring the prevalence of reliance on primary exports.

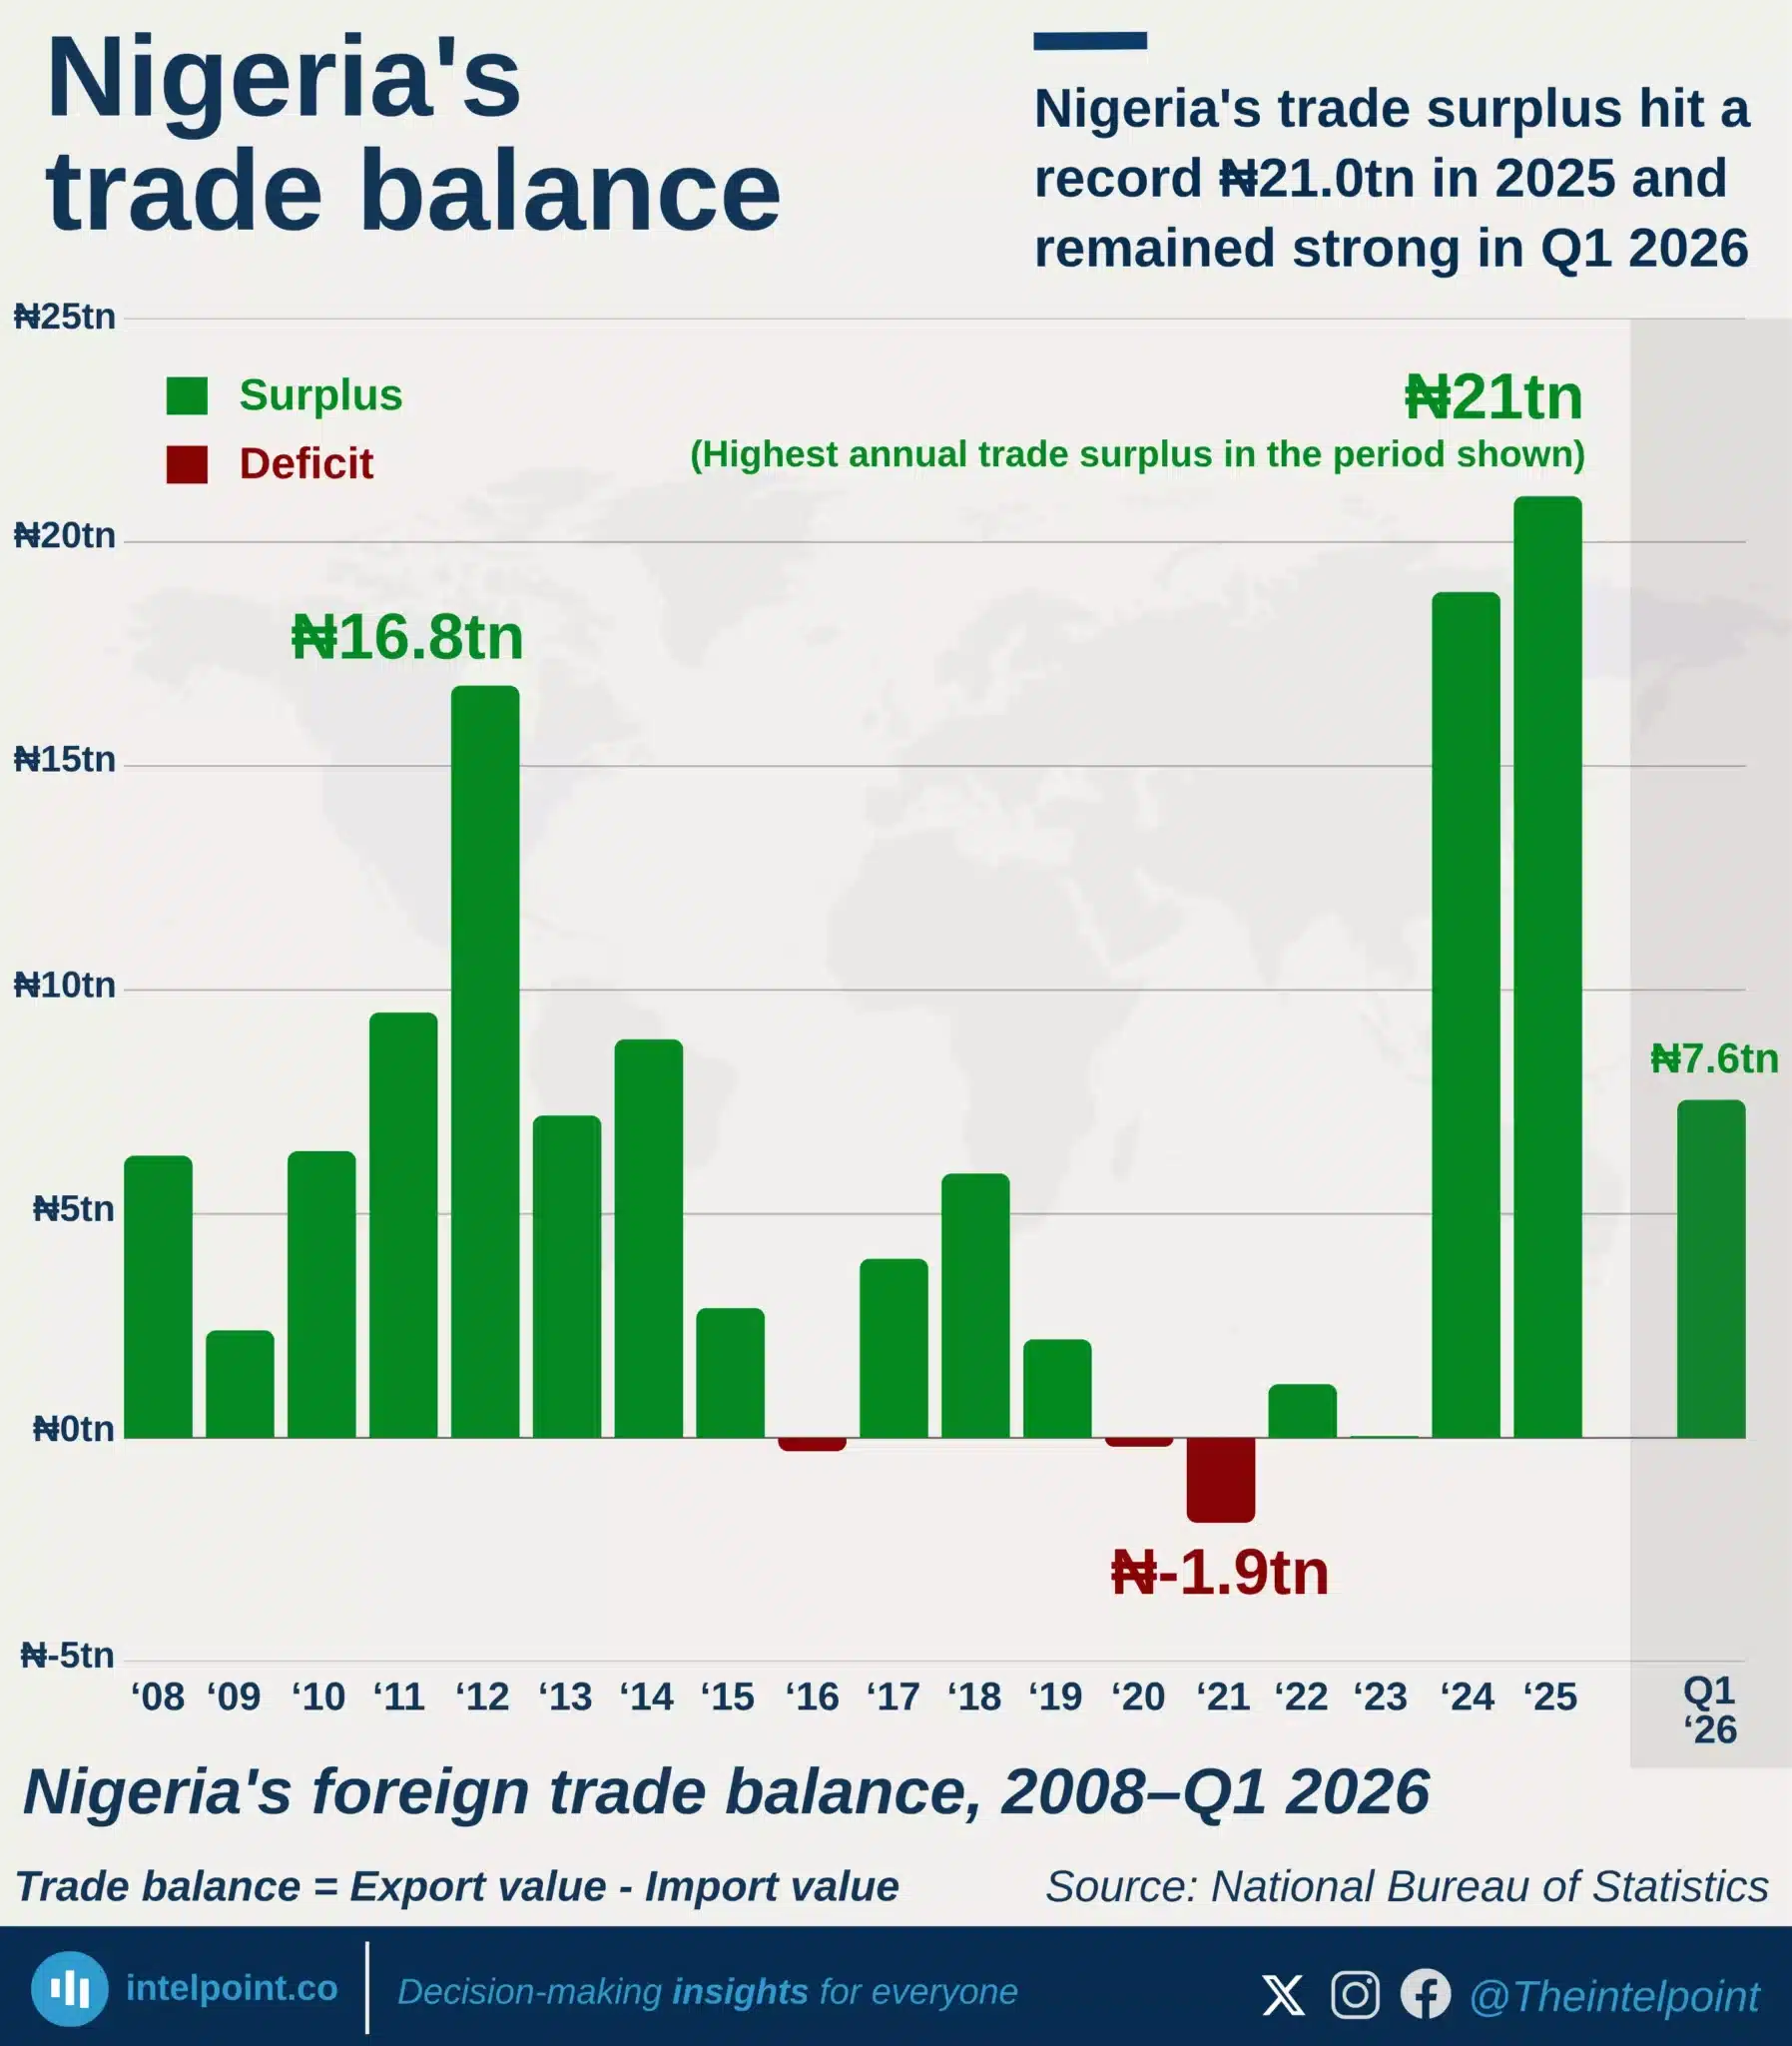
Notably, South Sudan leads the list, with 99.5% of its export revenues derived from commodities, primarily oil (energy/oil - 89.9%, agriculture - 4.6%, mining - 5.0%). Meanwhile, Nigeria’s commodity export dependence is 96.3%, dominated by energy/oil (89.7%), followed by agriculture (4.0%) and mining (2.6%). With energy exports claiming almost nine‑tenths of Nigeria’s trade earnings, the economy remains highly vulnerable to oil price swings. Nigeria’s limited export diversification reflects deep structural challenges, including insufficient value addition in agriculture and mining.

Africa alone accounts for nearly 47% of all commodity-dependent countries globally, highlighting the disproportionate burden borne by the continent. This entrenched dependence undermines resilience, making economies susceptible to external shocks and volatile global markets.

UNCTAD emphasises that value addition and processing raw materials domestically is key to transforming commodity wealth into sustainable development.

Source:

UN Trade and Development (UNCTAD)

Period:

2021-2023
HTML code to embed chart
Want a bespoke report?
Reach out
Tags
Related Insights

The U.S. consistently leads Nigeria’s imports from the Americas, accounting for 57–73% in 13 years
  • The U.S. consistently leads Nigeria’s imports from the Americas, accounting for 57–73% between 2013 and 2025.
  • Brazil ranks second, with shares ranging between 11% and 24%, highlighting its steady trade ties with Nigeria.
  • During the period, the combined share of the U.S. and Brazil never fell below 76%, even at its lowest point in 2022.
  • Total imports from the Americas surged from ₦0.9 trillion in 2013 to a peak of ₦6.3 trillion in 2024.
  • Canada’s import share peaked at 16.4% in 2022, showing a rare moment of diversification.

Nigeria's H1 trade: Imports from ECOWAS countries rose from 12% in H1 2021 to a peak of nearly 40% in H1 2024
  • Imports from ECOWAS countries peaked at 39.9% in H1 2024, up from just 12.0% in H1 2021.
  • The share declined to 32.4% in H1 2025, showing a reversal after the 2024 peak.
  • Total import values grew sharply, from ₦209.6B in H1 2020 to ₦1.8T in H1 2025.
  • In H1 2019, ECOWAS already had a decent share of 19.6%, showing long-standing but fluctuating trade ties.

The ECOWAS share of Nigerian exports to African countries nearly doubled, from 34.2% to 62.1%
  • ECOWAS’ share of Nigerian exports rose from 34.2% in H1 2019 to 62.1% in H1 2025.
  • The most significant share came in H1 2022, when ECOWAS accounted for 75.8% of exports.
  • Exports to other African countries dropped significantly in 2022, to just 24.2%.
  • Nigeria’s total exports to Africa grew from ₦0.9T in H1 2022 to ₦4.8T in H1 2025.
  • ECOWAS consistently maintained a majority share from H1 2022 onwards, with a share above 60%.

Nigeria’s exports remain oil-dominated, but non-oil exports are steadily rising—reaching up to 18% in early 2025
  • Oil exports continued to dominate, averaging over 88% of total exports in 2024 and remaining above 81% in the first half of 2025.
  • Non-oil exports rose gradually, from a low of 6.9% (February 2024) to a high of 18.1% (January 2025).
  • Peaks in non-oil export contributions occurred in July 2024 (16.4%) and January–April 2025 (13–18%), indicating progress toward diversification.
  • Total exports remained heavily oil-driven, though sustained double-digit non-oil shares in late 2024 and early 2025 show a slow shift.

After a decline from 13.1% in 2019, the non-oil export share grew by 5.6 percentage points, from 8.7% (2023) to 14.3% (2025)
  • Non-oil exports rose to 14.3% of total exports in 2025, up from 8.7% in 2023.
  • Oil exports still represent 85.7% of total exports in 2025.
  • The non-oil share reached 13.1% in 2019 before dipping and rebounding by 2025.
  • Nigeria’s total exports expanded from ₦9.6 trillion in 2015 to ₦43.3 trillion in H1 2025, showing strong value growth.
  • The lowest non-oil share in the decade occurred in 2016 (4%), reflecting heavy oil dependence.

China dominates Nigeria’s imports while Spain leads as top export destination in Q2 2025
  • China remains Nigeria’s largest import partner, accounting for ₦4.96T or 32.45% of total imports—more than double the U.S.'s share.
  • The United States holds second place in imports, contributing ₦2.16T (14.12%), while India, the Netherlands, and the UAE follow with smaller shares below 6%.
  • Spain tops Nigeria’s export market, receiving ₦2.47T worth of goods, representing 10.85% of total exports.
  • Europe features strongly among export partners, with Spain, France, and the Netherlands together absorbing nearly a quarter of Nigeria’s outbound trade.

POPULAR TOPICS
SIGN UP TO OUR NEWSLETTER
Get periodic updates about the African startup space, access to our reports, among others.
Subscribe Here
Subscription Form

A product of Techpoint Africa. All rights reserved