Access Bank reported the highest total salaries paid among selected Nigerian banks in 2024, reaching ₦357.6B

  • Access Bank paid the highest total salaries in 2024, amounting to ₦357.6 billion.
  • Stanbic IBTC devoted the largest share of its revenue to salaries at 9.96%, despite a much lower total salary bill than Access or FirstHoldCo.
  • Zenith Bank had one of the highest salary bills (₦137.7 billion) but spent the smallest portion of its revenue on staff at just 3.47%.
  • Wema Bank, though paying the lowest in total salaries (₦33.8 billion), had one of the highest salary-to-revenue ratios at 7.81%.
  • FirstHoldCo, with ₦229.1 billion in staff costs, maintained a moderate salary-to-revenue ratio of 7.14%.
  • The gap between total salary spend and salary-to-revenue ratios reveals more about each bank’s internal cost structure.

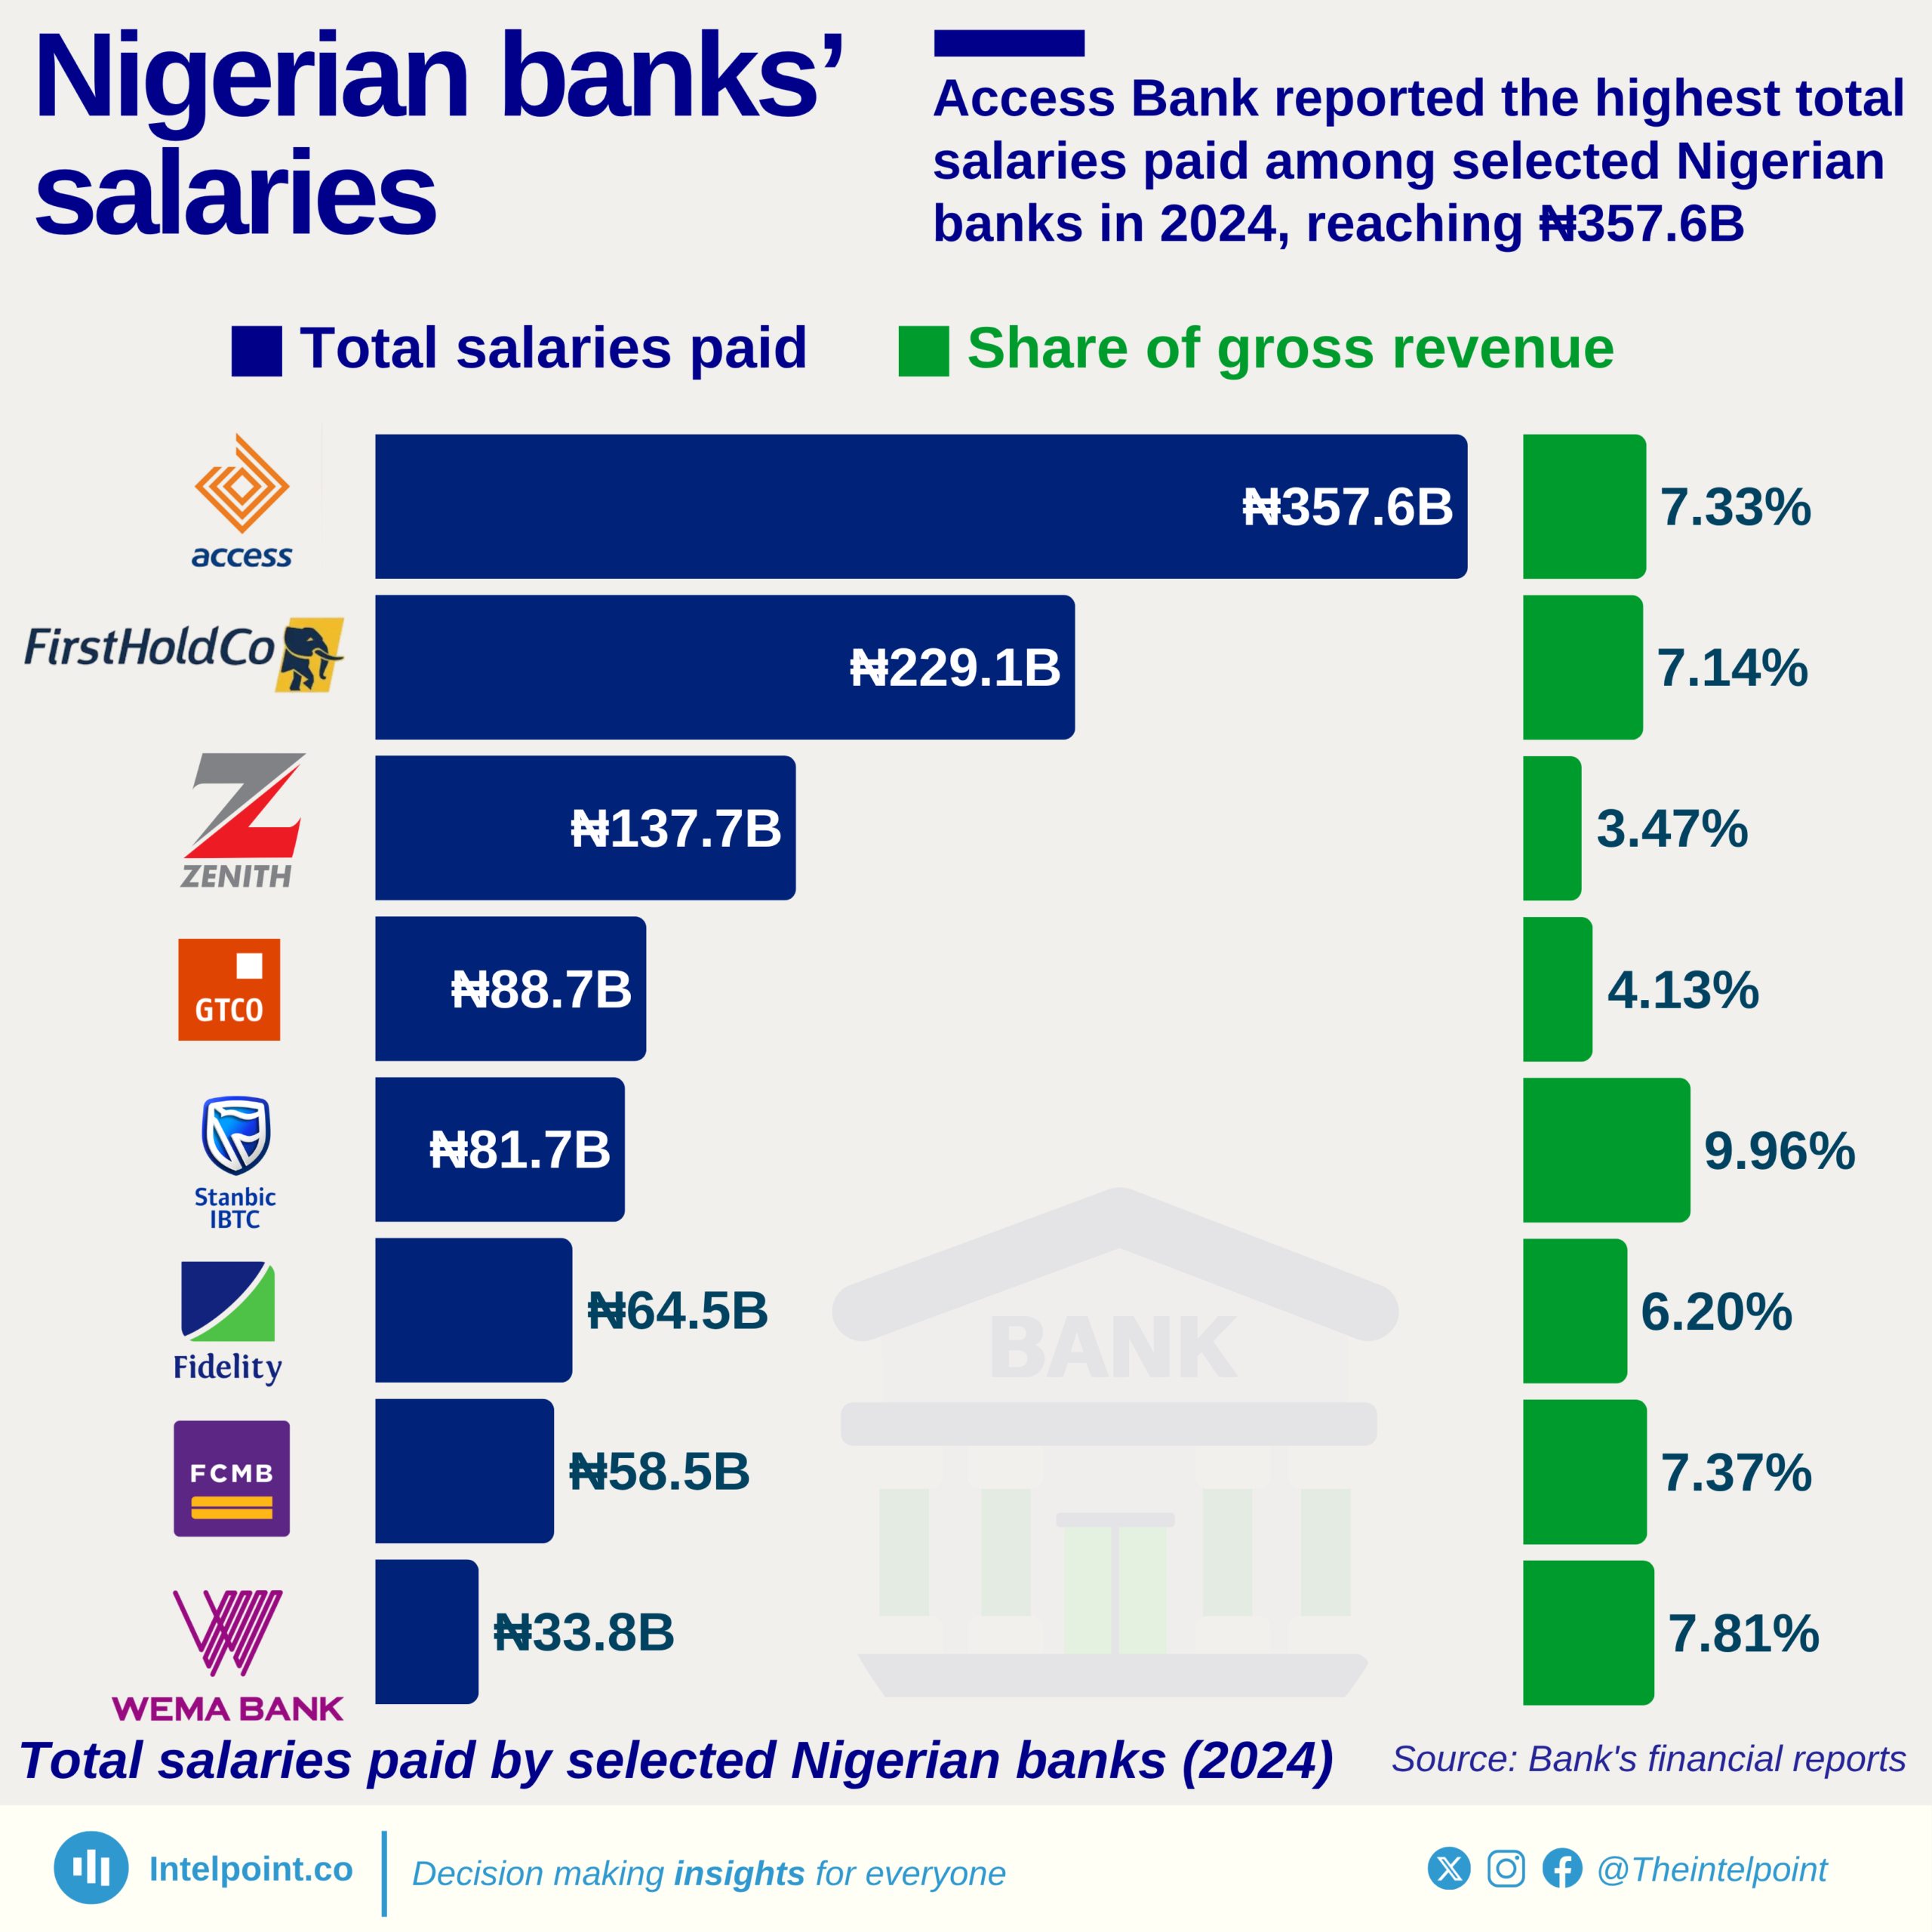
Access Bank, led in 2024, paid the highest total staff salaries among selected Nigerian banks, reaching ₦357.6 billion. This salary outlay accounted for 7.33% of its gross revenue, indicating both the scale of its operations and the size of its workforce. It was followed by First Bank’s holding company (FirstHoldCo), which paid ₦229.1 billion in staff salaries—just over 7% of its gross revenue.

While Access Bank paid the most in naira terms, Stanbic IBTC stood out with the highest salary-to-revenue ratio at 9.96%, meaning nearly one-tenth of its total earnings went to staff salaries. This suggests a more compensation-heavy structure, potentially due to a smaller workforce or stronger emphasis on human capital per unit of revenue. On the other hand, Zenith Bank’s salary spend stood at ₦137.7 billion, accounting for only 3.47% of its gross revenue—the lowest among the listed banks, indicating a leaner cost structure or higher gross income.

Source:

Banks’ audited financial reports

Period:

2024
HTML code to embed chart
Want a bespoke report?
Reach out
Tags
Related Insights

Total microfinance deposits in Kenya only grew 1.66% CAGR over 10 years, ending at KSh 43.0B
  • Microfinance deposits in Kenya grew at only 1.66% CAGR between 2014 and 2024.
  • The peak occurred in 2021 at KSh 50.2B, after which deposits began a steady decline.
  • 2015 (+13.2%) and 2020 (+12.3%) posted the strongest year-on-year growth rates.
  • The sector saw consecutive contractions from 2022 (-7.3%), 2023 (-5.7%), to 2024 (-2.0%).
  • Despite small rebounds in 2018 (+7.3%) and 2019 (+12.3%), the long-term trend is weak.

Microfinance banks in Kenya have consistently posted losses since 2016, reaching KSh -3.5B in 2024
  • Microfinance banks in Kenya recorded their last profit in 2015 (KSh 0.6B) before sliding into losses.
  • The sector’s losses deepened from KSh -0.4B in 2016 to KSh -3.5B in 2024.
  • The steepest single-year decline occurred in 2020, when losses increased by 560.8% to KSh -2.2B.
  • Even in recovery years like 2019 (KSh -0.3B) and 2021 (KSh -0.7B), the sector remained in losses.
  • Over the 10 years, profitability fell at a -212.1% CAGR, reflecting a structural collapse.
  • Since 2016, there has been no single year of profit, highlighting sustained weakness.
  • The worsening losses mirror other sector struggles, such as stagnant deposits, weak asset growth, and rising NPLs.

Kenya’s microfinance banks’ total assets over the years have ranged from KSh 57.0B to KSh 76.4B (2014–2024), standing at KSh 57.9B in 2024
  • Kenya’s microfinance assets grew by just 1.62% between 2014 and 2024.
  • The sector peaked in 2019 at KSh 76.4B, before entering a steady decline.
  • 2023 (-8.8%) and 2024 (-9.8%) posted the steepest year-on-year declines.
  • The sector recorded only two notable growth spikes: 2015 (+21.9%) and 2019 (+7.9%).
  • Overall, the trend from 2020 onward shows persistent contraction in asset value.

After years of growth, Kenyan banks’ asset value declined by 1.6% to KSh 7.6T in 2024
  • Kenyan banks’ total assets grew by 56.6% between 2019 and 2024.
  • In 2024, assets declined slightly by 1.6%, the first drop in five years.
  • The sector recorded consistent growth from 2019 to 2023 before dipping in 2024.
  • The highest growth came in 2023, when assets surged 17.6% to KSh 7.7T.
  • Assets rose from KSh 4.8T in 2019 to KSh 7.6T in 2024.
  • Despite the 2024 dip, banks added nearly KSh 3 trillion in assets over the five years.

Kenyan banks' PBT grew 62.8% over five years, from KSh 159.9B to KSh 260.3B
  • Kenyan banks’ Profit-Before-Tax (PBT) grew by 62.8% between 2019 and 2024.
  • Total PBT rose from KSh 159.9B in 2019 to KSh 260.3B in 2024.
  • The lowest point was in 2020, when profits dropped to KSh 112.8B, a 29.5% decline.
  • Banks recorded their strongest recovery in 2021 with a 73.2% increase in PBT.

Kenya’s mobile banking fraud in 2024 exposed KES 981.7 billion, leading to losses of KES 810.7 billion
  • Kenya’s total fraud exposure in 2024 hit KES 2.0T, with KES 1.6T actually lost.
  • Mobile banking fraud was the largest contributor, with KES 981.7B exposed and KES 810.7B lost.
  • Mobile banking had an 82.6% loss rate, making it one of the riskiest fraud channels.
  • Computer fraud and internet scams recorded 100% loss rates, showing no funds were recovered.
  • Identity theft saw 97.9% of exposed amounts lost, translating to KES 199.1B.
  • Card fraud had a lower loss rate (59.9%) but still cost banks and customers KES 263.3B.

POPULAR TOPICS
SIGN UP TO OUR NEWSLETTER
Get periodic updates about the African startup space, access to our reports, among others.
Subscribe Here
Subscription Form

A product of Techpoint Africa. All rights reserved