Africa's reserves, peaking at $560 billion in 2013, declined to $397 billion in 2022

  • In 2013, Africa’s total reserves stood at $560 billion, the highest recorded in the past decade.
  • A steady decline followed, with reserves dropping to $402 billion by 2016.
  • A moderate recovery began in 2017 at $426 billion, stabilising around $400 billion in recent years.
  • As of 2022, Africa’s total reserves were estimated at $397 billion.
  • Despite fluctuations, Africa’s reserves have hovered around $400 billion since 2019.

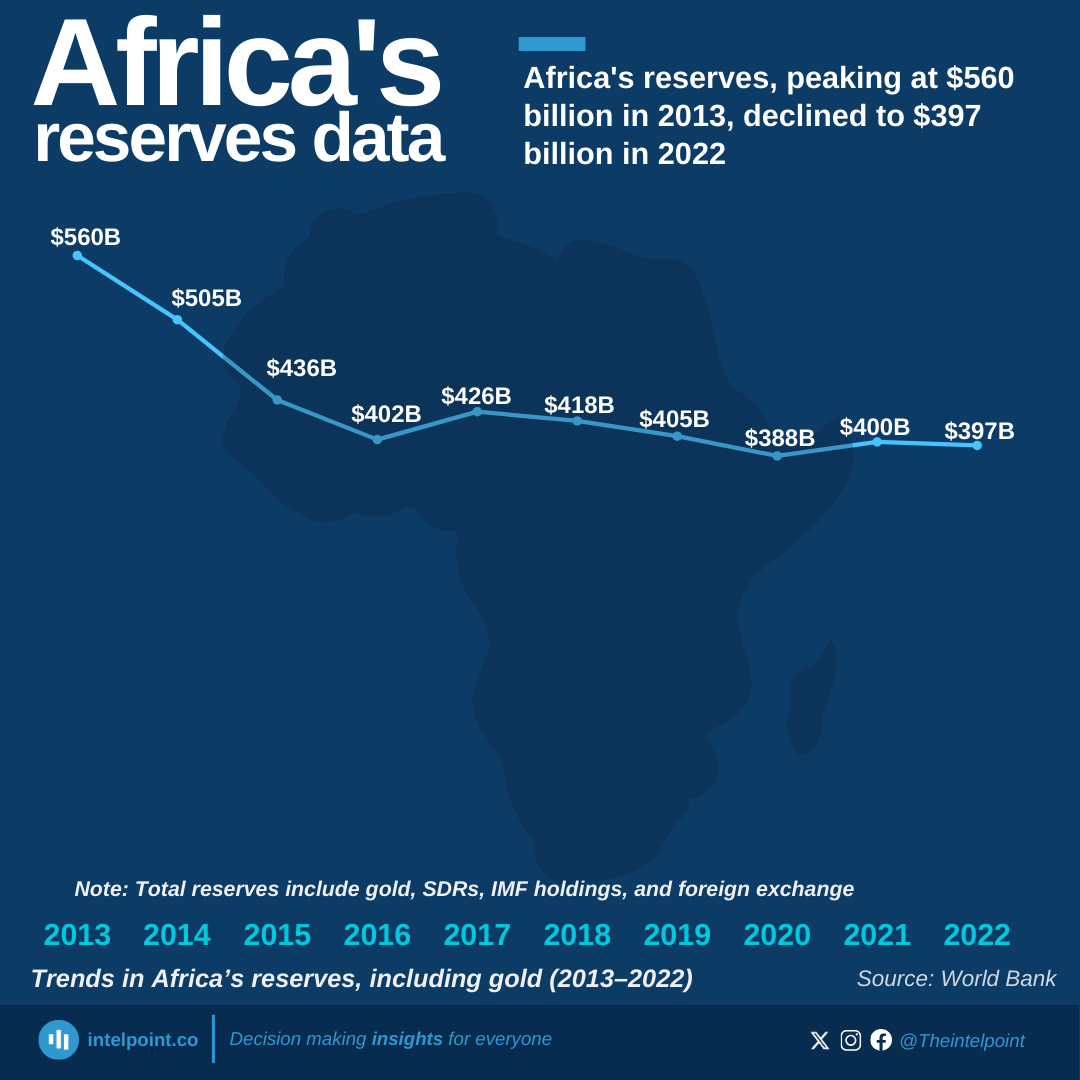
Africa’s reserves, including monetary gold, have experienced fluctuations over the past decade. In 2013, Africa’s total reserves peaked at $560 billion, the highest recorded in the past decade. However, this period of strength was followed by a steady decline, with reserves falling to $402 billion by 2016. The continent then saw a moderate recovery, beginning in 2017 when reserves rose to $426 billion. This recovery has since stabilised around the $400 billion mark, with 2022 marking a slight dip to $397 billion. This recent dip highlights the ongoing volatility, underscoring the need for Africa to diversify its economic strategies. Despite the fluctuations, Africa’s reserves have remained relatively steady, hovering around $400 billion since 2019.

Source:

World Bank

Period:

2013–2022
HTML code to embed chart
Want a bespoke report?
Reach out
Tags
Related Insights

Nigeria’s slice of Africa’s economy since independence: From a peak of 31% to 7% in 2024
  • At independence in 1960, Nigeria contributed about 10% of Africa’s GDP, establishing itself early as one of the continent’s largest economies.
  • Nigeria’s share peaked at 31% in 1981 during the oil boom, highlighting the dramatic impact of natural resources on the economy.
  • Between the mid-1980s and 2000s, Nigeria’s share fluctuated significantly, dropping to 9.2% in 1999 due to political instability, economic mismanagement, and external shocks.
  • By 2024, Nigeria’s share fell to 7.1%, despite a GDP of $187.8 billion, showing slower relative growth compared to other African economies and the ongoing need for economic diversification.
  • This share reflects Nigeria’s relative position in Africa’s economy over time, showing how it moved in relation to the growth of the rest of the continent.

Ghana's GDP
  • From 2013 to 2024, the services sector has consistently dominated Ghana’s GDP, while agriculture has remained the smallest sector.
  • A weak agriculture sector can make Ghana more dependent on food imports.
  • Agriculture’s stagnation reduces its role as a labour buffer.

Nigeria’s slice of Africa’s economy since independence: From a peak of 31% to 7% in 2024
  • At independence in 1960, Nigeria contributed about 10% of Africa’s GDP, establishing itself early as one of the continent’s largest economies.
  • Nigeria’s share peaked at 31% in 1981 during the oil boom, highlighting the dramatic impact of natural resources on the economy.
  • Between the mid-1980s and 2000s, Nigeria’s share fluctuated significantly, dropping to 9.2% in 1999 due to political instability, economic mismanagement, and external shocks.
  • By 2024, Nigeria’s share fell to 7.1%, despite a GDP of $187.8 billion, showing slower relative growth compared to other African economies and the ongoing need for economic diversification.
  • This share reflects Nigeria’s relative position in Africa’s economy over time, showing how it moved in relation to the growth of the rest of the continent.

Yams produced in Nigeria in 2023 were valued at $25.4b, the highest among major reported commodities
  • After yielding 61.9 million tonnes, yams were valued at $25.4 billion in 2023, the highest among reported commodities.
  • With 62.7 million tonnes produced, cassava generated $9.1 billion, making it the second most valuable crop.
  • Okra ($818/t), tomatoes ($808/t), and pineapples ($753/t) earned the highest returns per unit despite smaller volumes (1.6–3.8 million tonnes).
  • Maize ($3.7 b, 11.1 m t), rice ($3.1 b, 8.9 m t), sorghum ($2.3 b, 6.4 m t), cowpeas ($1.2 b, 4.3 m t), and groundnuts ($0.9 b, 4.3 m t) form the backbone of production.

The basket of food that cost ₦100k in January 2025 cost approximately ₦114k in August
  • Food prices rose roughly 13.9% from January to August 2025, according to the rebased Consumer Price Index (CPI) from the National Bureau of Statistics.
  • Month-on-month inflation for food fluctuated, with some months seeing sharper increases than others.
  • Using January as a baseline, the purchasing power of money for food declined steadily, meaning households need more naira to buy the same items.
  • Food carries a large weight in the CPI basket, making it a major driver of overall inflation and cost-of-living increases.

Trade and agriculture led Nigeria’s ₦51.20 trillion economy in Q2 2025, as oil’s share remained modest
  • Trade contributed 18.28%, making it the largest sector in Q2 2025's GDP.
  • Crop production followed with 17.8%, underscoring agriculture’s central role.
  • Oil and gas added just 4.05%, highlighting its shrinking share compared to non-oil sectors.
  • Real estate and telecoms reinforced the growing strength of services in the Nigerian economy.

POPULAR TOPICS
SIGN UP TO OUR NEWSLETTER
Get periodic updates about the African startup space, access to our reports, among others.
Subscribe Here
Subscription Form

A product of Techpoint Africa. All rights reserved