From 2011 to 2022, the highest total revenue recorded by the Nigerian government was in 2011, reaching 17.73%

Key Takeaways:

  • Nigeria's total revenue decreased from 17.73% of GDP in 2011 to 9.09% in 2022.
  • The lowest point for the country’s revenue occurred in 2016, at only 5.12% of GDP.
  • Although there has been some recovery since 2016, revenue still falls well below the levels seen before 2015.
  • The sharpest decline took place between 2011 and 2016, with revenue dropping by over 12 percentage points.
  • In 2020, during the COVID-19 pandemic, there was a significant drop to 6.52%, followed by a period of recovery.

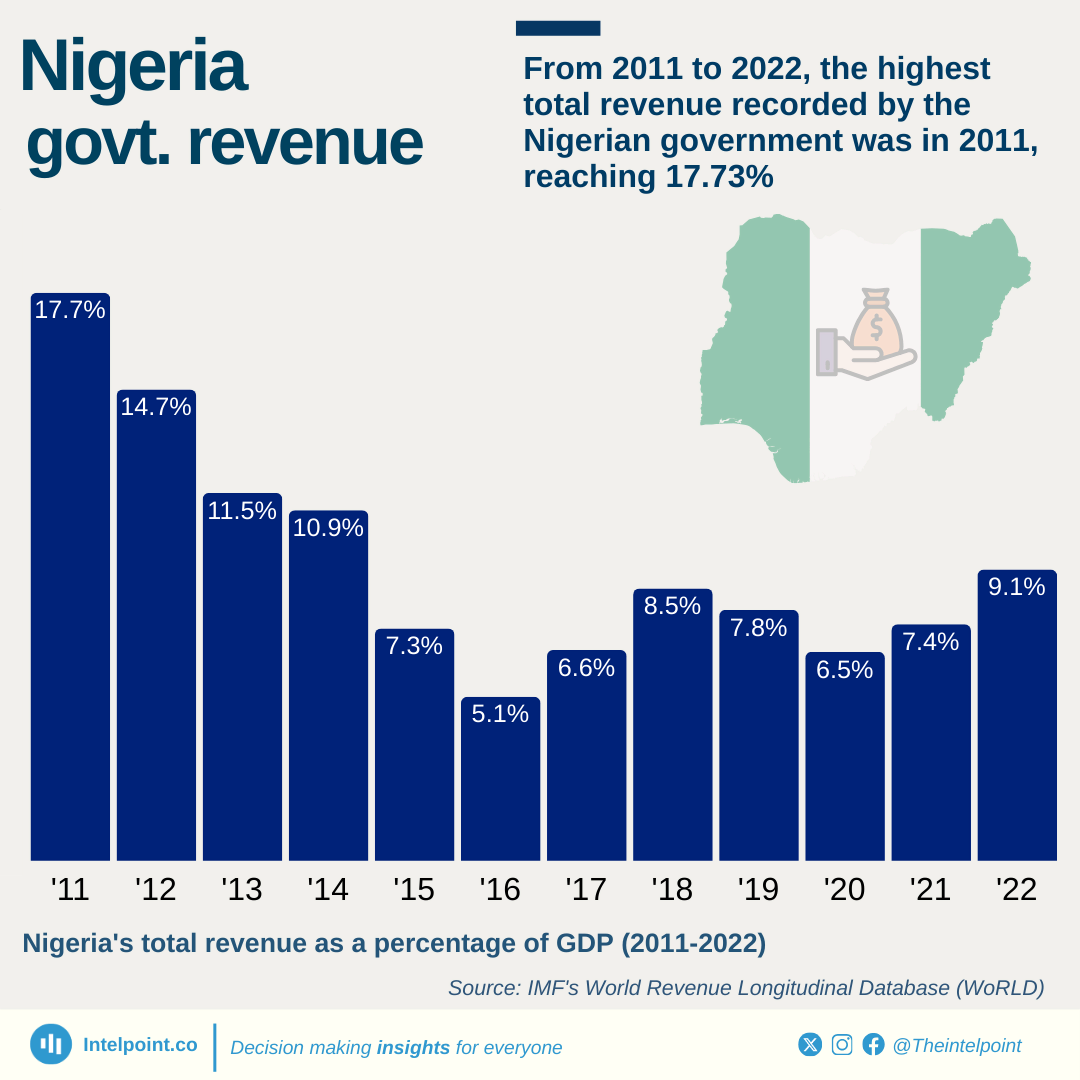
Between 2011 and 2016, Nigeria saw its total revenue as a share of GDP drop dramatically from 17.73% to 5.12%. This reduction can be linked to factors such as the volatility of oil revenues, which play a crucial role in Nigeria's economy, as well as challenges in domestic revenue mobilisation.

The following years saw some gradual recovery, with the ratio climbing to 9.09% in 2022. While this is an improvement from the 2016 low, it remains considerably below the figures reached in the early 2010s and is nearly half of what the country realised in 2011.

Source:

IMF's World Revenue Longitudinal Database (WoRLD)

Period:

2011 - 2022
HTML code to embed chart
Want a bespoke report?
Reach out
Tags
Related Insights

Borno records lowest domestic debt in North-East Nigeria at ₦22.3 billion in Q2 2025
  • The six North-Eastern states collectively owe around ₦450 billion in domestic debt as of Q2 2025.
  • Borno State maintains the lowest debt in the region at ₦22.3 billion, showing signs of controlled borrowing amid post-conflict rebuilding.
  • Bauchi State has the highest domestic debt burden of ₦143.6 billion, accounting for about 31% of the region’s total.
  • The top three states, Bauchi, Taraba and Gombe, collectively account for more than two-thirds of the zone’s total subnational debt stock.

In just six months, Nigeria spent over $2.3 billion servicing external debts
  • Nigeria paid $816.3 million to the International Monetary Fund, accounting for over 35% of total external debt service payments.
  • Eurobond payments followed closely, with $687.8 million paid, reflecting Nigeria’s heavy reliance on commercial debt instruments.
  • Multilateral lenders like IDA and AfDB collectively received about $463 million, signalling continued exposure to concessional financing.
  • China’s share shrinking: Payments to Chinese lenders (EXIM + CDB) totalled $235.6 million, less than 11% of total outflows, suggesting reduced Chinese debt servicing in H1 2025.

Over 60% of Nigeria’s ₦1.7 trillion domestic debt service in Q2 2025 was spent on Federal Government Bonds
  • FGN bonds dominated: ₦1.07 trillion went to Federal Government Bonds, accounting for about 63% of total domestic debt servicing.
  • Treasury bills followed: Payments on NTBs reached ₦537.9 billion, making up roughly 31% of the total.
  • Sukuk and promissory notes together cost ₦90.8 billion, reflecting Nigeria’s mix of infrastructure and settlement instruments.
  • Green and savings bonds remained minimal, together below ₦5 billion, showing limited traction for retail and sustainability-focused debt.

93% of Nigeria's public debt is owed by the Federal Government
  • The Federal Government’s share of total public debt rose from 79.5% in 2019 to 92.6% in 2025.
  • States’ share has more than halved, from 20.5% to 7.4% in six years.
  • Total public debt grew from $83.9 billion to $99.7 billion, peaking at $113.4 billion in 2023.
  • Nigeria’s debt burden is increasingly concentrated at the centre, amplifying federal repayment risks and reducing fiscal independence for states.

Over 60% of Nigerians use crypto for savings and long-term investing
  • Wealth-building dominates motivation: 45.4% cite “active wealth building” as their primary motive, and an additional 21.8% cite “long-term financial security”.
  • Payments and utility are minor drivers: Only 3.3% report “daily utility” and 2.2% “digital commerce” as their chief motive for using crypto.
  • Hedging and cross-border flows matter: 8.7% use crypto for currency hedging, and 4.1% for cross-border payments, showing a dual role of investment plus international value flows.
  • Nigerian retail users treat crypto like a conventional financial instrument rather than only as a means of payment or speculation.

Over 65% of surveyed Nigerian crypto users transact below ₦50,000; less than 3% move above ₦1 million
  • Nearly two-thirds (67%) of all crypto transactions in Nigeria are below ₦50,000, reflecting widespread use among everyday retail users.
  • The ₦15,000–₦25,000 band (28.2%) is the single largest group, showing consistent, small-scale engagement rather than high-value speculation.
  • Around 25% of users transact between ₦50,000 and ₦250,000, suggesting a growing middle class of more confident, mid-level investors.
  • Less than 3% of users transact above ₦1 million, confirming that Nigeria’s crypto market remains primarily retail-driven, not institutional or high-net-worth.

POPULAR TOPICS
SIGN UP TO OUR NEWSLETTER
Get periodic updates about the African startup space, access to our reports, among others.
Subscribe Here
Subscription Form

A product of Techpoint Africa. All rights reserved