China dominates Nigeria’s imports while Spain leads as top export destination in Q2 2025

Key Takeaways

  • China remains Nigeria’s largest import partner, accounting for ₦4.96T or 32.45% of total imports—more than double the U.S.'s share.
  • The United States holds second place in imports, contributing ₦2.16T (14.12%), while India, the Netherlands, and the UAE follow with smaller shares below 6%.
  • Spain tops Nigeria’s export market, receiving ₦2.47T worth of goods, representing 10.85% of total exports.
  • Europe features strongly among export partners, with Spain, France, and the Netherlands together absorbing nearly a quarter of Nigeria’s outbound trade.

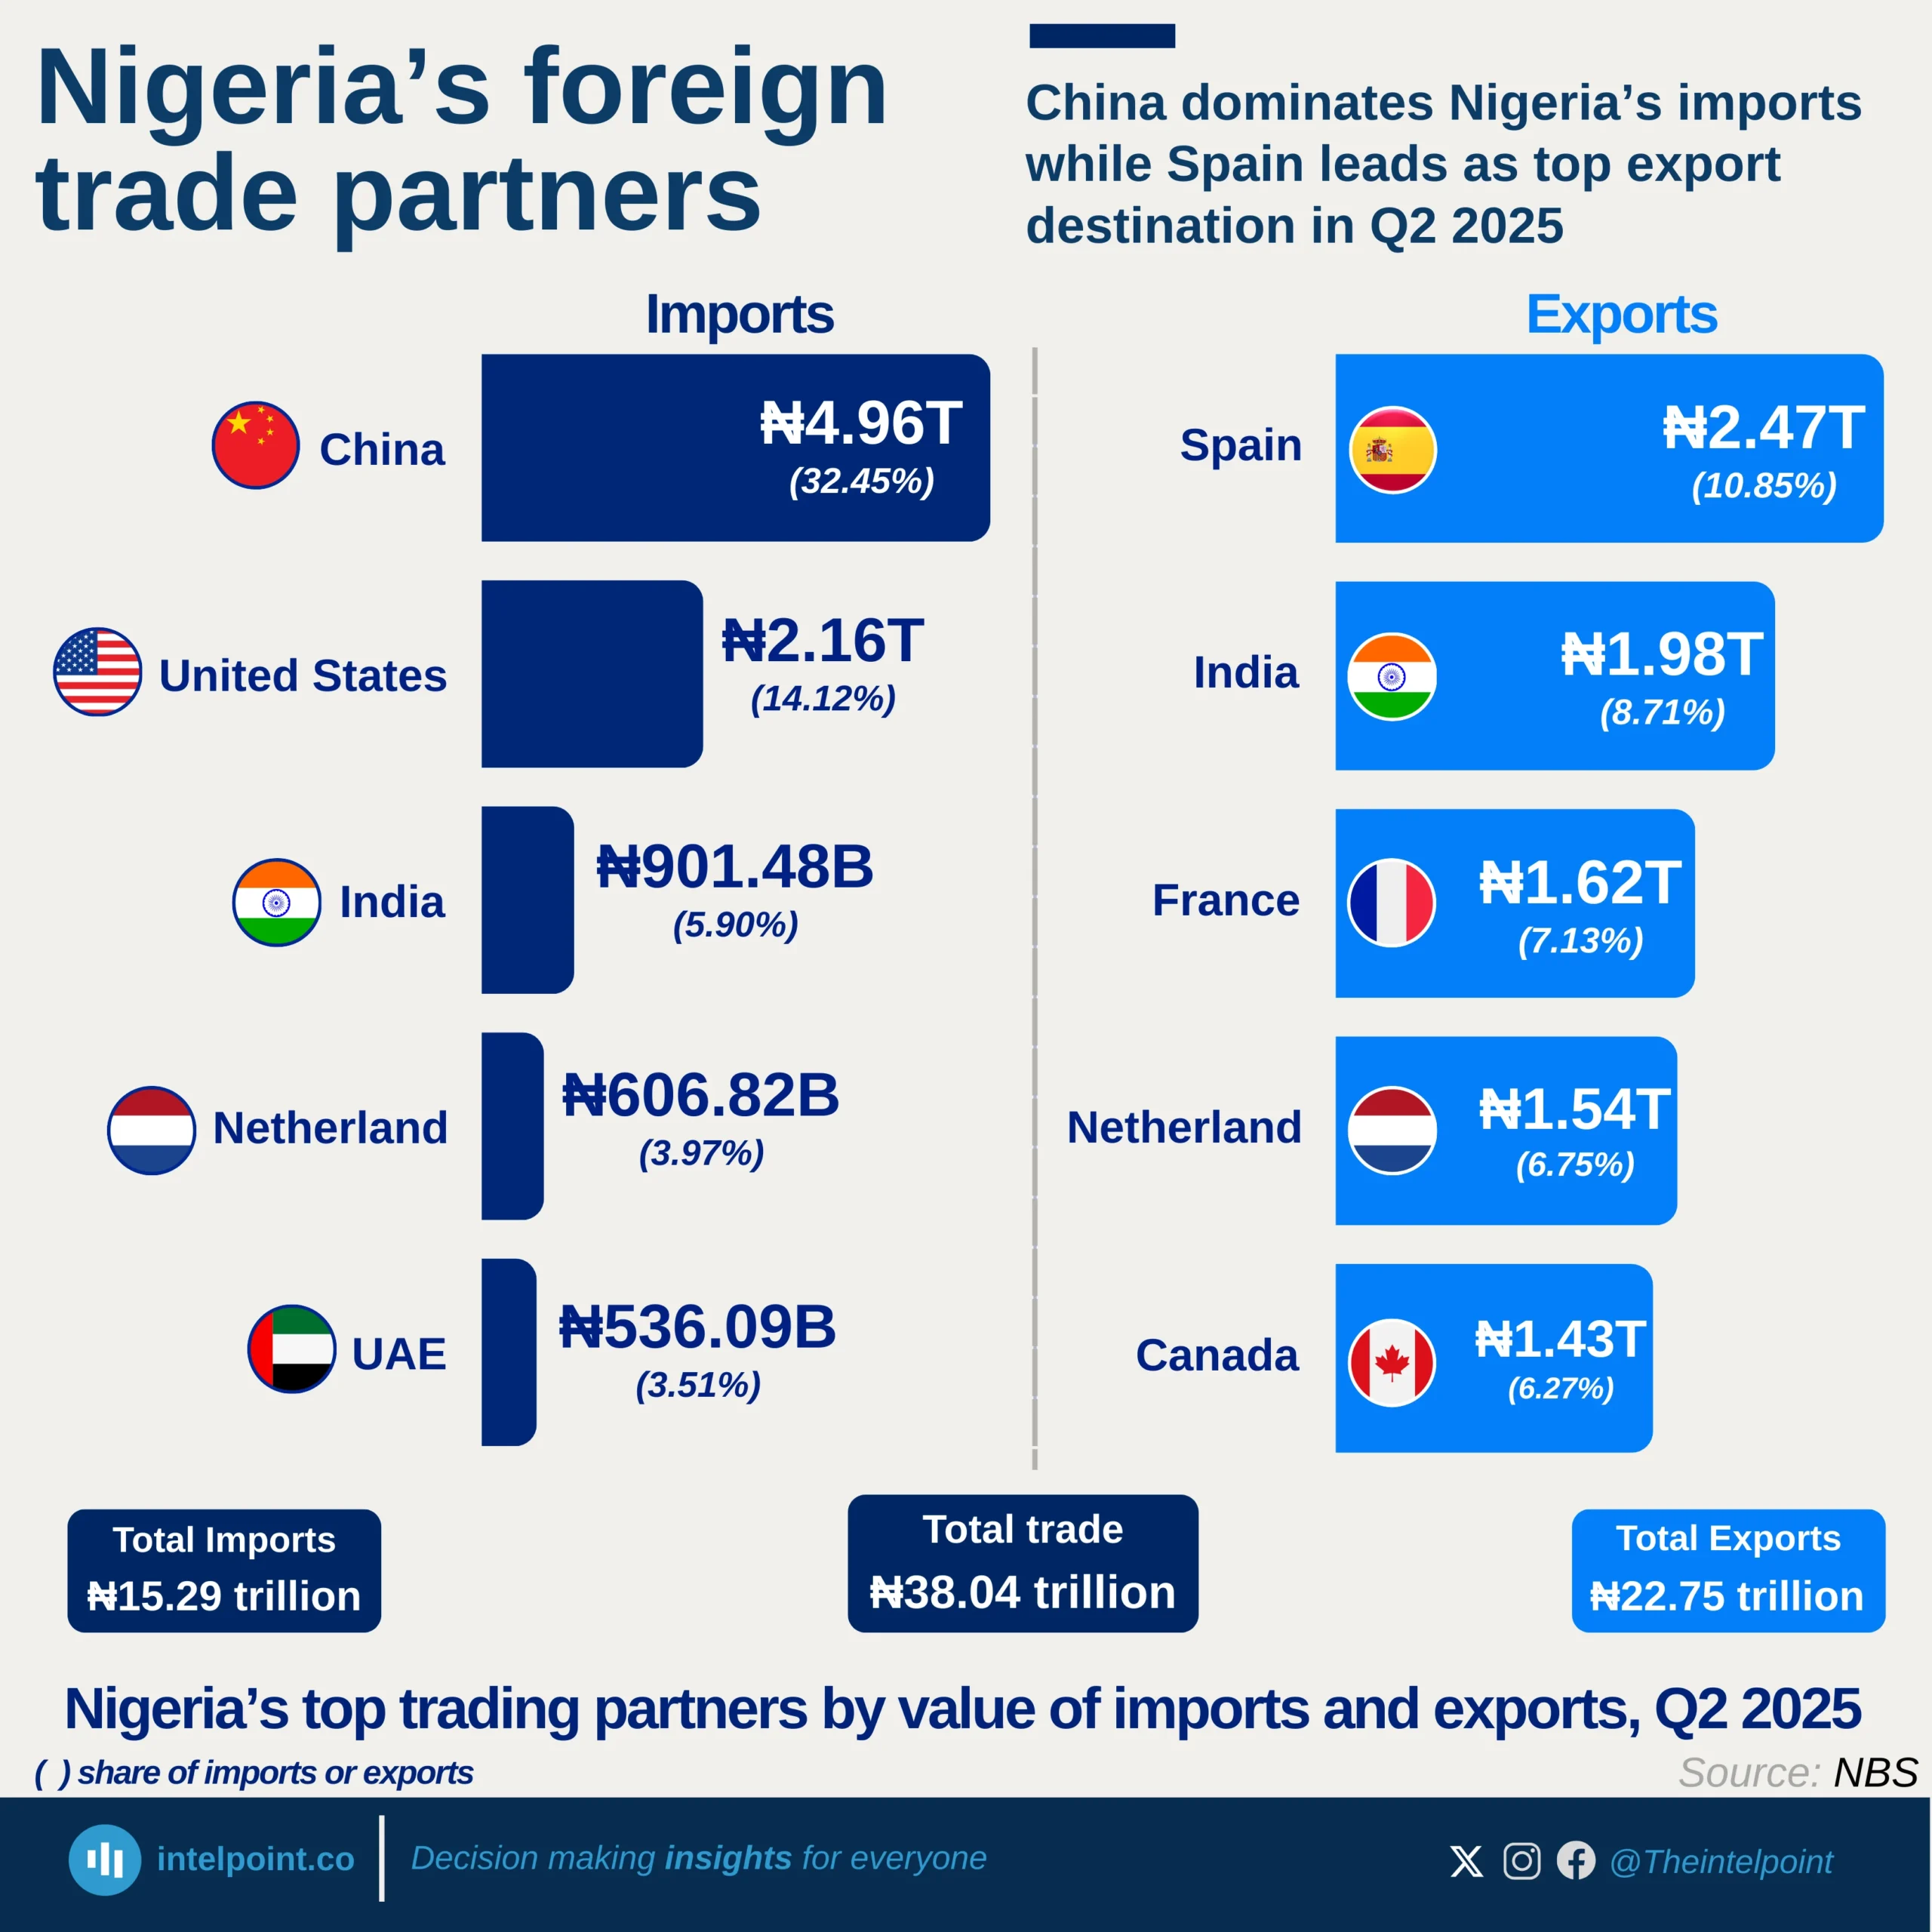
In Q2 2025, Nigeria’s foreign trade reached ₦38.04 trillion, split between ₦15.29 trillion in imports and ₦22.75 trillion in exports. China remained Nigeria’s dominant import partner, accounting for ₦4.96 trillion or 32.45% of total imports, followed by the United States at ₦2.16 trillion (14.12%).

On the export side, Spain emerged as the leading destination, absorbing ₦2.47 trillion worth of goods (10.85%), while India, France, the Netherlands, and Canada also featured prominently. This trade balance highlights Nigeria’s reliance on China and the U.S. for imports, while its export markets are more diversified across Europe, Asia, and North America.

Source:

National bureau of statistics

Period:

Q2 2025
HTML code to embed chart
Want a bespoke report?
Reach out
Tags
Related Insights

Agricultural products led Kenya’s 2024 export economy, with coffee, tea, and spices generating $1.7 bn
  • Agriculture dominated Kenya’s exports, with coffee, tea, and spices alone contributing $1.7 billion, the largest single export category.
  • Mineral fuels were a surprisingly strong second, delivering $1.1 billion, and showing Kenya’s growing role in regional fuel distribution.
  • Horticultural exports (flowers, live plants, and trees) contributed $790 million, reinforcing Kenya’s global strength in floriculture.
  • All other export categories fall below $300 million individually, reflecting a long list of small but diverse export segments such as textiles, vegetables, and pharmaceuticals.

Mining led South Africa’s 2024 exports with 18.7%, as gems and precious metals generated over $20 bn
  • Gems and precious metals were the largest single export category, contributing $20.6 billion.
  • Ores and industrial minerals followed closely with $17.2 billion, showing the country’s reliance on mining.
  • Vehicles and machinery were significant non-mineral exports, with a combined $18.3 billion.
  • Agricultural and light industry products like fruits, nuts, and beverages contributed modestly, strengthening mining and manufacturing’s position as the core export drivers.

Cocoa accounted for 4.6% of Nigeria’s 2024 exports, making it the country’s second-largest export after oil
  • Mineral fuels (including crude oil) accounted for $49.3 billion, or 86.8% of total exports in 2024.
  • Non-oil exports remained marginal, with the second-largest item, cocoa, contributing only 4.6%.
  • Fertilisers, ores, slag, ash, and oilseeds collectively made up less than 5%, indicating limited diversification.
  • All other export categories each contributed 1% or less, underscoring Nigeria’s narrow export base.

Nigeria's energy goods imports have stayed low and stable for 7 years, while exports increased from ₦37B to ₦263B
  • Nigeria’s energy goods exports rose from ₦37.3B in 2017 to ₦262.9B in 2024, before falling to ₦154.2B in H1 2025.
  • Imports remained consistently low, ranging from ₦24.2M to ₦353.1M throughout the period.
  • Export growth outpaced imports, showing a widening trade surplus in energy goods.
  • The 2024 spike in exports represents the highest export value within the nine-year window.
  • Energy imports stayed below ₦400M yearly, indicating low dependency on foreign energy goods.

For most of the period (2013-H1 2025), China's share of Nigeria's imports from Asia hovers around 50%-55%, showing dominance
  • China has dominated Nigeria’s imports from Asia, maintaining a 50–55% share for most of the period.
  • China’s share reached its highest level at 58.6% in H1 2025.
  • India's import share remained volatile, ranging between 11% and 25%.
  • Total imports from Asia surged from ₦2.6 trillion in 2013 to ₦16.4 trillion in H1 2025.

Nigeria's agricultural imports' share has been dropping, from 83.9% (2017) to a low of 42.9% (H1 2025)
  • Agricultural imports fell from 83.9% in 2017 to 42.9% in H1 2025, indicating a significant decline in import dependency.
  • Agricultural exports grew from 16.1% in 2017 to 54.0% in 2024, surpassing imports for the first time since 2017.
  • Total agricultural trade increased from ₦1.1 trillion in 2017 to ₦8.2 trillion in 2024.
  • Between 2022 and 2024, the import share dropped significantly from 75.7% to 46.0%.

POPULAR TOPICS
SIGN UP TO OUR NEWSLETTER
Get periodic updates about the African startup space, access to our reports, among others.
Subscribe Here
Subscription Form

A product of Techpoint Africa. All rights reserved